Abstract
Particle filtration and concentration have great significance in a multitude of applications. Physical filters are nearly indispensable in conventional separation processes. Similarly, microfabrication-based physical filters are gaining popularity as size-based particle sorters, separators, and prefiltration structures for microfluidics platforms. The work presented here introduces a linear combination of obstructions to provide size contrast-based particle separation. Polystyrene particles that are captured along the crossflow filters are packed in the direction of the dead-end filters. Separation of polydisperse suspension of 5 μm and 10 μm diameter polystyrene microspheres is attained with capture efficiency for larger particles as 95%. Blood suspension is used for biocharacterization of the device. A flow induced method is used to improve particle capture uniformity in a single microchannel and reduce microgap clogging to about 30%. This concept is extended to obtain semiquantification obtained by comparison of the initial particle concentration to captured-particle occupancy in a microfiltration channel.
INTRODUCTION
Microfluidics has become one of the major advancing fields for a wide range of applications. Concepts such as point of care (POC) diagnostics,1 lab-on-chip (LOC),2 micro-total-analytical-systems (μ-TAS)3 being applied for efficient drug delivery,4 diagnostics,5 body-fluid analysis,6 digital logic generation,7 droplet generation,8 mixing,9 cell sorting and separation,10–14 counting of cells,15–18 and much more have opened significant research opportunities to this field.
Conventionally, the biological cell analysis and diagnostics required reduction of background cells via differential lysis or sieving through porous membranes. Microfluidics has now made it possible to obtain nondestructive cell separation and diagnostics. Scaling of macro- to microdomain brings dominance of surface forces over volume forces with inherent ordered and controlled flow and unravels the capabilities of separation. A comparison of advantages and limitations of standard filter and microfluidic-passive-filter-based cell separation is shown in Table I. The separation process is broadly categorized and widely explored as passive and active. Active methods of particle separation use external stimuli to selectively affect physical properties of particles. Some frequently used approaches are attachment of magnetic particles to surface markers specific to the cell under consideration, exploiting magnetic properties of particles, activation of cell surface or intracellular components by fluorescent binding agents, and influencing particle movement via externally applied electric field or acoustic energy. Combinations of separation methods have also been paid significant attention for enhanced device performances.19–24 In passive separation methods, physical properties (e.g., size and deformability) of the particles are targeted. Centrifugation, field flow fractionation (FFF), inertial focusing, microfiltration, and deterministic lateral displacement (DLD) are popular examples.25–28 For physical filtration, structures such as porous membranes, fiber matrices, and particle packed beds are used. Microfabricated filtration structures have several advantages over conventional membranes. Feasible fabrication of microstructures has enabled miniaturization of micropores, pillars, and weirs with greater control on filter parameters such as geometry and a uniform pore density giving a sharp cutoff for separation.29–35 An extension to separation is quantification, and various optical and electrical methods of particle counting exist.36–39 These are either laboratory equipment or table top systems. Microfluidics-based systems have brought forth opportunities to make on-chip quantification. Concepts such as flow cytometry, Coulter counter, and hemocytometer are developed with microdevice features.40–51
TABLE I.
Comparison of microfluidics-based passive filtration with standard filters.
| Passive filtration method | Advantages | Limitations | Reference |
|---|---|---|---|
| Standard membrane filters |
|
|
67–70 |
| Microfluidics passive filters |
|
|
51–56 |
Keeping in mind the need for point of care diagnostics for low resource settings, this paper explores the possibility of finding particle quantity estimate via microchannel volume filled levels. The focus of this paper is on qualitative and semiquantitative analysis46 of microparticle separation using MEMS technology with advantages of compactness, simplicity, and fast operation. For channel fabrication, polydimethylsiloxane (PDMS) is used. Filtration efficiency of microfilter structures is studied and analyzed experimentally.
THEORY
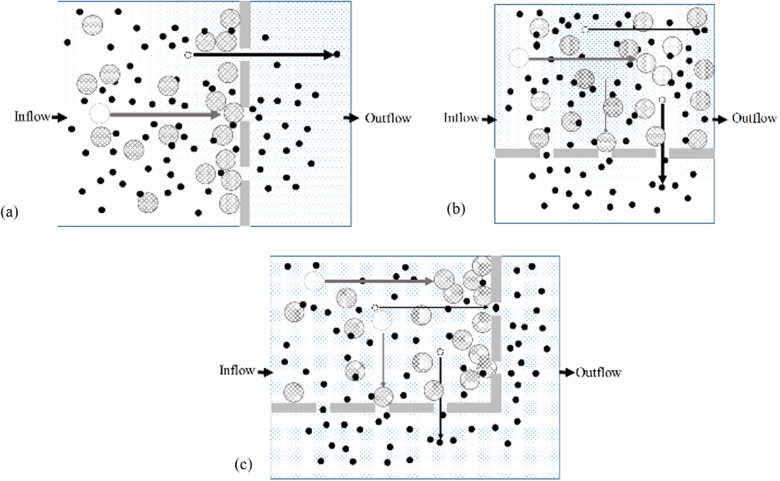
Filtration may refer to the process of separation of one or more entities, such as solid particles, biological cells, and droplets, from a given system of particles in liquid or gaseous medium. This may be achieved via a separation medium such as physical gaps, weirs, sieves, and semipermeable membranes, allowing selective propagation of analyte of interest under a driving force like pressure difference. When particles encounter the filters, the process of separation is generally categorized as normal-flow (n-flow) and tangential-flow (t-flow). In n-flow, obstructions are positioned in the direction of flow [see Fig. 1(a)]. In the t-flow mode, filters are located perpendicular to the flow direction [see Fig. 1(b)] and are reported to be more efficient than the n-flow.47 The larger particles from the carrier medium are separated and retained while smaller particles move toward the outlet as permeate. Due to longitudinal components, the particles pass through the filters, whereas the transverse component drags the particles forward and reduces the unwanted particle accumulation and filter fouling. Previous studies have shown flow induced migration of particles toward the channel sidewall containing lateral flow subchannels.48 The relative sample flow rate in the lateral channel with respect to the main channel (defined by the ratio of respective channel hydraulic resistance) defines the critical size for the particle to be filtered. This is conventionally applied in t-flow devices for control over particle size effusing from the sample domain. Channel aspect ratio, lateral channel width, sample flow rate, and concentration are main parameters for hydrodynamic filtration.49–53
FIG. 1.
Modes of filtration according to filter orientation with respect to flow direction are (a) n-flow with filter opening aligned in the direction of fluid flow, (b) t-flow with filters aligned perpendicular to the flow direction, and (c) combination (c-flow) of n-flow and t-flow filters.
In this study, the focus is to obtain a size-based separation and capture of particles inside a microchannel domain. Sequential arrangement [see Fig. 1(c)] of microfabricated obstructions arranged to form a combination (c-flow) of t-flow (enhanced separation efficiency) and n-flow (particle capture) is used to explore the possibility of single step separation and analysis functionality.
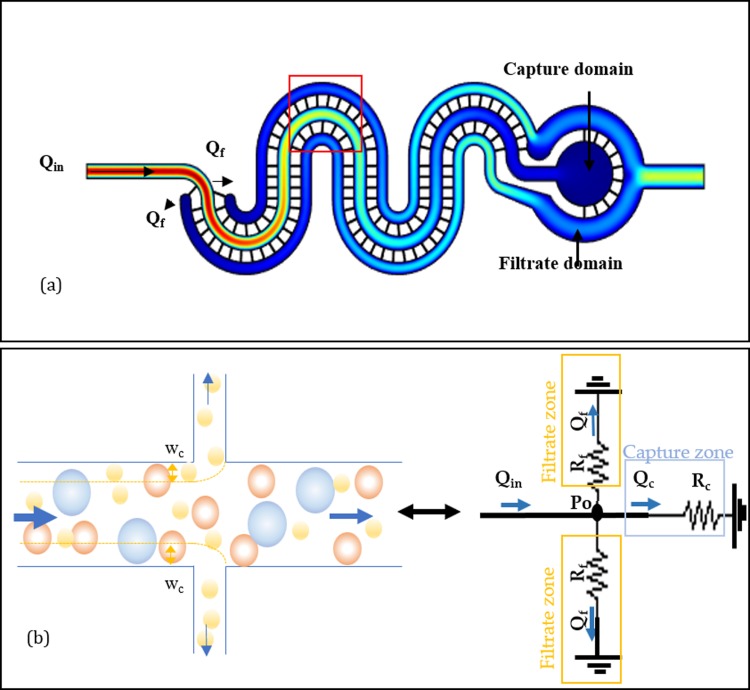
The separation domain consists of two subdomains, namely, capture and filtrate (see Fig. 2). Capture is the domain confiding the main initial flow and filtrate comprises of the effused part of the sample through lateral microfilters. With c-flow arrangement, the main sample streamlines distribute into the capture and filtrate channels via physical obstructions. This relative distribution of the initial sample flow into small lateral flows defines the critical streamline width near the filters that can be estimated using knowledge of the flow distribution in microchannels. The pressure driven flow field in the microchannel is defined by hydrodynamic principles such as Stokes equations given as with ΔP, η, and u representing the pressure drop, solvent viscosity, and flow velocity, respectively. On solving the Stokes equation, one obtains the parabolic flow distribution symmetric about the central axis of channel for incompressible Newtonian fluid, expressed as where hc, wc, and lc represent the channel height, width, and length, respectively. Since the channel geometry and sample viscosity can be kept constant for a separation cycle, the flow equation can be reduced to Q = ΔP/Rch, where Rch is the channel hydrodynamic resistance given as . The presence of filter channels creates a porous wall, and some fraction of the original sample stream flows out in the filtrate domain [see Fig. 2(a)]. The Rch equation shows that microchannel hydraulic resistance varies inversely with the channel width. Hydraulic resistance of filters is higher due to the smaller width (5 μm) than the main channel (width 60 μm). Also, a simplified flow rate equation shows an inverse relation of the flow rate to channel hydraulic resistance; therefore, the relative flow rate of the lateral filters (Qf) is lower than the main flow rate and only a small portion of the main flow leaves the capture domain. The overall hydraulic circuit of the current filter arrangement is shown in Fig. 2(b). The volume of sample fraction entering filtrate zone can be defined by the ratio of the flow rate of sample fraction entering the filter (Qf) to the initial sample flow rate (Qin). Qp = Qf/Qin defines the critical streamline width (wc) entering the filter [see Fig. 2(b)]. As defined by the hydrodynamic separation principle, only particles with a radius lesser or equal to this critical width enter the filter.55 This concept is used in crossflow sorting devices, where critical width is almost constant for an applied flow rate given that the lateral channel geometry remains constant. In the c-flow channel, the flow rate inside the capture channel decreases along the length of the crossflow filtration region. This, however, reduces the critical width further and helps particle capture.57–59
FIG. 2.
(a) Velocity profile of the c-flow design. Qin and Qf show the direction of sample flow and filtrate flow, respectively; (b) schematic and equivalent hydraulic circuit representation of flow through and critical width formation near filter openings.
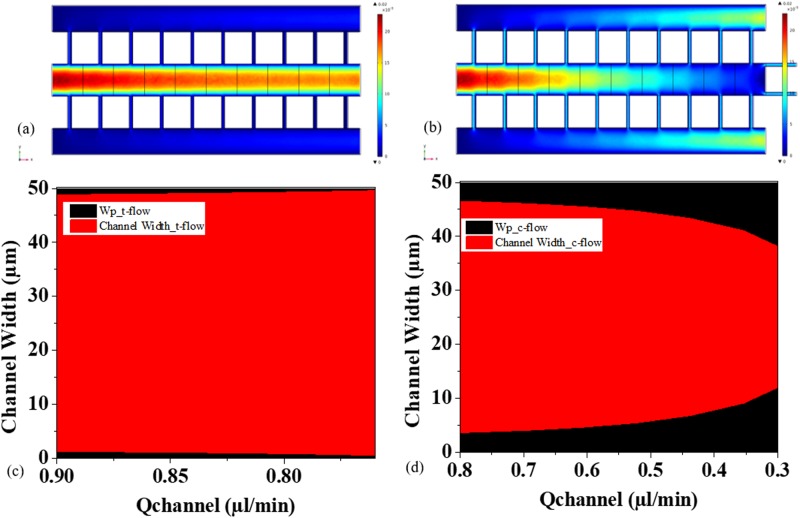
A part of the complete geometry is used to understand the flow profile and distribution of critical streamlines width along the filtration paths created by the array of obstructions arranged in t-flow and c-flow configurations [see Figs. 3(a) and 3(b)]. The n-flow section obtains all particle fractions in-front of the filter and thus the cutoff for the separation. For the study, geometric parameters are same as the fabricated device. The interobstruction gap (filter gap) is kept equal to 5 μm. The main channel width is kept at 60 μm and the height is 30 μm. The c-flow design differs from t-flow only in the presence of filters at the main channel outlet. 1 μl/min is used as the fully developed flow rate at the inlet. Water is used as the material and laminar flow physics is solved to obtain material flow distribution using COMSOL Multiphysics software. The t-flow design maintains the symmetric parabolic profile throughout the channel length, whereas c-flow shows a deacceleration in flow. Since the wp along the lateral openings is proportional to relative flow rate of lateral opening to the main channel, the c-flow design possesses Qp increasing along the flow path. This also suggests that the critical width increases along the lateral filters [see Figs. 3(c) and 3(d)].
FIG. 3.
Simulation analysis of distribution of velocity profile and critical width along the lateral filters in (a) t-flow design and (b) c-flow design. (c) t-flow design shows very small change in critical width compared to (d) c-flow design, where there is an increase in critical width along the filter distribution. Qchannel represents the flow rates inside the channel before the lateral filters. Indirectly, Qchannel also represents the points in channel length.
The critical width wp can be tuned by varying the geometric parameters of the device. Rh is a direct function of the h/w ratio; the flow flux declines for low aspect ratio filters. In order to capture a few micrometer to submicrometer particles, low aspect structures provide further reduction of wp. Thus, for particle size <1 μm, <5 μm weir structures are used in the current c-flow configuration. We have explored the cascaded channels with two cutoffs for serial separation from large particle to small particle collection in separate reservoirs.
Particles possess fixed volume and thus may occupy a definite space in the channel. Particle concentration in a solution presents the number of particles in the given volume of the solution. This information is used to attain quantification in the literature. A hemocytometer is a commonly used low cost solution for blood cell quantification. On a similar principle, a microfluidic channel with graduated volume is reported to provide low concentration suspension cell counts. Another work49 has reported blood to fill a series of channels and compared the filled channels to the hematocrit value of the sample. With similar thoughts when the particles are collected in a reservoir, we assume that the space occupied by the particles may be proportional to the approximate count of particles present in the sample analyte. This concept could be beneficial for screening measurements. However, when a mixture of particles with different sizes is applied to the filtration system, smaller particles may also get retained along with the particles of interest. This may affect the filtration efficiency and could introduce uncertainty in quantification. A holistic approach is used to understand and obtain a simple method for microfluidics-based semiquantification of microparticles.
EXPERIMENTAL PROCEDURES
Fabrication
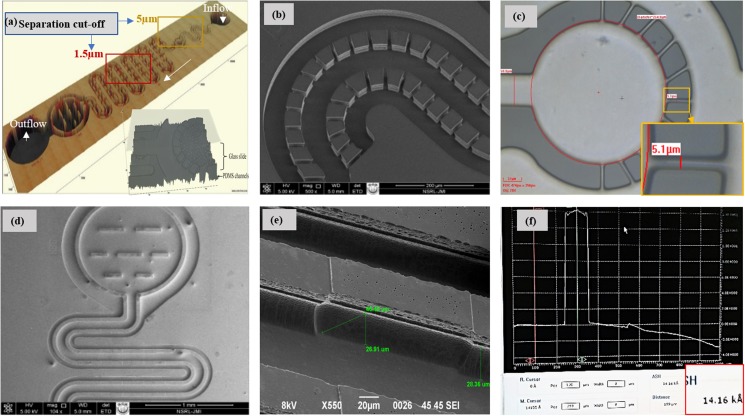
In order to study filtration of particles in a given sample analyte, microstructures are designed using a CAD software. The device structures are fabricated using MEMS technologies. An Si wafer is used as the base support for the Su-8 mold, which is fabricated using standard optical lithography process. Device structures are realized in PDMS substrates by a rapid prototypic technique. PDMS base resin and hardener are mixed in a 10:1 ratio and poured over the SU-8 mold. A 110 °C temperature environment for 10 min is provided to cure PDMS, and the cured PDMS is peeled off gently from the SU-8 mold. PDMS channels are capped with glass slides using low energy oxygen plasma. Device components consist of an inlet and an outlet connected through a network of microfilters. The device inlet is connected to the pillar filters in a crossflow fashion [see Fig. 4(a)]. The analyte solution enters here and starts filtering via an ∼5.1 μm gap between two pillars. Particles with size greater than 6 μm are retained in the channel via dead-end filters [see Fig. 4(b)]. Down the channel, a network of weir filters with a cutoff size of ∼2–3 μm is introduced. Particles smaller than ∼2 μm gap size are filtered in the crossflow mode [see Fig. 4(c)]. A network of a few weir filters in dead-end fashion is used to retain the particles inside the carrier channel. Small wall structures are used to reduce particle loading on the weir dead-end filters in the collection reservoir [see Fig. 4(d)].
FIG. 4.
Microscopic images of filter arrangement of the device: (a) 3D image of the complete device, (b) array of pillar filters (width 5.5–6 μm and 30 μm height) arranged in the t-flow mode, (c) particle collection reservoir with pillar microfilters arranged in the n-flow mode, (d) t-flow arrangement of weir filters (1.5–2 μm) bound via a dead-end weir filter, (e) tilted image of a single weir filter, and (f) height of weir as 1.42 μm measured using a stylus profiler.
Material preparation
Device function is characterized using 1 μm, 5 μm, 10 μm, and 20 μm diameter polystyrene particle suspensions (Polyscience) and blood. Sample dilutions are prepared in a phosphate buffer solution (pH 7.4, Sigma Aldrich). Filtration of blood components is done using standard hemocytometry procedure using commercial white blood cell (WBC) dilution reagent that stains the WBC nucleus. A known quantity of the sample is flowed through the device using a pressure pump. Pressure and flow rate are controlled and monitored via an OB1 controller and an MFS flow sensor of Elvesys, respectively. Experimental observations are drawn using a 3D optical profiler (Zeta) and Elvesys pressure and flow sensors. Filtration process through the device is captured optically, and throughput is measured via a flow sensor. Filtration efficiency is analyzed and calculated using a hemocytometer and ImageJ software.66
Flow setup and procedure
For experimental measurements, a known quantity of particle suspension (mono- or multisize) is taken via a micropipette in the microtip and connected to the inlet. Since the volume of the device is small, diluted (1:20 and 1:100) samples are used for the device characterization. A Teflon tube carrying a phosphate buffer saline (PBS) solution is then inserted inside the microtip to conduct flow. A pressure controller and a sensor unit are used to conduct and measure flow parameters precisely. The particles larger than 6 μm are captured in the pillar filter section; smaller particles (size 5 μm and 1 μm) are filtered in the succeeding channel. The count of particles per microliter of the sample is calculated using a hemocytometer before and after the microfiltration process through the device. A real-time video of the filtration process is captured and analyzed using ImageJ software. Similarly, blood cell filtration is carried out at the CSIR-CEERI dispensary. Whole blood is diluted with the PBS buffer. Filtrate is analyzed using a hemocytometer, and an approximate count is obtained. The filtration efficiency of the retained particles is measured as the ratio of the number of particles introduced in the inlet to the number of particles recovered in the filtrate solution in the range of 0%–100%. Channel volume fill levels are studied to test semiquantification. Filling of the channel is further compacted by the application of alternating pressure. Alternating pressure excitation is given through the carrier liquid (PBS) to PDMS channels to accumulate particles and reduce the channel clogging. PDMS filters deformation due to flow is experimentally analyzed. Optical registration of the real-time flow through the microchannel device is made using a 3D optical profilometer.
RESULTS AND DISCUSSION
Flow and filtration characterization of device
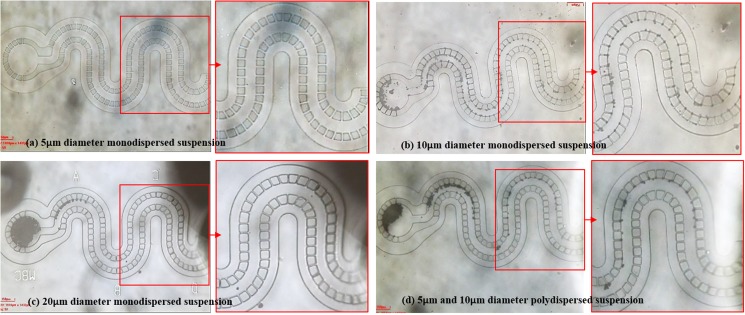
The effect of the varying the Qp ratio is analyzed in the device with taking suspensions of particles with size contrast as 5 μm, 10 μm, and 20 μm. Suspensions in mono and multiparticles were introduced at 100 mbar pressure to the channel. The filter gap is around 5.5–6.5 μm. Particles larger than the gap and the critical streamline should get collected in the main flow channel, filling from the collection reservoir (with n-flow filters) toward the inlet direction (see Videos S1 and S2 in the supplementary material). Since wp is least near the inlet, therefore, the region near the inlet is zoomed for analysis. 1 and 5 μm particle suspensions pass through the filtration gaps, and no collection is obtained [see Fig. 5(a)]. 10 μm particles get trapped throughout the filters with the capture concentration more near the collection reservoir indicating their size equality to wp as shown in Fig. 5(b). Figure 5(c) shows that 20 μm particle suspensions filled the collection reservoir first, which supports the fact of their size being much larger than the filter gap and wp indicated by the empty region near the inlet. 5 μm and 10 μm microsphere suspensions show a partial collection in the reservoir and near the lateral filters [see Fig. 5(d)]. This analysis shows that the present design with 5.1 μm cutoff retains particles with size 10 μm and larger. Packing efficiency increases as the size increases above 10 μm.
FIG. 5.
Size-based particle capture inside the microchannel with a filter gap of 5.1 μm: (a) flow of 5 μm particle suspension did not get captured near filters, (b) 10 μm diameter particles are captured in the reservoir and some crossflow filters also near the inlet region, (c) 20 μm diameter particles captured and filled the n-flow zone first and the region near inlet is empty, (d) suspension of 5 μm and 10 μm particles also showed partial filling of the capture, whereas some accumulated near t-flow regions.
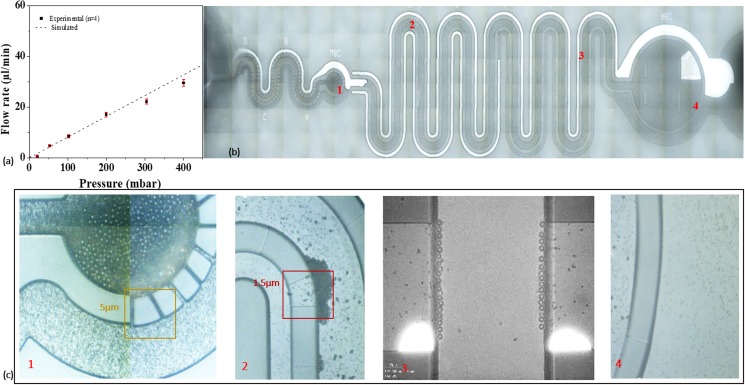
The size contrast-based separation and collection is used to carry out filtration characterization of the device. For a nondeforming channel, the flow rate varies linearly with the applied pressure difference. Hydrodynamic behavior is evaluated with a control baseline using a PBS solution [see Fig. 6(a)]. Deformation in PDMS is observed to be small and can be neglected. Microfiltration and subsequent channel clogging are analyzed using a mixture of polystyrene microsphere suspensions of 10 μm, 5 μm and 1 μm particle diameters. It is seen that large particles (10 μm in diameter) are captured [see Fig. 6(b)] passing only 5 μm and 1 μm particles toward the weir filter section [see Fig. 6(c), magnification 20×)]. Figure 4(d) is a magnified (50×) view of 5 μm and part of 1 μm particles retained around the weir gaps. The outlet had the smallest, i.e., 1 μm, beads [see Fig. 6(e)]. Capture efficiency of 10 μm particles obtained is 95% at a sample flow rate 20 μl/min is observed.
FIG. 6.
Particle microfiltration through the device: (a) baseline flow profile of device, (b) filtration of polystyrene beads of diameters 10, 5, and 1 μm through the device, (c) magnified view of different sections of the device with the larger particles (10 μm) filtered in filter section 1 (at 20×), filtration of intermediate sized, i.e., 5 μm in weir filter section 2 (at 20×) and 3 (at 50×). 1 μm sized beads are found in section 4 (at 20×) of the device.
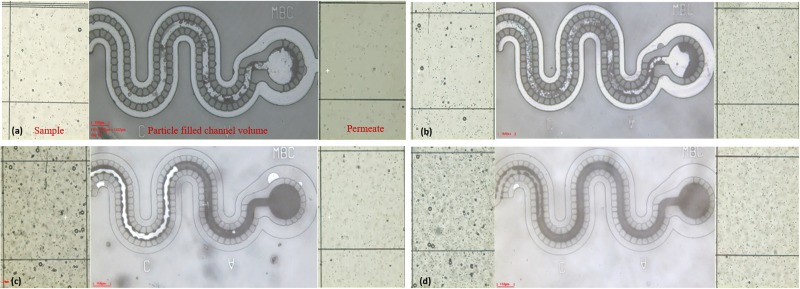
Volume of space occupied by particles in the channel can be related to the number of particles. Overlapping of particles, air gaps, deformability of particles, and channel material compliance are some of the parameters that limit the accuracy of count determination. However, in several point of care applications, an approximate count determination can also be beneficial. A test for feasibility of semiquantification is attempted here. For semiquantification, a fixed volume of polystyrene beads suspension [concentrations in wt. %: (a) 0.125, (b) 0.375, (c) 0.625, and (d) 0.875] is introduced to the device and filling of the channel is captured optically. The channel fill level increased with the bead concentration (see Fig. 7).
FIG. 7.
Filtration of 10 μm particle in a polydisperse particle suspension with concentrations (wt. %) as (a) 0.125, (b) 0.375, (c) 0.625, and (d) 0.875.
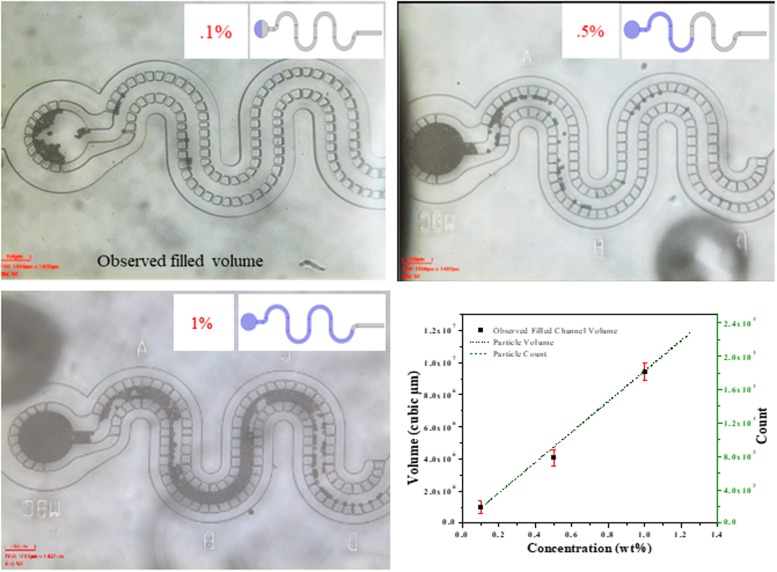
Different filled levels are experimentally investigated further (using monodisperse particle suspension) to relate to an analytically calculated particle count (for detail, see Table S3 in the supplementary material and Fig. 8). The total volume occupied by particles in a given concentration per unit suspension volume is related to the particle count.
FIG. 8.
Particle concentration and channel volume filling comparison obtained by 10 μm monodisperse particle suspension. Analytically calculated volume and count of microparticles for given concentration are compared with experimentally obtained filled microchannel volume with equivalent particle concentrations.
Factors affecting particle packing and filtration efficiency
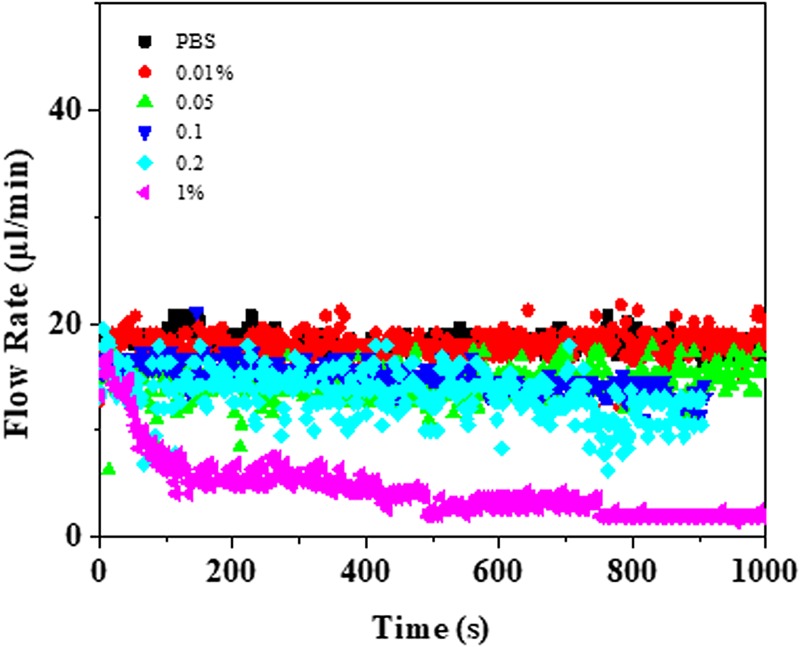
A characteristic of the n-flow (also referred as dead-end) system is a continuous drop in the device throughput with time as the particles are retained inside the system. T-flow (also called crossflow) provides a constant flux as retention does not take place, but suffers a slight decrease in throughput due to filter clogging; this is characterized via a decrease in the constant throughput with time. The combination system provides a constant throughput as long as retained particles start to fill a complete domain. Mathematically, the separation behavior can be analyzed using the Darcy equation. Under a limiting flux behavior, the permeate flux is proportional to the applied driving force and can be expressed as , where, Jp is the permeate flux, Δpeff is the effective pressure difference across the system, η denotes the sample viscosity, and RT is the total resistance to flow; also, it can be seen that the flux can be tuned with applied pressure and total flow resistance. Under a constant applied pressure system, flow resistance builds up with particle retention and can be resolved in channel hydraulic resistance (Rch) and the resistance due to retained particles (Rp), i.e., , where , α is the specific resistance, and Mp is the particle mass per unit solvent volume.60 Figure 10 shows the throughput vs time plot for monoparticle suspension concentrations (wt/v) of 0.01%, 0.05%, 0.1%, 0.2%, and 1%. The system shows a constant flux with a slight decreased throughput as the particle concentration is increased from 0% to 0.2%, and this matches with the crossflow behavior as several crossflow microgaps are open for solvent flow (see Fig. 9). With 1% concentration, the throughput decreases to almost the no-flow condition depicting the system saturation.
FIG. 10.
Dominating clogging mechanisms in the device are (a) pore blocking, (b)cake layer buildup, and (c) decline in permeate flow rate with clogging (no. of measurements, n = 3).
FIG. 9.
Variation in the throughput behavior of the device with suspension concentration and time.
During separation process, the large particles are retained in the main channel and start stacking around the filter while small particles may pass through the filters. It is often seen that the large particles may retard and become immobile around the filter gaps (low velocity regions near walls) before the collection reservoir. Capture of larger particle due phenomenon such as inertial impaction may seed stacking of similar particles around it for convection and van der Waals adhesive forces.61–63 With the presence of several parallel paths for fluid streams, it becomes difficult to dislodge those particles to fill the collection region under a constant pressure environment. Also, while some particles get filtered, part of small particles may get trapped with the large particles due to surface forces and steric stabilization. With a more forward flow, more filters get clogged and any further filtration may cease. The device presented showed pore blocking and cake layer formation as the dominant clogging mechanisms (see Fig. 10). Monodispersed particles larger than the filter gap caused blocking of pores, while polydisperse suspension led to the buildup of a cake layer. Decay of permeate flow rate under constant applied pressure is shown in Fig. 10(b). 100 μl of 0.3% (wt.) of polystyrene particles are taken and flowed through the filtration device at constant pressure. Measurements are repeated three times (n = 3). Flow rate plots of polystyrene beads are obtained against PBS baseline.
For semiquantification, channel filling from the end of the collection reservoir to the direction opposite to the sample flow is desired. A particle trapped before the collection reservoir may act as an obstruction, and the channel filling pattern may get disrupted. To reduce this phenomenon with conventional membrane processes, solvent backwashing and sonication chemical treatment are the common processes used to remove clogs.64,65 Filtration capabilities with periodic negative pressure peaks are reported to be more efficient than the steady state method.64 In yet another work, vibrating pressure is demonstrated for the n-flow pillar filter to separate spiked circulating tumor cells with 99% separation efficiency. Vibrating pressure is suggested to reduce the shear induced adhesion in comparison to the steady state method.65 In this work, alternating pressure is used in conjunction with steady state value to enhance the particle packing. Alternating pressure stimulation has shown to reduce the undesirable particle accumulation. With changing pressure, the particles induce a forward–backward movement, which increases the probability of bringing particles to higher velocity regions to move further toward the collection. The signal alteration rate below 0.5 s is not a perfect sinusoidal signal but acts like a perturbation. Higher rate of pressure change has shown to be more effective for filtration. For this work, 0.1 s is used as the time for the rate of change of pressure. At such an alternation, there is a backward motion of particles when the pressure decreases to 0 mbar. Thus, a negative pressure source is not required for backward movement of analyte.
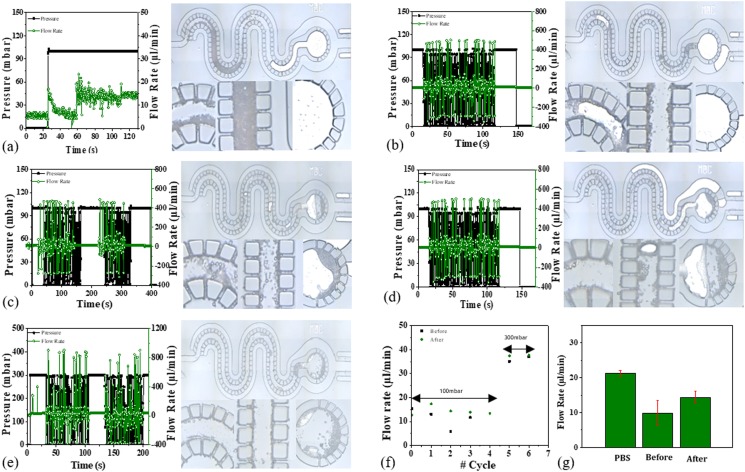
A three particle system (1 μm, 5 μm, and 10 μm diameter) is used to assess the effect of alternating pressure on microfiltration. Since the magnitude of pressure is maintained, the cake layer is seen and early stacking of particles reduced significantly. Figure 11 shows the postfiltration pictures after constant pressure [Fig. 11(a)] and multiple cycles of alternating pressure [Figs. 11(c)–11(e)]. On applying alternating pressure via PBS solution, the dispersed beads seem to move toward the collection reservoir. The changing pressure does not cause extensive displacement of particles off their path; however, the particles immobilized in interparticle gaps may feel mechanical disturbance and break off from the trapped state to a mobile phase. This is checked via the measurement of flow rate at a constant as well as a small duration cycle of alternating pressure at equivalent magnitude. The flow rate decreased after constant pressure application, while an increase was seen after every cycle applied [see Figs. 11(f) and 11(g)].
FIG. 11.
Effect of alternating pressure on filtration through the device. (a) At a constant pressure, the permeate flow declined due to particle retention and partial clogging of filter gaps. With the application of alternating pressure cycles in (b) to (e), the permeate flow rate improved. (f) Summary of #cycles are shown graphically and (g) multiple measurements of permeate flow for control (PBS) and 0.3% polystyrene bead suspension before and after alternating pressure excitations for three devices (n = 3). Value 0 on #cycle axis indicates average flow rate measured at constant pressure (100 mbar), 1–4 at alternating pressure cycles from 0 to 100 mbar at 0.1 s rate, 5 and 6 represent the flow rate measured at alternating pressure from 0 to 300 mbar at 0.1 s rate.
The particles seem to fill the channel more uniformly with alternating pressure cycles compared to only the constant pressure environment. Similarly, different devices are tested before and after application of alternating pressure stimuli. 10 μl of the suspension with known concentration is introduced at 100 mbar to the device, followed by 200 μl of the PBS medium with pressure from 0 mbar to 100 mbar alternating at 0.1 s. Underoscillating flow particles get collected in the main channel and pack toward the collection reservoir. Videos S6 and S7 in the supplementary material demonstrate that the filtration increases with a high rate of change and the gradient against minimum applied pressure difference at 0 mbar. Figures 12(a) and 12(b) presents the channel filling before and after alternating pressure signal for particle concentrations of 0.2%, 0.5%, and 1% (wt.).
FIG. 12.
Effect of pressure perturbation on channel filling with varying particle concentrations (wt. %) of (a) 0.5% and (b) 1%.
Blood cell separation performance
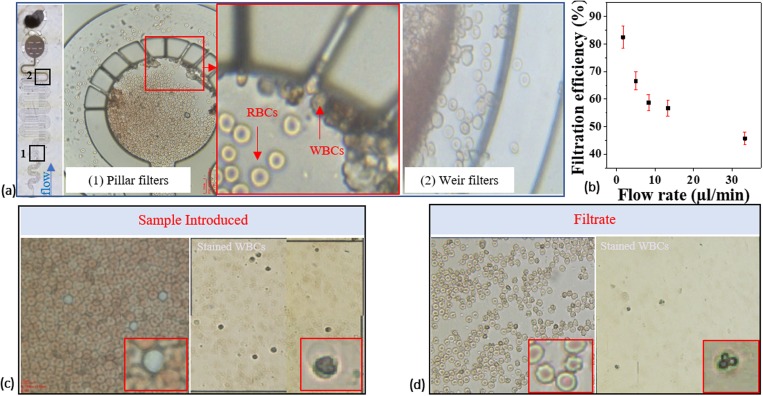
Blood cell filtration and the effect of alternating pressure on cell capture efficiency are also evaluated. Blood consists of cellular and fluid components. The cells are of different sizes and thus favorable to be separated via microfilters. Unlike polystyrene particles, biological cells are deformable. Size and shape of cells may easily get influenced by shear flow, which may effect cells to escape from smaller gaps (see Video S2 in the supplementary material for blood flow through microfilter gaps). For this study, the blood sample is diluted with PBS with dilution factor of 20. Filtration performance of the device is assessed with the blood sample (see Fig. 13) with an average WBC count of (10 552.5 cells/μl), which is introduced to the device at different flow rates with PBS as the carrier medium. Figure 13(a) shows WBCs captured in pillar and weir filter sections of the device. Applied pressure was varied to determine the operating condition for separation. Figure 13(b) shows a decline in the WBC capture efficiency with the sample flow rates. The filtrate was treated with the WBC diluting reagent, which lyses red blood cells (RBCs) and stains WBCs. Cell counts in the filtrate were determined using a hemocytometer. As the operating pressure is increased to gain flow rates, cells may experience higher shear force and pass through much smaller gaps giving residues and small number of WBCs in the filtrate [see Figs. 13(c) and 13(d)]. Performance comparison of existing works inline to current research is provided in Table II.
FIG. 13.
Blood cell filtration through the device shows the WBCs captured in (a) the pillar region with a magnified image showing the WBC collection near the filters. Some of the WBCs also got caught in the weir section. (b) The capture efficiency for WBCs for a given flow rate. Microscopic images of the blood sample (c) before and (d) after separation. For cell separation analysis, the blood sample is processed for staining and enumeration of white blood cells using a hemocytometer. Unstained and stained cells are shown in the zoomed sections of the images.
TABLE II.
Performances of linear array constriction-based leukocyte separation methods.
| Obstruction-based separation method | Throughput (μl/min) | Feature size (μm) | Sample dilution ratio | Separation efficiency (%) | Particle capture | On-chip analysis | Reference |
|---|---|---|---|---|---|---|---|
| Microfabricated membrane | 16.66 | 4 | 0 | ∼27.4 | Yes | Yes | 51 |
| Pillar N-flow | 15–50 | 5.5 | 0 | ∼18–25 | Yes | Yes | 54 |
| Weir N-flow | 3–15 | 3 | 0 | 60 | Yes | Yes | 42 |
| Pillar T-flow | 5 | 2.5 | 0 | >97 | No | No | 33 |
| Weir T-flow | 10 | 2.4 | 10 | 27.4% | No | No | 53 |
| Current device | 1–20 | ∼1.5 | 20 | 82 | Yes | Yes | … |
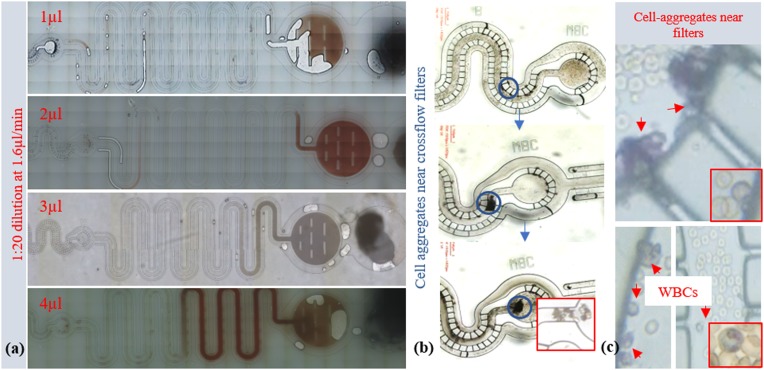
Weir filters captured more than 85%–90% of RBCs; therefore, volume filling-based quantification is conducted for RBCs in the weir section of the device. A sample of the same concentration in increased volume steps is taken and introduced to the inlet tubing containing PBS as the carrier liquid to avoid the air gap and is connected to the device inlet. Filtration was carried out at 10 mbar pressure for to allow a total flow of 10 μl suspension. The channel fill with RBCs increased with the initial volume taken [see Fig. 14(a)].
FIG. 14.
RBCs captured in the weir filter section. Different volume of blood suspension followed by 10 μl of PBS buffer introduced to the device at 10 mbar pressure. (a) Channel fill level increased with sample volume. (b) Effect of alternating pressure on trapped white blood cells in crossflow regions; under constant applied pressure cells accumulate near crossflow filters, cell aggregates move under alternating pressure (amplitude 10 mbar at rate 0.1 s) and form bigger cell aggregates expanding toward the channel center higher velocity region and move with the forward carrier flow. (c) Magnified regions where WBCs accumulated.
Similar to 10 μm PS beads [Fig. 14(b)], some of the WBCs also get trapped near the t-flow regions. Flow alternating at 10 mbar operating pressure is used to dislodge these WBCs. The flow induced method, when used for blood samples, added to and fro motion to the carrier fluid, and cells trapped near crossflow regions [Fig. 14(a)] started to dislodge from low velocity regions near crossflow gaps and grouped together for cell–cell interactions to form bigger cell aggregate. These aggregates encompassed higher velocity regions of the channel [Fig. 14(b)] and moved to the collection reservoir [Fig. 14(c) and see supplementary material videos]. For visualization of collection of cells from crossflow filter regions, cell suspension was prepared in 0.9% glutaraldehyde, and the addition of a filtered May–Grünwald stain was used. Details of the existing point-of-care-based methods for cell quantification are provided in Table III.
TABLE III.
Point of care microfluidic methods for particle quantification.
| Technique | Quantity(μl) | Operating time (min) | Require sample preparation | Type of measurement | Reference |
|---|---|---|---|---|---|
| Hemacytometer | 10 | User dependent | Yes | Manual counting of RBCs and WBCs | 41 |
| Centrifugation | <3 | 3 | No | Hematocrit | 45,50 |
| electrical counter | 11 | 20 | No | Complete blood cell count | 47 |
| Microcounter | 1 | Not available | Yes | Manual counting of epithelial cells | 48 |
| Channel filling-based method | 0.5–1.5 | 1 | No | Image processing, hematocrit | 49 |
| Current method | 1 | 5–10 | No | Filled level observation, hematocrit (at present) | … |
CONCLUSION
Crossflow and normal-flow combination separation of polystyrene particles and blood cells with sizes of 10 μm and above is obtained with capture efficiency around 95% and 85%, respectively. This capture is used to demonstrate the semiquantification of a given size of particles based on the calibration of channel fill volume with particle concentration. Since volume filling is of importance, clogging and random accumulation of particles is reduced by using cycles of alternating pressure. Particle packing is enhanced using high frequency of pressure alternating at 0.1 s per cycle, coupled with constant pressure. This concept can be useful to design low cost POC devices.
SUPPLEMENTARY MATERIAL
See the supplementary material for additional supporting information on separation and flow parameters.
ACKNOWLEDGMENTS
This work was supported by CSIR-CEERI, Pilani, India, and Department of Science and Technology, Delhi, India (INSPIRE fellowship). The authors would like to acknowledge the CSIR-CEERI dispensary for their support for biological characterization of device.
REFERENCES
- 1.Gubala V., Harris L. F., Ricco A. J., Tan M. X., and Williams D. E., “Point of care diagnostics: Status and future,” Anal. Chem. 84(2), 487–515 (2011). 10.1021/ac2030199 [DOI] [PubMed] [Google Scholar]
- 2.Lafleur J. P., Jönsson A., Senkbeil S., and Kutter J. P., “Recent advances in lab-on-a-chip for biosensing applications,” Biosens. Bioelectron. 76, 213–233 (2016). 10.1016/j.bios.2015.08.003 [DOI] [PubMed] [Google Scholar]
- 3.Gomez F. A., “The future of microfluidic point-of-care diagnostic devices,” Bioanalysis 5(1), 1–3 (2013). 10.4155/bio.12.307 [DOI] [PubMed] [Google Scholar]
- 4.Ziaie B. et al, “Hard and soft micromachining for BioMEMS: Review of techniques and examples of applications in microfluidics and drug delivery,” Adv. Drug Delivery Rev. 56(2), 145–172 (2004). 10.1016/j.addr.2003.09.001 [DOI] [PubMed] [Google Scholar]
- 5.Khan I. U., Serra C. A., Anton N., and Vandamme T., “Microfluidics: A focus on improved cancer targeted drug delivery systems,” J. Control. Release 172(3), 1065–1074 (2013). 10.1016/j.jconrel.2013.07.028 [DOI] [PubMed] [Google Scholar]
- 6.Becker H. and Gärtner C., “Microfluidics-enabled diagnostic systems: Markets challenges, and examples,” in Microchip Diagnostics: Methods in Molecular Biology (Humana Press, 2017), pp. 3–21. 10.1007/978-1-4939-6734-6_1 [DOI] [PubMed] [Google Scholar]
- 7.Zhang Q., Zhang M., Deghlaf L., Bataille J., Gamby J., Haghiri-Gosnet A. M., and Pallandre A., “Logic digital fluidic in miniaturized functional devices: Perspective to the next generation of microfluidic lab-on-chips,” Electrophoresis 38, 953 (2017). 10.1002/elps.201600429 [DOI] [PubMed] [Google Scholar]
- 8.Joensson H. N. and Andersson Svahn H., “Droplet microfluidics—A tool for single-cell analysis,” Angew. Chem. Int. Ed. 51(49), 12176–12192 (2012). 10.1002/anie.201200460 [DOI] [PubMed] [Google Scholar]
- 9.Lee C. Y., Wang W. T., Liu C. C., and Fu L. M., “Passive mixers in microfluidic systems: A review,” Chem. Eng. J. 288, 146–160 (2016). 10.1016/j.cej.2015.10.122 [DOI] [Google Scholar]
- 10.Sajeesh P. and Sen A. K., “Particle separation and sorting in microfluidic devices: A review,” Microfluid. Nanofluid. 17(1), 1–52 (2014). 10.1007/s10404-013-1291-9 [DOI] [Google Scholar]
- 11.Shields C. W. IV, Reyes C. D., and López G. P., “Microfluidic cell sorting: A review of the advances in the separation of cells from debulking to rare cell isolation,” Lab Chip 15(5), 1230–1249 (2015). 10.1039/C4LC01246A [DOI] [PMC free article] [PubMed] [Google Scholar]
- 12.Yu Z. T. F., Aw Yong K. M., and Fu J., “Microfluidic blood cell sorting: Now and beyond,” Small 10(9), 1687–1703 (2014). 10.1002/smll.201302907 [DOI] [PMC free article] [PubMed] [Google Scholar]
- 13.Warkiani M. E., Wu L., Tay A. K. P., and Han J., “Large-volume microfluidic cell sorting for biomedical applications,” Annu. Rev. Biomed. Eng. 17, 1–34 (2015). 10.1146/annurev-bioeng-071114-040818 [DOI] [PubMed] [Google Scholar]
- 14.McFaul S. M., Lin B. K., and Ma H., “Cell separation based on size and deformability using microfluidic funnel ratchets,” Lab Chip 12(13), 2369–2376 (2012). 10.1039/c2lc21045b [DOI] [PubMed] [Google Scholar]
- 15.Wang S., Tasoglu S., Chen P. Z., Chen M., Akbas R., Wach S., and Demirci U., “Micro-a-fluidics ELISA for rapid CD4 cell count at the point-of-care,” Sci. Rep. 4, 3796 (2014). 10.1038/srep03796 [DOI] [PMC free article] [PubMed] [Google Scholar]
- 16.Hassan U., Watkins N. N., Edwards C., and Bashir R., “Flow metering characterization within an electrical cell counting microfluidic device,” Lab Chip 14(8), 1469–1476 (2014). 10.1039/c3lc51278a [DOI] [PubMed] [Google Scholar]
- 17.Yager P., Domingo G. J., and Gerdes J., “Point-of-care diagnostics for global health,” Annu. Rev. Biomed. Eng. 10, 107–144 (2008). 10.1146/annurev.bioeng.10.061807.160524 [DOI] [PubMed] [Google Scholar]
- 18.Tan S. J., Yobas L., Lee G. Y., Ong C. N., and Lim C. T., “Microdevice for the isolation and enumeration of cancer cells from blood,” Biomed. Microdevices 11(4), 883–892 (2009). 10.1007/s10544-009-9305-9 [DOI] [PubMed] [Google Scholar]
- 19.Petersson F., Åberg L., Swärd-Nilsson A. M., and Laurell T., “Free flow acoustophoresis: Microfluidic-based mode of particle and cell separation,” Anal. Chem. 79(14), 5117–5123 (2007). 10.1021/ac070444e [DOI] [PubMed] [Google Scholar]
- 20.Cushing K., Undvall E., Ceder Y., Lilja H., and Laurell T., “Reducing WBC background in cancer cell separation products by negative acoustic contrast particle immuno-acoustophoresis,” Anal. Chim. Acta 1000, 256–264 (2018). 10.1016/j.aca.2017.11.064 [DOI] [PMC free article] [PubMed] [Google Scholar]
- 21.Li W., Zhang Y., Reynolds C. P., and Pappas D., “Microfluidic separation of lymphoblasts for the isolation of acute lymphoblastic leukemia using the human transferrin receptor as a capture target,” Anal. Chem. 89(14), 7340–7347 (2017). 10.1021/acs.analchem.7b00377 [DOI] [PubMed] [Google Scholar]
- 22.Gaines P. and Wojchowski D. M., “pIRES-CD4t, a dicistronic expression vector for MACS-or FACS-based selection of transfected cells,” Biotechniques 26(4), 683–688 (1999). 10.2144/99264st04 [DOI] [PubMed] [Google Scholar]
- 23.Ng A. H., Choi K., Luoma R. P., Robinson J. M., and Wheeler A. R., “Digital microfluidic magnetic separation for particle-based immunoassays,” Anal. Chem. 84(20), 8805–8812 (2012). 10.1021/ac3020627 [DOI] [PubMed] [Google Scholar]
- 24.Hejazian M., Li W., and Nguyen N. T., “Lab on a chip for continuous-flow magnetic cell separation,” Lab Chip 15(4), 959–970 (2015). 10.1039/C4LC01422G [DOI] [PubMed] [Google Scholar]
- 25.Pamme N., “Continuous flow separations in microfluidic devices,” Lab Chip 7(12), 1644–1659 (2007). 10.1039/b712784g [DOI] [PubMed] [Google Scholar]
- 26.Amasia M. and Madou M., “Large-volume centrifugal microfluidic device for blood plasma separation,” Bioanalysis 2(10), 1701–1710 (2010). 10.4155/bio.10.140 [DOI] [PubMed] [Google Scholar]
- 27.Giddings J. C., “Field-flow fractionation,” Chem. Eng. News 66, 34–45 (1988). 10.1021/cen-v066n041.p034 [DOI] [Google Scholar]
- 28.Kuntaegowdanahalli S. S., Bhagat A. A. S., Kumar G., and Papautsky I., “Inertial microfluidics for continuous particle separation in spiral microchannels,” Lab Chip 9(20), 2973–2980 (2009). 10.1039/b908271a [DOI] [PubMed] [Google Scholar]
- 29.Tu J., Qiao Y., Xu M., Li J., Liang F., Duan M., and Lu Z., “A cell sorting and trapping microfluidic device with an interdigital channel,” AIP Adv. 6(12), 125042 (2016). 10.1063/1.4972794 [DOI] [Google Scholar]
- 30.Nagrath S., Sequist L. V., Maheswaran S., Bell D. W., Irimia D., Ulkus L., and Ryan P., “Isolation of rare circulating tumour cells in cancer patients by microchip technology,” Nature 450(7173), 1235 (2007). 10.1038/nature06385 [DOI] [PMC free article] [PubMed] [Google Scholar]
- 31.Warkiani M. E., Lou C.-P., and Gong H.-Q., “Fabrication of multi-layer polymeric micro-sieve having narrow slot pores with conventional ultraviolet-lithography and micro-fabrication techniques,” Biomicrofluidics 5(3), 036504 (2011). 10.1063/1.3637630 [DOI] [PMC free article] [PubMed] [Google Scholar]
- 32.Stott S. L., Hsu C. H., Surkov D. I., Yu M., Miyamoto D. T., Waltman B. A., and Floyd F. P., “Isolation of circulating tumor cells using a microvortex-generating herringbone-chip,” Proc. Natl. Acad. Sci. U.S.A. 107(43), 18392–18397 (2010). 10.1073/pnas.1012539107 [DOI] [PMC free article] [PubMed] [Google Scholar]
- 33.Sethu P., Anahtar M., Moldawer L. L., Tompkins R. G., and Toner M., “Continuous flow microfluidic device for rapid erythrocyte lysis,” Anal. Chem. 76(21), 6247–6253 (2004). 10.1021/ac049429p [DOI] [PubMed] [Google Scholar]
- 34.Crowley T. A. and Pizziconi V., “Isolation of plasma from whole blood using planar microfilters for lab-on-a-chip applications,” Lab Chip 5(9), 922–929 (2005). 10.1039/b502930a [DOI] [PubMed] [Google Scholar]
- 35.Choi J.-W. et al, “A micropillar array for sample concentration via in-plane evaporation,” Biomicrofluidics 8(4), 044108 (2014). 10.1063/1.4890943 [DOI] [PMC free article] [PubMed] [Google Scholar]
- 36.Corazza G. R., Ginaldi L., Zoli G., Frisoni M., Lalli G., Gasbarrini G., and Quaglino D., “Howell-Jolly body counting as a measure of splenic function. A reassessment,” Clin. Lab. Haematol. 12(3), 269–275 (1990). 10.1111/j.1365-2257.1990.tb00037.x [DOI] [PubMed] [Google Scholar]
- 37.Shapiro H. M., Schildkraut E. R., Curbelo R., Laird C. W., Turner B., and Hirschfeld T., “Combined blood cell counting and classification with fluorochrome stains and flow instrumentation,” J. Histochem. Cytochem. 24(1), 396–401 (1976). 10.1177/24.1.56391 [DOI] [PubMed] [Google Scholar]
- 38.Cheng X., Irimia D., Dixon M., Sekine K., Demirci U., Zamir L., and Toner M., “A microfluidic device for practical label-free CD4+ T cell counting of HIV-infected subjects,” Lab Chip 7(2), 170–178 (2007). 10.1039/B612966H [DOI] [PMC free article] [PubMed] [Google Scholar]
- 39.Ji H. M., Samper V., Chen Y., Heng C. K., Lim T. M., and Yobas L., “Silicon-based microfilters for whole blood cell separation,” Biomed. Microdevices 10(2), 251–257 (2008). 10.1007/s10544-007-9131-x [DOI] [PubMed] [Google Scholar]
- 40.William B., “Hemacytometer,” U.S. Patent No. 2,235,310 (1941).
- 41.Turner M. E., “The distribution of red blood cells in the hemacytometer,” Biometrics 13(4), 485–495 (1957). 10.2307/2527973 [DOI] [Google Scholar]
- 42.Chen J. et al. “A microfluidic chip for direct and rapid trapping of white blood cells from whole blood,” Biomicrofluidics 7(3), 034106 (2013); 10.1063/1.4808179 [DOI] [PMC free article] [PubMed] [Google Scholar]; Zhao Y. et al. “Microfluidic cytometers with integrated on-chip optical systems for red blood cell and platelet counting,” Biomicrofluidics 10(6), 064119 (2016). 10.1063/1.4972105 [DOI] [PMC free article] [PubMed] [Google Scholar]
- 43.Li X. et al. , “A microfluidic flow cytometer enabling absolute quantification of single-cell intracellular proteins,” Lab Chip 17(18), 3129–3137 (2017). 10.1039/C7LC00546F [DOI] [PubMed] [Google Scholar]
- 44.Thompson B. L. et al. , “Hematocrit analysis through the use of an inexpensive centrifugal polyester-toner device with finger-to-chip blood loading capability,” Anal. Chim. Acta 924, 1–8 (2016). 10.1016/j.aca.2016.04.028 [DOI] [PubMed] [Google Scholar]
- 45.Zhe J. et al. , “A micromachined high throughput coulter counter for bioparticle detection and counting,” J. Micromech. Microeng. 17(2), 304 (2007). 10.1088/0960-1317/17/2/017 [DOI] [Google Scholar]
- 46.Hassan U. et al. , “A microfluidic biochip for complete blood cell counts at the point-of-care,” Technology 3(04), 201–213 (2015). 10.1142/S2339547815500090 [DOI] [PMC free article] [PubMed] [Google Scholar]
- 47.Badders N. M., Yu H., Alexander C. M., and Beebe D. J., “Quantification of small cell numbers with a microchannel device,” Biotechniques 45(3), 321–325 (2008). 10.2144/000112906 [DOI] [PMC free article] [PubMed] [Google Scholar]
- 48.Browne A. W. et al. , “A lab-on-a-chip for rapid blood separation and quantification of hematocrit and serum analytes,” Lab Chip 11(14), 2440–2446 (2011). 10.1039/c1lc20144a [DOI] [PubMed] [Google Scholar]
- 49.Riegger L. et al. , “Single-step centrifugal hematocrit determination on a 10-$ processing device,” Biomed. Microdevices 9(6), 795–799 (2007). 10.1007/s10544-007-9091-1 [DOI] [PubMed] [Google Scholar]
- 50.Agarwal A. and Balyan P., “Design and fabrication of lab on chip for blood plasma and cell separation and blood cell counting,” Indian Patent 2592/DEL/2013, B01L (2016).
- 51.Li X. et al. , “Continuous-flow microfluidic blood cell sorting for unprocessed whole blood using surface-micromachined microfiltration membranes,” Lab Chip 14(14), 2565–2575 (2014). 10.1039/C4LC00350K [DOI] [PMC free article] [PubMed] [Google Scholar]
- 52.Chen X., Liu C. C., and Li H., “Microfluidic chip for blood cell separation and collection based on crossflow filtration,” Sens. Actuators B Chem 130(1), 216–221 (2008). 10.1016/j.snb.2007.07.126 [DOI] [Google Scholar]
- 53.Alvankarian J., Bahadorimehr A., and Majlis B. Y., “A pillar-based microfilter for isolation of white blood cells on elastomeric substrate,” Biomicrofluidics 7(1), 014102 (2013). 10.1063/1.4774068 [DOI] [PMC free article] [PubMed] [Google Scholar]
- 54.Yamada M. and Seki M., “Hydrodynamic filtration for on-chip particle concentration and classification utilizing microfluidics,” Lab Chip 5(11), 1233–1239 (2005). 10.1039/b509386d [DOI] [PubMed] [Google Scholar]
- 55.Torino S., Iodice M., Rendina I., Coppola G., and Schonbrun E., “Hydrodynamic self-focusing in a parallel microfluidic device through cross-filtration,” Biomicrofluidics 9(6), 064107 (2015). 10.1063/1.4936260 [DOI] [PMC free article] [PubMed] [Google Scholar]
- 56.Chiu Y. Y., Huang C. K., and Lu Y. W., “Enhancement of microfluidic particle separation using cross-flow filters with hydrodynamic focusing,” Biomicrofluidics 10(1), 011906 (2016). 10.1063/1.4939944 [DOI] [PMC free article] [PubMed] [Google Scholar]
- 57.Cheng Y., Ye X., Ma Z., Xie S., and Wang W., “High-throughput and clogging-free microfluidic filtration platform for on-chip cell separation from undiluted whole blood,” Biomicrofluidics 10(1), 014118 (2016). 10.1063/1.4941985 [DOI] [PMC free article] [PubMed] [Google Scholar]
- 58.Bilatto S. E., Adly N. Y., Correa D. S., Wolfrum B., Offenhäusser A., and Yakushenko A., “Printed microfluidic filter for heparinized blood,” Biomicrofluidics 11(3), 034101 (2017); 10.1063/1.4982963 [DOI] [PMC free article] [PubMed] [Google Scholar]; Wang C., Jalikop S. V., and Hilgenfeldt S., “Size-sensitive sorting of microparticles through control of flow geometry,” Appl. Phys. Lett. 99(3), 034101 (2011). 10.1063/1.3610940 [DOI] [Google Scholar]
- 59.Chun B. and Chun M.-S., “Effects of channel aspect ratio on microfluidic-chip design of hydrodynamic filtration for particle sorting,” J. Phys. D Appl. Phys. 52(22), 225301 (2019). 10.1088/1361-6463/ab0d78 [DOI] [Google Scholar]
- 60.Foley G., Membrane Filtration: A Problem Solving Approach with MATLAB (Cambridge University Press, 2013). [Google Scholar]
- 61.Dressaire E. and Sauret A., “Clogging of microfluidic systems,” Soft Matter 13(1), 37–48 (2017). 10.1039/C6SM01879C [DOI] [PubMed] [Google Scholar]
- 62.Sauret A. et al. , “Clogging by sieving in microchannels: Application to the detection of contaminants in colloidal suspensions,” Appl. Phys. Lett. 105(7), 074101 (2014). 10.1063/1.4893459 [DOI] [Google Scholar]
- 63.Wang Y.-Q. et al. , “Generation of anti-biofouling ultrafiltration membrane surface by blending novel branched amphiphilic polymers with polyethersulfone,” J. Membr. Sci. 286(1–2), 228–236 (2006). 10.1016/j.memsci.2006.09.040 [DOI] [Google Scholar]
- 64.Jaffrin M. Y., “Dynamic shear-enhanced membrane filtration: A review of rotating disks, rotating membranes and vibrating systems,” J. Membr. Sci. 324(1-2), 7–25 (2008). 10.1016/j.memsci.2008.06.050 [DOI] [Google Scholar]
- 65.Yoon Y. et al. , “Clogging-free microfluidics for continuous size-based separation of microparticles,” Sci. Rep. 6, 26531 (2016). 10.1038/srep26531 [DOI] [PMC free article] [PubMed] [Google Scholar]
- 66.Schneider C. A., Rasband W. S., and Eliceiri K. W., “NIH image to ImageJ: 25 years of image analysis,” Nat. Methods 9, 671–675 (2012). 10.1038/nmeth.2089 [DOI] [PMC free article] [PubMed] [Google Scholar]
- 67.Dolfus C., Piton N., Touré E., and Sabourin J., “Circulating tumor cell isolation: The assets of filtration methods with polycarbonate track-etched filters,” Chin. J. Cancer Res. 27, 479–487 (2015). 10.3978/j.issn.1000-9604.2015.09.01 [DOI] [PMC free article] [PubMed] [Google Scholar]
- 68.Seal S., “A sieve for the isolation of cancer cells and other large cells from the blood,” Cancer 17, 637–642 (1964). [DOI] [PubMed] [Google Scholar]
- 69.Kongruttanachok N. et al. , “Rapid separation of mononuclear hodgkin from multinuclear Reed-Sternberg cells,” Lab Hematol. 20(1), 2–6 (2014). 10.1532/LH96.12023 [DOI] [PubMed] [Google Scholar]
- 70.Ilié M. et al. , “Detection of PD-L1 in circulating tumor cells and white blood cells from patients with advanced non-small-cell lung cancer,” Ann. Oncol. 29(1), 193–199 (2018). 10.1093/annonc/mdx636 [DOI] [PubMed] [Google Scholar]
Associated Data
This section collects any data citations, data availability statements, or supplementary materials included in this article.
Supplementary Materials
See the supplementary material for additional supporting information on separation and flow parameters.


