

Abstract
Background and objective
The Sharpey’s fibers of periodontal ligament (PDL) anchor the PDL to alveolar bone and cementum and are essential for the function of PDL. While qualitative analyses of the Sharpey’s fibers have been widely explored, a comprehensive quantitative characterization of the Sharpey’s fibers is not available. In this work, we selected rat molars as a model and comprehensively characterized the PDL Sharpey’s fibers (diameter, density, length, embedding angle, and insertion angle).
Materials and methods
24 rat mandibular molars, 8 maxillary first molars, and their surrounding alveolar bone of were harvested, fixed, rendered anorganic and observed under scanning electron microscopy (SEM). The mandibles and maxillae (n=4) were harvested, processed, sectioned and stained with Sirius red for histological observation. SEM images were used for quantitative analyses of diameters and densities of the Sharpey’s fibers, while Sirius red staining images were used to measure lengths and angles. The Sharpey’s fibers were comprehensively characterized in terms of positions (cervical, middle, and apical thirds), PDL fiber groups (alveolar crest, horizontal, oblique, apical, and interradicular groups), sides (cementum and bone sides), and teeth (mandibular first, second, third molars, and maxillary first molar).
Results
Our results showed that the characteristic parameters of Sharpey’s fibers varied in different positions, fiber groups, sides and teeth. Specifically, the median diameter of the Sharpey’s fibers on the bone side was significantly greater than that on the cementum side, while the median density of the Sharpey’s fibers on the bone side was significantly lower than that on the cementum side, regardless of the positions and teeth. For the same tooth, the median length of the embedded Sharpey’s fibers on the bone side was more than two times greater than that on the cementum side. Among all fiber groups, the alveolar crest group had the maximum length of Sharpey’s fibers on the bone side and the minimal length of the Sharpey’s fibers on the cementum side. There is an approximate 5–15° difference between the embedding angle and the insertion angle in each group. The oblique group had the smallest embedding angles on both the bone and cementum sides.
Conclusion
This study provides a comprehensive and quantitative characterization of the Sharpey’s fibers using rat molars as a model. Overall, these parameters varied according to different vertical positions, fiber groups, teeth and jaw bones. The quantitative information of the Sharpey’s fibers presented in this work facilitates our understanding of PDL functions and advances the development of biomimetic materials for periodontal tissue regeneration.
Keywords: Periodontal ligament, Sharpey’s fibers, rat molars, quantitative characterization
1. Introduction
Periodontal ligament (PDL) is a special soft tissue situated between tooth roots and alveolar bone sockets. The PDL is anchored to root cementum and alveolar bone via Sharpey’s fibers that are part of the PDL collagen fiber bundles embedded in cementum and alveolar bone 1. Without the Sharpey’s fibers, there will be no effective connection between PDL and alveolar bone/cementum, and the integrity of the periodontal tissues will be impaired, leading to the loss of a tooth.
Because of the crucial role of Sharpey’s fibers in the function of a tooth, qualitative characterization of the structure of PDL Sharpey’s fibers had been explored since its discovery over 150 years ago2. As early as 1887, Sharpey’s fibers together with its principal fiber bundles were identified to be divided into alveolar crest group, horizontal group, oblique group, apical group, and interradicular group3. Later, four types of the Sharpey’s fibers (severed fibers, arborized fibers, adhesive fibers, and continuous fibers) were observed in the alveolar bone during the remodeling process4. The Sharpey’s fibers in primary acellular cementum were detected to be fully mineralized, while those in cellular cementum and alveolar bone were partially mineralized at their periphery5, 6. In addition, Sharpey’s fibers formation and mineralization patterns during tooth development were described using different animal models 7–11. A few non-collagenous matrix molecules located on Sharpey’s fibers and the surrounding cementum and alveolar bone were also characterized to identify their potential roles in regulating mineralization pattern of the Sharpey’s fibers 12, 13.
Compared to the qualitative characterization of the PDL Sharpey’s fibers, quantitative analysis of the Sharpey’s fibers (e.g. density, diameter, length, and embedding/insertion angles), however, is limited in literature. There was a report on the diameter and distribution of PDL Sharpey’s fibers in human root cementum in 1972 14. It was found that the Sharpey’s fibers had an average diameter of approximately 6 μm in cementum. A follow-up study showed that the average sizes of the Sharpey’s fiber bundles at the tooth root and the alveolar bone surfaces were similar 10. However, other important parameters (e.g. length and embedding and insertion angles) of the Sharpey’s fibers were not measured in those studies. The diameter and density of the Sharpey’s fibers of rat molars under non-, hypo-, and hyper-functional conditions were also examined 15, 16, and the results showed that the average diameter in the non-functional group was significantly greater than those in the hypo-and hyper-functional groups. Meanwhile, the density of the Sharpey’s fibers in the non-functional group was significantly lower than the other two groups. Similarly, that work did not report the length or embedding/insertion angles of the Sharpey’s fibers. In addition, none of those studies distinguished the variation of the Sharpey’s fibers at different tooth positions or at different teeth. To date, there is a lack of a comprehensive quantitative characterization of the PDL Sharpey’s fibers. Such a knowledge gap impedes the design and development of biomimetic materials for periodontal tissue regeneration.
In the present study, we chose rat molars as a model and performed a comprehensive quantitative characterization of the PDL Sharpey’s fibers, including diameter, density, length, embedding angle, and insertion angle. By combining histological staining, polarized light microscopy and scanning electron microscopy (SEM) analyses, we systematically characterized and compared these parameters in terms of positions (cervical third vs middle third vs apical third), PDL fiber groups (alveolar crest group vs horizontal group vs oblique group vs apical group vs interradicular group), sides (cementum side vs bone side), and teeth (first molar vs second molar vs third molar, and mandibular first molar vs maxillary first molar).
2. Materials and methods
2.1. Materials
Sodium hypochlorite solution (concentration: available chloride 10–15%, 425044), acetic acid (concentration≥99.7%, 320099), Direct red 80 (Sirius red, powder, dye content 25%, 365548), ferric chloride (powder, F-7134), picric acid solution (1.3% in H2O, saturated, P6744) and hematoxylin (powder, H9627) were purchased from Sigma-Aldrich (MO, USA). Ethylenediaminetetraacetic acid (powder, 99%, A10713) was obtained from Alfa Aesar (MA, USA). Paraffin (melting point 56–57°C, 22900700) was acquired from Fisher Scientific (PA,USA). Ethyl alcohol (absolute, anhydrous, 111000200) was purchased from Pharmco (USA), and hydrochloric acid (concentration 36.5–38%) was obtained from VWR Chemicals BDH (USA).
2.2. SEM observation of Sharpey’s fibers
Four Sprague Dawley rats (Charles River, 7–8 weeks) were sacrificed and the mandibles and maxillae were harvested. All animal protocols were approved by the University Committee on Use and Care of Animals of Texas A&M University College of Dentistry. A total of 24 mandibular molars (8 samples for each of the first, second, and third molars) and 8 maxillary first molars were distracted from the harvested mandibles and maxillae. Next, all the samples were fixed in 4% paraformaldehyde at 4°C for 48 hours. After that, the mandibles and maxillae were dissected using a low speed handpiece (Brasseler USA, UP500) to expose alveolar sockets. Bone segments and molars were rendered anorganic in 5% sodium hydrochloride at room temperature for 2 hours as reported previously 6, 14–17. Next, the bone segments and molars were placed in liquid nitrogen for 5 minutes and were freeze-dried for 24 hours. The samples were coated with gold in vacuum for 2 minutes and examined using SEM (JSM-6010LA, 15kV, SS35). Images were taken according to the vertical positions of roots and alveolar sockets (cervical third, middle third and apical third) for quantitative analysis.
2.3. Histological observation of Sharpey’s fibers
Sprague Dawley rats were sacrificed and the mandibles and maxillae (n=4) were harvested and fixed in 4% paraformaldehyde at 4°C for 48 hours. The samples were decalcified in 10% ethylenediaminetetraacetic acid (EDTA) solution, dehydrated in alcohol, and subsequently embedded in paraffin. The paraffin sections were cut at a thickness of 5 μm in three directions (mesio-distal, buccal-lingual, and coronal-apical) and mounted on slides for staining and subsequent analysis.
The agents for Sirius red staining were prepared according to a previous report18. The Sirius red solution was prepared by dissolving 0.5 g direct red 80 powder in 500 ml picric acid solution. The Weigart’s Hematoxylin is composed of solution A and solution B in a 1:1 ratio. Solution A was prepared by dissolving 1 g hematoxylin powder in 100 ml 95% alcohol. Solution B was prepared by adding 1.16 g ferric chloride powder and 1 ml hydrochloride solution to 99 ml deionized water. Sirius red staining was performed as previously reported 18. Briefly, sections were dewaxed, rehydrated, stained with Weigert’s hematoxylin for 10 minutes in a wet box, and washed with running tap water. The sections were stained in Sirius red solution for 1 hour, followed by being washed in 5% acetic acid (v/v) solution twice. After dried at 37°C, the samples were mounted and observed under bright and polarized light using a 10× lens. Images were taken for quantitative analysis using a 10× lens.
2.4. Quantitative analysis of Sharpey’s fibers
All quantitative analyses were performed using Image-Pro Plus 6.0 software. SEM images were used for quantitative analyses of the diameter and density of the Sharpey’s fibers. A total of 150 SEM images were taken for all the groups. The allocation of the SEM images is as following: 74 images for 8 mandibular first molars, 26 images for 8 mandibular second molars, 26 images for 8 mandibular third molars, and 24 images for 8 maxillary first molars. The images were taken to ensure 100 Sharpey’s fibers were selected in each group. After contouring the Sharpey’s fibers, the diameter of each Sharpey’s fiber bundle was directly measured from the SEM images. To calculate Sharpey’s fiber density, regions of interest (ROIs) in each image were selected. Next, the number of the fibers in each ROI and the area of each ROI were measured. The density of the Sharpey’s fibers was determined by number of fibers in the ROI/area of the ROI. Comparisons were made among different positions (cervical third, middle third, and apical third) of a tooth, different sides of a tooth (cementum side and alveolar bone side), and different types of teeth (first, second, third mandibular molars, and first maxillary molar).
Sirius red staining images were used for quantitative analyses of the length and angles of the Sharpey’s fibers. A total of 150 Sirius red images were taken for all the groups. The allocation of the images is as following: 78 images for 8 mandibular first molars, 24 images for 8 mandibular second, 24 images for 8 third molars, and 24 images for 8 maxillary first molars. The images were taken to ensure 100 Sharpey’s fibers were selected in each group. After loading the Sirius red staining image and setting scale bar using the Image-Pro Plus 6.0 software, the bone/PDL and cementum/PDL interfaces and the starting and ending points of each Sharpey’s fiber bundles were determined from the images. The bright light images were used to determine the bone/PDL and cementum/PDL interfaces, and the polarized light images were used to measure the length of the Sharpey’s fibers. The embedding angle of the Sharpey’s fibers was defined as the acute angle between the Sharpey’s fibers and the bone/PDL or cementum/PDL interfaces inside bone or cementum. The insertion angle was defined as the acute angle between the PDL fibers and the bone/PDL or cementum/PDL interfaces in PDL. The results were categorized according to PDL fiber groups: alveolar crest, horizontal, oblique, apical, and interradicular group. Comparisons were made among different fiber groups, sides, and teeth.
2.5. Sample size calculation
Minimum sample size was calculated using G Power software (version 3.1.9.4, Heinrich Heine University, Düsseldorf, Germany). 0.2 f‐type effect size level was set for diameter, length and angles under one-way ANOVA method, with a power of 90% and at two-sided α = 0.05 significance level. For density, 0.7 f‐type effect size level was set with a power of 90% and at two-sided α = 0.05 significance level. The effect size was decided according to previous papers 15, 16. About 40% more samples were added to each group to increase the credibility and stability of analysis. Thus, one hundred fibers in each group were chosen and analyzed for diameter, length and angles. Ten areas in each group were chosen to analyze density of Sharpey’s fibers in each group.
2.6. Statistical analysis
Skewness, kurtosis and histogram were conducted to test the normality of each group, and the results showed that the results were not normally distributed. Therefore, the median and interquartile range were used to describe the central and dispersion tendency of the results. Data were analyzed using SPSS 22.0 software. Kruskal-Wallis H test followed by Mann-Whitney U test of post hoc test was conducted to compare the differences among each group. A value of p<0.05 was considered as statistically significant for Kruskal-Wallis H test. The p value of post hoc Mann-Whitney U test was adjusted by p=0.05/ (number of comparisons) according to Bonferroni Correction method.
3. Results
3.1. SEM and Sirius red staining of Sharpey’s fibers
After rendering anorganic and freeze-drying the tooth sample, the ruptured Sharpey’s fiber bundles were distinguished from the surrounding area on the interface plane (arrows, Figure 1 A&D). The SEM cross-section image provided accurate information of the diameter and density of the Sharpey’s fibers. Meanwhile, Sirius red staining showed the insertion angles of the Sharpey’s fibers (Figure 1 B&E). The combination of the Sirius red staining with polarized light microscopy displayed the lengths and embedding angles of the Sharpey’s fibers (Figure 1 C&F). Therefore, SEM images of the Sharpey’s fibers were used to measure the diameters and densities, while Sirurs red staining images were selected to analyze the lengths, embedding angles and insertion angles. The morphology of the Sharpey’s fiber bundles are similar in different vertical positions, fiber groups and teeth (Supporting Information, Figures S1–S4).
Figure 1.
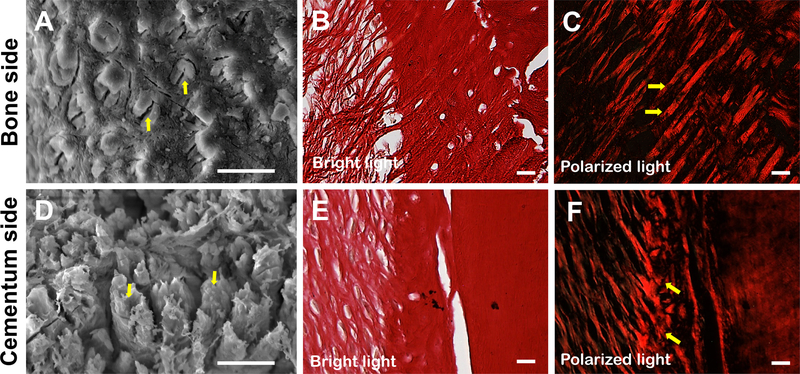
Characterization of Sharpey’s fibers. (A) SEM image of the alveolar bone surface in the middle third of a mandibular first molar. Scale bar =10 μm. (B) Sirius read staining of the section of the alveolar bone in oblique group from a mandibular first molar. Scale bar= 20 μm. (C) Polarized light image of (B). (D) SEM image of the cementum surface in the middle third of a mandibular first molar. Scale bar =10 μm. (E) Sirius read staining of the section of the cementum in oblique group from a mandibular first molar. Scale bar= 20 μm. (F) Polarized light image of (E)
3.2. Sharpey’s fibers in different positions and fiber groups
Mandibular first molars were first used to analyze the parameters of Sharpey’s fibers in terms of positions and fiber groups. As shown in Table 1, the median diameter of the Sharpey’s fibers on the bone side (6.3–6.4 μm) was significantly greater than that on the cementum side (5.0–5.4 μm), regardless of the vertical positions (cervical third, middle third, and apical third). On the same side, the median diameters of the Sharpey’s fibers were similar among the vertical positions. Meanwhile, the density of the Sharpey’s fibers on the bone side was significantly lower than that on the cementum side, regardless of the vertical positions. For example, the density of the Sharpey’s fibers in the apical third on the bone side (4732 fibers/mm2) was equivalent to 54.3% of that on the cementum side (8717 fibers/mm2). On the bone side, the density of the Sharpey’s fibers in the apical third (4732 fibers/mm2) was significantly lower than that in the cervical third (6977 fibers/mm2) and the middle third (7000 fibers/mm2). However, there was no significant difference in the density among different positions on the cementum side.
Table 1.
Diameters and densities of Sharpey’s fibers in different vertical positions of the mandibular first molar.
| Vertical | Diameter (μm) | Density (fibers/mm2) | ||
|---|---|---|---|---|
| positions | Bone side | Cementum side | Bone side | Cementum side |
| Cervical third | 6.4 (4.7, 8.9) | 5.0 (3.8, 7.2) * | 6977 (5526, 8526) * | 9654 (8785, 10431) |
| Middle third | 6.3 (4.8, 9.0) | 5.4 (4.3, 7.2) * | 7000 (6013, 7307) * | 8147 (7141, 8418) |
| Apical third | 6.3 (4.8, 7.9) | 5.4 (4.3, 8.1) * | 4732 (4056, 5289) #* | 8717 (7644, 10469) |
Results are expressed as median (interquartile range).
Diameter: *significantly different than that of the cervical third of bone side.
Density: * significantly different than that of the cervical third of cementum side, # significantly different than that of the cervical third of bone side.
p<0.005 according to Bonferroni Correction.
As shown in Table 2, the length of the Sharpey’s fibers embedded in the bone side was significantly greater than that in the cementum side, regardless of the PDL fiber groups. For example, the median length of the Sharpey’s fibers of the oblique group embedded in the bone side (132.8 μm) was three-fold greater than that in the cementum side (44.4 μm). Among all groups, the Sharpey’s fibers of the alveolar crest group had the maximum length on the bone side (199.8 μm) and the minimal length on the cementum side (9.3 μm). Of all the five fiber groups, the oblique group had the smallest embedding angles on both the bone and cementum sides. Moreover, the embedding angle of the alveolar crest group was significantly larger than those of the horizontal, oblique, and apical groups on both the bone and cementum sides. In terms of insertion angles, the oblique group had a median insertion angle of 51.1o on the bone side and 50.6o on the cementum side. The insertion angles of the other four groups ranged from 68.9o to 80.5o on the bone side and 69.4o to 75.6o on the cementum side. Overall, the oblique group had the lowest embedding and insertion angles among the five groups on both the bone and cementum sides.
Table 2.
Lengths, embedding and insertion angles of the Sharpey’s fibers in different fiber groups of mandibular first molar.
| Fiber groups | Length (μm) | Embedding angle (°) | Insertion angle (°) | |||
|---|---|---|---|---|---|---|
| Bone side | Cementum side | Bone side | Cementum side | Bone side | Cementum side | |
| Alveolar crest | 199.8 (144.6, 271.0) | 9.3 (7.3, 11.1) $ & @ #* | 74.3 (58.4, 82.5) * | 73.6 (66.2, 82.4) #* | 80.5 (71.6, 85.8) | 70.7 (64.3, 80.7) * |
| Horizontal | 88.6 (54.0, 211.0) #* | 11.3 (7.6, 19.1) & @ #* | 62.5 (45.7, 77.3) @ #* | 64.8 (55.9, 79.5) #* | 74.1 (67.3, 80.4) * | 75.6 (66.0, 81.3) |
| Oblique | 132.8 (68.4, 193.9) * | 44.4 (25.1, 91.6) @ #* | 57.6 (51.5, 63.8) & @ #* | 48.1 (41.6, 59.8) $&@# | 51.1 (43.7, 59.6) #* | 50.6 (44.9, 54.8) |
| Apical | 136.0 (79.5, 173.5) * | 85.1 (44.3, 118.1) #* | 70.6 (54.1, 81.9) * | 53.7 (44.3, 75.8) $& @ #* | 77.6 (65.9, 84.4) | 69.4 (57.9, 78.1) * |
| Interradicular | 118.7 (91.2, 149.8) * | 18.7 (14.4, 23.4) & @ #* | 78.3 (72.8, 83.5) | 63.3 (53.0, 76.8) #* | 68.9 (59.0, 79.0) * | 70.4 (59.9, 78.1) |
Results are expressed as median (interquartile range).
Length: * significantly different than bone side of alveolar crest group, # significantly different than bone side of apical group, @ significantly different than bone side of horizontal group, & significantly different than cementum side of oblique group, $ significantly different than cementum side of interraducular group.
Embedding angle: * significantly different than bone side of interradicular group, # significantly different than bone side of alveolar crest group, @ significantly different than cementum side of horizontal group, & significantly different than bone side of horizontal group, $ significantly different than bone side of oblique group.
Insertion angle: * significantly different than bone side of horizontal group, # significantly different than bone side of horizontal group. p<0.002 according to Bonferroni Correction.
3.3. Sharpey’s fibers in different molars
The diameters of the Sharpey’s fibers in different molars (mandibular first, second, and third molars and maxilla first molar) on the bone side (6.0–6.3 μm) were significantly greater than those on the cementum side (5.1–5.4 μm) (Table 3). While there was a trend that the median diameter of the Sharpey’s fibers decreased from the mandibular first molar to the second and third molars, there was no significant difference among these groups.
Table 3.
Diameters and densities of Sharpey’s fibers in the middle third of different molars.
| Molars | Diameter (μm) | Density (fibers/mm2) | |||
|---|---|---|---|---|---|
| Bone side | Cementum side | Bone side | Cementum side | ||
| Mandible | 1 | 6.3 (4.8, 9.0) | 5.4 (4.6, 7.5) * | 7000 (6613, 7307) * | 8147 (7141, 8418) |
| 2 | 6.1 (4.9, 9.0) | 5.1 (3.9, 6.9) * | 5281 (4636, 5495) #* | 8013 (7413, 8202) | |
| 3 | 6.0 (4.3, 8.6) | 5.1 (4.2, 8.2) * | 4852 (4407, 5703) #* | 5940 (5733, 6546) * | |
| Maxilla | 1 | 6.0 (4.5, 9.3) | 5.1 (3.8, 7.0) * | 6552 (5954, 6885) * | 8166 (7102, 9568) |
Results are expressed as median (interquartile range).
Diameter: * significantly different than bone side of first molar.
Density: * significantly different than cementum side of mandibular first molar, # significantly different than cementum side of first molar.
Mandibular molars are compared to each other, p<0.005 according to Bonferroni Correction.
Maxillary first molars are compared to mandibular first molars only. p<0.012 according to Bonferroni Correction.
For the same tooth, the density of the Sharpey’s fibers on the bone side was always significantly lower than that on the cementum side. When comparing the three mandibular molars, the density of the Sharpey’s fibers decreased from 7000 fibers/mm2 in the first molar to 4852 fibers/mm2 in the third molar on the bone side, and decreased from 8147 fibers/mm2 to 5940 fibers/mm2 on the cementum side. The diameter and density of the Sharpey’s fibers in the maxilla first molar were similar to those of the mandibular first molar.
For the same tooth, the median length of the embedded Sharpey’s fibers on the bone side was more than two times greater than that on the cementum side (Table 4). Similarly, the length of the Sharpey’s fibers in the maxilla first molar had no significant difference compared to that of the mandibular first molar. In addition, the embedding and insertion angles of the Sharpey’s fibers of the oblique group in different molars were all similar among the mandibular molars.
Table 4.
Length, embedding and insertion angles of the Sharpey’s fibers of the oblique group in different molars.
| Molars | Length (μm) | Embedding angle (°) | Insertion angle (°) | ||||
|---|---|---|---|---|---|---|---|
| Bone side | Cementum side | Bone side | Cementum side | Bone side | Cementum side | ||
| Mandible | 1 | 132.8 (68.4, 193.9) | 44.0 (25.1, 91.6) #* | 57.6 (51.5, 63.8) | 48.1 (41.6, 59.8) * | 51.1 (43.7, 59.6) | 50.6 (44.9, 54.8) |
| 2 | 112.3 (67.5, 179.7) * | 35.4 (19.0, 53.8) #* | 57.5 (52.0, 45.5) | 59.3 (51.8, 72.3) | 53.2 (46.8, 63.9) | 49.6 (41.9, 55.4) | |
| 3 | 104.9 (55.2, 171.7) * | 44.5 (30.5, 59.3) #* | 53.0 (73.9, 63.6) | 55.9 (42.4, 65.7) | 51.2 (44.9, 57.7) | 51.3 (42.7, 60.1) | |
| Maxilla | 1 | 124.4 (93.7, 169.2) | 34.1 (23.7, 60.8) #* | 58.1 (49.3, 64.2) | 71.9 (63.9, 79.5) #* | 55.7 (46.4, 63.9) * | 48.7 (40.7, 56.0) |
Results are expressed as median (interquartile range).
Length: * significantly different than bone side of first molar, # significantly different than bone side of second molar.
Embedding angle: * significantly different than cementum side of second molar.
Insertion angle: * significantly different than bone side of first molar.
Mandibular molars are compared to each other, p<0.005 according to Bonferroni Correction.
Maxillary first molars are compared to mandibular first molars only. p<0.012 according to Bonferroni Correction.
4. Discussion
This work provides a comprehensive quantitative characterization of the Sharpey’s fibers in terms of diameter, density, length, embedding angle, and insertion angle in different positions, fiber groups, sites, and teeth. We first used a surface erosion method 6 to distinguish the Sharpey’s fiber bundles from the surrounding matrices of bone and cementum. A freeze-drying treatment was used to prevent the shrinkage of the tooth sample, so that the diameter and density of the Sharpey’s fibers were intact after the treatment. One limitation of the SEM method is that it can only provide surface information, but not the information inside the sample. In other words, the SEM image cannot provide the information of the length, embedding and insertion angles of Sharpey’s fibers. That is likely the reason why previous studies in literature did not provide data of the length and angles of the Sharpey’s fibers. In this study, the teeth were embedded in paraffin, sectioned, and stained with Sirius red to show the length, embedding angle and insertion angle of Sharpey’s fibers. Sirius red is an elongated birefringent molecule. When Sirius red is bound to collagen, it orients parallel to the collagen fibrils, thereby greatly enhancing the birefringence of collagen 19, 20. Consequently, Sirius red-bound collagen fibers are bright and in sharp contrast with the rest of the tissues that remain dark or black under polarized light. As shown in Figures 1 (C–F), each bundle of the Sharpey’s fibers was clearly distinguished from the surrounding tissue. Therefore, the Sirius red-polarization detection method was used in this work to quantitatively characterize the length, embedding and insertion angles of Sharpey’s fibers.
For all the teeth, the median diameter of the Sharpey’s fibers on the bone side was always significantly higher than that on the cementum side, which was consistent with previous work10, 14–16. It is believed that periodontal ligament fibers split into fibrils and rearrange in the middle zone of periodontal ligament, which is necessary adaptation to drift, attrition and growth of teeth10, 21–23. The rearranged PDL fibers form thicker fiber bundles and attached to the surfaces of bone sockets, while in finer appearance to the cementum surface10, 21–23. The thicker fiber bundles are embedded in alveolar bone while the thinner fibers are in cementum to form Sharpey’s fibers, which explains the difference of their median diameter in bone side and cementum side.
Our result (approximately 6.3 μm on the bone side) is smaller than that from two previous studies that reported the mean diameter of the Sharpey’s fibers on the bone side was 9.8 μm and 11.4 μm, respectively [15, 16]. The discrepancy may be due to the different statistical methods adopted in the studies. In our study, the central tendency and dispersion tendency are described using median and interquartile range, respectively, while mean and standard deviation (SD) were used in their studies. Our statistical analysis shows that the diameter and other parameters of Sharpey’s fibers do not follow normal distribution. Therefore, the use of mean and SD is not the correct way to characterize Sharpey’s fibers.
Previous research provided the qualitative description that the Sharpey’s fibers were thicker but less on the bone side, while thinner and numerous on the cementum side 24. Our results also showed that the density of the Sharpey’s fibers on the bone side is significantly lower than that on the cementum side. The biochemical compositions of bone and cementum are similar, but the proportion of minerals in bone (50% to 60%) is slightly higher than that in cementum (45% to 50%) owing to the high osteogenic cell density in bone 1. Alveolar bone is composed of blood vessels, lymph vessels, nerves, and bone cells (osteoblasts, osteoclasts, osteocytes), while cementum is an avascular structure with limited cementum cells and nerve penetration. Therefore, the abundant components of bone provide fewer free spaces for Sharpey’s fibers than the alveolar bone, leading to the lower density of the Sharpey’s fibers on the bone side. Our quantitative analysis further shows that the density of the Sharpey’s fibers varied depending on vertical positions and the type of teeth. The density differences may due to the stress and strain distribution during occlusal load. The distribution of strain within PDL and alveolar bone during vertical load is higher in cervical area compared to apical area, and the higher density of Sharpey’s fibers in cervical third areas adapts to the higher strain of PDL and alveolar bone25, 26. Meanwhile, the distribution of stress within alveolar bone during vertical load is higher in apical area compared to cervical or apical area25, while our results showed lower density of apical Sharpey’s fibers on the bone side. There was a report that a high compression load resulted in the formation of fewer PDL collagen fibers and more blood vessels 27, which explains the lower density of Sharpey’s fibers in apical area on the bone side. When three mandibular molars were compared with each other, the first molar had the highest density of the Sharpey’s fibers while the third molar had the lowest density of the Sharpey’s fibers on both the bone side and the cementum side. It is believed that there is a positive correlation between the chewing force and the density of the Sharpey’s fibers 16. Our results suggest that a decreased magnitude of chewing force from the first molar to the third molar leads to the decreased densities of the Sharpey’s fibers.
Besides the diameter and density, the length, embedding and insertion angles are also indispensable parameters for a comprehensive characterization of the Sharpey’s fibers. However, such quantitative information has not been available in literature to date. The present work provides a comprehensive and quantitative description of these three parameters of the Sharpey’s fibers, which is essential for the development of biomimetic materials for periodontal regeneration. Our work shows that the median length of the Sharpey’s fibers on the bone surface was significantly greater than that on the cementum surface. During periodontal tissue development, alveolar bone and cementum gradually embed and partially mineralize the principal PDL fibers to form Sharpey’s fibers. Among the five groups, the alveolar crest, horizontal and interraducular groups have shorter Sharpey’s fibers on the cementum side, probably due to the thin acellular cementum in these areas. In contrast, the apical group and part of the oblique group are located on cellular cementum area that allows embedding longer Sharpey’s fibers. When comparing the oblique group in different teeth, first molar had significantly longer Sharpey’s fibers on the bone side compared to second and third molars. The high occlusion force and large size of the first molar are believed to contribute to the increase of the Sharpey’s fiber length in the first molar28.
We found the direction of the Sharpey’s fibers embedded inside the alveolar bone/cementum is not parallel to the PDL primary fibers attached to the PDL-alveolar or PDL-cementum interfaces. Therefore, we introduce the embedding angle and insertion angle to characterize the Sharpey’s fibers. Our measurements show that there is a 5–15° difference between these two angles in each group. The differences of these two angles also forms a stronger anchorage between PDL and alveolar bone/cementum. Our results shows that in both bone side and cementum side, the median embedding angle and insertion angle are less than 90°, which means they are not perpendicular to the root or bone surface (Table 3 and 4). If the embedding angle and insertion angle are perpendicular to the surface, there would be no resultant force applied to bone or cementum surface10. The oblique embedding angle and insertion angles of Sharpey’s fibers help the transmission of occlusal force from a tooth to the surrounding alveolar bone29.
Conclusion
This study provides a comprehensive and quantitative characterization of the Sharpey’s fibers using rat molars as a model. An initial statistical analysis shows that none of the five parameters (diameter, density, length, embedding angle, and insertion angle) of the Sharpey’s fibers followed normal distribution. Overall, these parameters varied according to different vertical positions, fiber groups, teeth and jaw bones. Specifically, the median diameter of the Sharpey’s fibers on the bone side was significantly greater than that on the cementum side, while the density of the Sharpey’s fibers on the bone side was significantly lower than that on the cementum side. Meanwhile, the length of the Sharpey’s fibers embedded in the bone side was significantly greater than that in the cementum side. Of all the five fiber groups, the oblique group had the smallest embedding angles on both the bone and cementum sides. These anatomical parameters of the Sharpey’s fibers advance our understanding of the functions of periodontal tissues.
Supplementary Material
Figure S1. SEM images of the Sharpey’s fibers in cervical third and apical third of a mandibular first molar.
Figure S2. SEM images of the Sharpey’s fibers in the middle third of different molars.
Figure S3. Sirius red staining images of the Sharpey’s fibers in different PDL fiber groups of a mandibular first molar.
Figure S4. Sirius red staining images of the Sharpey’s fibers in the oblique group of different molars.
Acknowledgement
This work was supported by NIH/NIDCR (DE024979).
Footnotes
Conflict of Interest
The authors declare no conflict of interests.
References
- 1.Nanci A. Ten Cate’s Oral Histology: Development, Structure, and Function: Elsevier; 2013. [Google Scholar]
- 2.Quain J, Cleland JG, Sharpey W, Thomson A. Quain’s elements of anatomy. In. vol. 1. London: :: James Walton, 1867:300–343. [Google Scholar]
- 3.Black GV. A Study of the Histological Characters of the Periosteum and Peridental Membrane: BiblioBazaar; 2016. [Google Scholar]
- 4.Johnson RB. A classification of Sharpey’s fibers within the alveolar bone of the mouse: a high-voltage electron microscope study. Anat Rec 1987;217:339–347. [DOI] [PubMed] [Google Scholar]
- 5.Selvig KA. The fine structure of human cementum. Acta Odontol Scand 1965;23:423–441. [DOI] [PubMed] [Google Scholar]
- 6.Boyde A, Jones SJ. Scanning electron microscopy of cementum and Sharpey fibre bone. Zeitschrift fur Zellforschung und mikroskopische Anatomie (Vienna, Austria : 1948) 1968;92:536–548. [DOI] [PubMed] [Google Scholar]
- 7.Bosshardt DD, Schroeder HE. Cementogenesis reviewed: a comparison between human premolars and rodent molars. Anat Rec 1996;245:267–292. [DOI] [PubMed] [Google Scholar]
- 8.Birk DE, Zycband E. Assembly of the tendon extracellular matrix during development. J Anat 1994;184 ( Pt 3):457–463. [PMC free article] [PubMed] [Google Scholar]
- 9.Johnson R, Martinez R. Synthesis of Sharpey’s fiber proteins within rodent alveolar bone. Scanning Microscopy 1998;12:317–327. [Google Scholar]
- 10.Jones SJ, Boyde A. The organization and gross mineralization patterns of the collagen fibres in Sharpey fibre bone. Cell and tissue research 1974;148:83–96. [DOI] [PubMed] [Google Scholar]
- 11.Johnson RB. Synthesis of alveolar bone Sharpey’s fibers during experimental tooth movement in the rat. The anatomical record Part A, Discoveries in molecular, cellular, and evolutionary biology 2005;284:485–490. [DOI] [PubMed] [Google Scholar]
- 12.Sawada T, Ishikawa T, Shintani S, Yanagisawa T. Ultrastructural immunolocalization of dentin matrix protein 1 on Sharpey’s fibers in monkey tooth cementum. Biotechnic & histochemistry : official publication of the Biological Stain Commission 2012;87:360–365. [DOI] [PubMed] [Google Scholar]
- 13.Arambawatta AK, Yamamoto T, Wakita M. Immunohistochemical characterization of noncollagenous matrix molecules on the alveolar bone surface at the initial principal fiber attachment in rat molars. Ann Anat 2005;187:77–87. [DOI] [PubMed] [Google Scholar]
- 14.Jones SJ, Boyde A. A study of human root cementum surfaces as prepared for and examined in the scanning electron microscope. Zeitschrift fur Zellforschung und mikroskopische Anatomie (Vienna, Austria : 1948) 1972;130:318–337. [DOI] [PubMed] [Google Scholar]
- 15.Martinez RH, Johnson RB. Effects of orthodontic forces on the morphology and diameter of Sharpey fibers of the alveolar bone of the rat. Anat Rec 1987;219:10–20. [DOI] [PubMed] [Google Scholar]
- 16.Short E, Johnson RB. Effects of tooth function on adjacent alveolar bone and Sharpey’s fibers of the rat periodontium. Anat Rec 1990;227:391–396. [DOI] [PubMed] [Google Scholar]
- 17.Silva MA, Merzel J. Alveolar bone Sharpey fibers of the rat incisor in normal and altered functional conditions examined by scanning electron microscopy. The anatomical record Part A, Discoveries in molecular, cellular, and evolutionary biology 2004;279:792–797. [DOI] [PubMed] [Google Scholar]
- 18.Rittié L. Method for Picrosirius Red-Polarization Detection of Collagen Fibers in Tissue Sections In: Rittié L, ed. Fibrosis: Methods and Protocols. New York, NY: Springer New York, 2017:395–407. [DOI] [PubMed] [Google Scholar]
- 19.Junquiera LC, Junqueira LC, Brentani RR. A simple and sensitive method for the quantitative estimation of collagen. Analytical biochemistry 1979;94:96–99. [DOI] [PubMed] [Google Scholar]
- 20.Modis L. Organization of the Extracellular Matrix: a Polarization Microscopic Approach; 2018. [Google Scholar]
- 21.Trapani AP. A Morphologic Comparison of the Periodontal Ligament of Normal Versus Accelerated Erupting Teeth in Rats and Guinea Pigs. Chicago: Loyola University Chicago; 1971. 67 p. [Google Scholar]
- 22.Cohn SA. A re-examination of Sharpey’s fibres in alveolar bone of the mouse. Arch Oral Biol 1972;17:255–260. [DOI] [PubMed] [Google Scholar]
- 23.Zwarych PD, Quigley MB. THE INTERMEDIATE PLEXUS OF THE PERIODONTAL LIGAMENT: HISTORY AND FURTHER OBSERVATIONS. J Dent Res 1965;44:383–391. [DOI] [PubMed] [Google Scholar]
- 24.de Jong T, Bakker AD, Everts V, Smit TH. The intricate anatomy of the periodontal ligament and its development: Lessons for periodontal regeneration. J Periodontal Res 2017;52:965–974. [DOI] [PubMed] [Google Scholar]
- 25.Merdji A, Mootanah R, Bachir Bouiadjra BA, et al. Stress analysis in single molar tooth. Mater Sci Eng C Mater Biol Appl 2013;33:691–698. [DOI] [PubMed] [Google Scholar]
- 26.McCormack SW, Witzel U, Watson PJ, Fagan MJ, Groning F. The biomechanical function of periodontal ligament fibres in orthodontic tooth movement. PLoS One 2014;9:e102387. [DOI] [PMC free article] [PubMed] [Google Scholar]
- 27.Naveh GRS, Foster JE, Silva Santisteban TM, Yang X, Olsen BR. Nonuniformity in ligaments is a structural strategy for optimizing functionality. Proceedings of the National Academy of Sciences 2018;115:9008–9013. [DOI] [PMC free article] [PubMed] [Google Scholar]
- 28.Hunt HR, Rosen S, Hoppert CA. Morphology of molar teeth and occlusion in young rats. J Dent Res 1970;49:508–514. [DOI] [PubMed] [Google Scholar]
- 29.Atmaram GH, Mohammed H. Estimation of Physiologic Stresses with a Natural Tooth Considering Fibrous PDL Structure. Journal of Dental Research 1981;60:873–877. [DOI] [PubMed] [Google Scholar]
Associated Data
This section collects any data citations, data availability statements, or supplementary materials included in this article.
Supplementary Materials
Figure S1. SEM images of the Sharpey’s fibers in cervical third and apical third of a mandibular first molar.
Figure S2. SEM images of the Sharpey’s fibers in the middle third of different molars.
Figure S3. Sirius red staining images of the Sharpey’s fibers in different PDL fiber groups of a mandibular first molar.
Figure S4. Sirius red staining images of the Sharpey’s fibers in the oblique group of different molars.