

Abstract
Despite the common co-occurrence of cognitive impairment and brain structural deficits in alcoholism, demonstration of relations between regional gray matter volumes and cognitive and motor processes have been relatively elusive. In pursuit of identifying brain structural substrates of impairment in alcoholism, we assessed executive functions (EF), episodic memory (MEM), and static postural balance (BAL) and measured regional brain gray matter volumes of cortical, subcortical, and cerebellar structures commonly affected in individuals with alcohol dependence (ALC) compared with healthy controls (CTRL). ALC scored lower than CTRL on all composite scores (EF, MEM, and BAL) and had smaller frontal, cingulate, insular, parietal, and hippocampal volumes. Within the ALC group, poorer EF scores correlated with smaller frontal and temporal volumes; MEM scores correlated with frontal volume; and BAL scores correlated with frontal, caudate, and pontine volumes. Exploratory analyses investigating relations between subregional frontal volumes and composite scores in ALC yielded different patterns of associations, suggesting that different neural substrates underlie these functional deficits. Of note, orbitofrontal volume was a significant predictor of memory scores, accounting for almost 15% of the variance; however, this relation was evident only in ALC with a history of a non-alcohol substance diagnosis and not in ALC without a non-alcohol substance diagnosis. The brain-behavior relations observed provide evidence that the cognitive and motor deficits in alcoholism are likely a result of different neural systems and support the hypotheses that a number of identifiable neural systems rather than a common or diffuse neural pathway underlies cognitive and motor deficits observed in chronic alcoholism.
Keywords: frontal lobes, alcoholism, memory, executive functions, balance
INTRODUCTION
Chronic heavy drinking is associated with cognitive and motor deficits, including compromised executive functions, memory processes, and balance and gait (for reviews see Fama and Sullivan 2014; Le Berre et al. 2019; Oscar-Berman et al. 2014). The pattern and extent of these impairments can differ significantly among chronic heavy drinkers, and not all chronic heavy drinkers show cognitive or motor deficits (Fama et al. 2017; Pitel et al. 2011; Smith and Fein 2010). Alcoholism is a dynamic disease with periods of active drinking and abstinence and associated with an increased incidence of comorbid diagnoses including drug use that can contribute to the heterogeneity observed in functional deficits.
The constellation of brain volume deficits associated with alcoholism and commonly identified with pathology (Courville 1955; Harper and Kril 1990) and imaging (Cardenas et al. 2007; Makris et al. 2008) include cerebral cortex - notably frontal lobes (Dupuy and Chanraud 2016; Grodin et al. 2013; Jernigan 1990; Sullivan et al. 2018), subcortical tissue - notably limbic (Le Berre et al. 2014; Pfefferbaum et al. 2018; Pitel et al. 2013) and basal ganglia (Ritz et al. 2014), and cerebellum (Sawyer et al. 2016; Sullivan et al. 2000a; Sullivan et al. 2006), notably the anterior superior vermis. Recently, a model was proposed delineating three independent yet highly interconnected frontally-based neural systems affected in chronic alcoholism - frontostriatal, frontolimbic, and frontocerebellar - that extend to subcortical and cerebellar structures and are associated with alcoholism-related cognitive and motor deficits (Sullivan and Pfefferbaum 2005; Zahr et al. 2017).
Two imaging studies lent further evidence of frontal lobe involvement in alcoholism. A positron emission tomography (PET) study provided a direct voxel-by-voxel comparison between the degrees of structural and metabolic abnormalities in 17 alcoholics and identified gray matter shrinkage in nodes of the frontostriatal, frontocerebellar, and frontolimbic circuits, including frontal and cerebellar cortices, cingulate gyrus, thalamus, and hippocampus (Ritz et al. 2016). A longitudinal structural MRI study on 222 individuals with alcohol dependence reported frontal regional volumes that were most extensively affected, including the precentral, supplementary motor, and medial cortices (Sullivan et al. 2018). Further, that study observed age-alcoholism interactions for total frontal cortical volume and regionally for precentral and superior frontal cortices.
Despite the common co-occurrence of cognitive impairment and brain structural deficits in alcoholism, demonstration of relations between structural regional gray matter volumes and cognitive and motor processes have been less than forthcoming. Chanraud and colleagues reported relations between tests of working memory, fluency, sequencing, and inhibitory control and frontal, temporal, insular, hippocampal, thalamic, and cerebellar gray matter volumes (Chanraud et al. 2007). Based on these relations, they proposed a cortical-thalamo-cerebellar model of executive dysfunction in alcoholism. Another structural MRI study reported that lower executive function scores, assessed with tasks of conceptualization, mental flexibility, motor programming, and interference sensitivity, were related to smaller left rostral middle frontal volume and smaller left cerebellar cortical volume (Nakamura-Palacios et al. 2014). Taken together, these studies provide evidence of frontal lobe system involvement in relation to the functional deficits often observed in chronic heavy drinkers.
In pursuit of brain structural substrates of impairment, we assessed executive functions, episodic memory, and balance and measured cortical gray matter, subcortical, and cerebellar volumes, regions commonly affected in individuals with alcohol dependence compared with healthy controls. We tested the hypotheses that scores on tests of cognitive and motor functions would be related to selective regional brain volumes, in particular frontal volumes. A second hypothesis predicted that a pattern of different relations would be evident among regional nonfrontal volumes, with executive functions related to caudate volume, memory processes related to hippocampal and thalamic volumes, and balance ability related to pontine and cerebellar volumes. Lastly, we tested the hypothesis that older age and greater lifetime alcohol consumption in the alcoholics would be related to poorer executive functions, memory processes, and balance abilities.
MATERIAL AND METHODS
Participants
Study participants included 94 individuals with alcohol dependence (ALC; 73 men and 21 women), recruited from local substance abuse treatment programs, sobriety support groups, and word of mouth, and 37 normal comparison participants (CTRL; 21 men, 16 women), recruited from the local community. These participants were a subset of those with MRI (Sullivan et al. 2018) drawn from a study published by our laboratory that examined the neurological and nutritional factors associated with cognitive and motor deficits in alcoholism (Fama et al. 2019; Pitel et al. 2011).
All participants were screened by calibrated research clinicians using the Structured Clinical Interview for DSM-IV (SCID) (First et al. 1998) and completed health questionnaires. All 94 alcoholics met DSM-IV-TR criteria for alcohol dependence. Alcoholic and control participants were excluded at screening if they had fewer than 8 years of education or a significant history of medical (e.g., epilepsy, stroke, multiple sclerosis, uncontrolled diabetes, or loss of consciousness > 30 minutes), psychiatric (i.e., schizophrenia or bipolar I disorder) or neurological disorder (e.g., neurodegenerative disease). An additional exclusion criterion was any DSM-IV-TR Axis I disorder in the CTRL group. All participants underwent a semi-structured timeline follow-back interview (Skinner 1982; Skinner and Sheu 1982) to quantify lifetime alcohol consumption. Severity of depressive symptoms was assessed with the Beck Depression Inventory-II (Beck et al. 1996) in all participants. This research protocol was approved by the Institutional Review Boards of Stanford University and SRI International. Written informed consent was obtained from all participants, none of whom was clinically demented or conserved.
The average age of onset of alcohol dependence was 24.2±8.7 years (range=12 to 48 years), and the average length of alcohol dependence was 23.8±11.5 years (range=3 to 51 years). Alcoholics drank an average of 1357±1017 kg of alcohol over their lifetime (range=178 to 4783 kg; median=1051 kg), whereas controls drank significantly less over their lifetime, on average 26±34 kg alcohol (range=0 to 136 kg; median=11 kg). Duration of abstinence for alcoholics was 16 weeks (sd=16 weeks, range=1 to 107 weeks, median=12 weeks). Time since last met an alcohol diagnosis was on average 27 weeks (sd=41 weeks, range =0 to 286 weeks, median=14 weeks). No alcoholic participant had ever been diagnosed with Wernicke’s encephalopathy or met criteria for alcohol-induced persisting amnestic disorder.
Regarding DSM-IV-TR alcohol dependence remission criteria at the time of visit, 12 of 94 (12.7%) were in sustained remission, 74 of 94 (78.7%) were in early remission, and 8 of 94 (8%) had current alcohol dependence. Of the 94 alcoholics, 36 (38%) met lifetime DSM-IV-TR criteria for cannabis abuse or dependence and 52 (55%) met DSM-IV-TR criteria for abuse/dependence on other drugs including: 45 participants (48%) for cocaine, 17 (18%) for amphetamine, 14 (15%) for opioid, 6 (6%) for hallucinogen, 5 (5%) for sedative, and 2 (2%) for other. For those alcoholics with a history of substance abuse or dependence all were in remission (at least one month) with the exception of one participant who met criteria for current cannabis dependence. For those in remission, median time since last met criteria for substance abuse or dependence was 286 weeks (range from 6 to 1784 weeks). No control participant met DSM-IV-TR criteria for substance abuse or dependence. For nicotine, 47 (50%) of the 94 ALC participants were current smokers and 18 (19%) were past smokers, whereas 2 of 37 (5%) controls were current smokers and 1 (3%) was a past smoker.
Demographics for the ALC and CTRL groups are presented in Table 1. The ALC and CTRL groups did not differ in age, but the ALC group had on average fewer years of formal education than the CTRL group. National Adult Reading Test (NART) scores (Nelson 1982) were available for a subset of participants and showed a modestly lower estimated premorbid IQ for the ALC group than the CTRL group. As expected, the ALC group had greater lifetime alcohol consumption than the CTRL group. The ALC group endorsed more depressive symptoms (Beck et al. 1996) and scored lower on a general cognitive screening test (Mattis 2004) than the CTRL group.
Table 1:
Demographic characteristics of participants (mean, standard deviation, range)
| Group | Age (yrs) | Education (yrs) | NART IQ† | BDI-II ⌑ | Dementia Rating Scale | Lifetime Alc Consumption (kg) | Age of Alc Dep Onset | Weeks since last met Alc Dep Dx |
|---|---|---|---|---|---|---|---|---|
| Alcoholic (ALC n=94) | 48.5 (10.4) 25 to 69 |
12.9 (2.3) 9 to 21 |
106.6 (9.0) 91 to 124 |
9.8 (6.9) 0 to 38 |
135.9 (5.1) 121 to 144 |
1336.5 (1008.9) 176 to 4711 |
24.1 8.7 12 to 48 |
27.1 41.2 0 to 286 |
| Control (CTRL n=37) | 47.5 (12.8) 25 to 73 |
15.6 (2.6) 11 to 21 |
110.7 (9.5) 92 to 126 |
3.1 (3.9) 0 to 16 |
139.1 (2.7) 130 to 144 |
24.2 (33.7) 0 to 136 |
NA | NA |
| Group differences (t-test) 95% CI | p=.65 [−3.3, 5.3] |
p<.0001 [−3.5,−1.7] |
p=.08 [−8.6, 0.5] |
p<.0001 [4.3, 9.1] |
p<.0001 [−4.9, −1.4] |
p<.0001 [992.2, 1654.1] |
||
NART - National Adult Reading Test - estimated IQ; ALC n=44, NC n=26
BDI-II - Beck Depression Inventory-II
NA - not applicble
Neuropsychological Test Measures
Three functional domains were assessed: Executive Functions, Episodic Memory, and Static Balance.
Executive Functions
The Trail Making Test – Part B (Reitan 1958)
Participants attempted to connect circles in order of alternating number and letter sequence (i.e., 1-A-2-B-3-C …) as quickly as possible. Score was time to complete test.
Controlled Oral Word Association Test (COWAT) (Borkowski et al. 1967)
Participants were given 60-sec to generate as many words as possible that began with the letter F, then A, and then S. Score was the total number of correct words produced across the three conditions.
Ruff Figural Fluency Test (RFFT) (Ruff 1988)
The RFFT, considered a visual analog of the COWAT, required participants to generate as many different designs as possible using straight lines to connect at least 2 of the 5 dots in each of five arrays. The test consists of five conditions, some with distractors, each with a 1-min time limit. The total number of correct unique designs was summed across all five conditions.
Episodic Memory
Wechsler Memory Scale- Revised: Logical Memory (WMS-R) (Wechsler 1987)
Participants recalled the details of two short narratives two times, once immediately after each story was read to them by the examiner and then again after a 30-min delay. Score for both immediate and delayed conditions was the number of details recalled from both stories (max=50 for each condition).
Rey-Osterrieth Complex Figure – Immediate and Delayed Recall (Rey 1942)
Participants drew a complex figure from memory immediately after having copied it and then again after a 30-min delay. The number of details recalled (max=36), according to standardized scoring instructions, was calculated for each recall condition.
Static Balance
Modified Fregly-Greybiel Test of Ataxia (Fregly 1968; Fregly et al. 1972)
Participants balanced on one leg at a time, first right and then left, initially with their eyes open and then with their eyes closed. Thus, the four conditions consist of (1) balance on right leg with eyes open; (2) balance on left leg with eyes open; (3) balance on right leg with eyes closed; and (4) balance on left leg with eyes closed. Two 30-sec trials for each condition were administered. If the participant performed the first trial of a condition for the maximum time allowed (30-sec), the second trial of that condition was not given and maximum score (30-sec) was recorded. The dependent measure was the average age- and education-standardized score for all four conditions based on the control group.
MRI Acquisition and Analysis
Image Acquisition
MRI data were acquired on 3 Tesla GE whole body MR systems (General Electric Healthcare, Waukesha, WI) using an 8-channel phased-array head coil. T1-weighted Inversion-Recovery Prepared SPGR images (TR=6.55/5.92 ms, TE=1.56/1.93 ms, TI=300/300 ms, matrix = 256x256, thick=1.25 mm, skip=0 mm, 124 slices) based on an axial structural sequence was used for volumetric analysis. Drift was corrected by adjusting scanner calibration parameters when necessary to maintain spatial stability within manufacturer guidelines, and routine phantom data were used to evaluate spatial fidelity.
Image Processing
Preprocessing of the T1-weighted MRI data (124 slices, matrix=256x256, thickness=1.25mm, skip=0) involved noise removal (Coupe et al. 2008), correcting field inhomogeneity via N4ITK (Tustison et al. 2011), and segmenting the brain mask by majority voting (Rohlfing et al. 2004). The voting was performed with respect to the maps generated by separately applying FSL BET (Smith 2002), AFNI 3dSkullStrip (Cox 1996), FreeSurfer mri_gcut (Sadananthan et al. 2010), and the Robust Brain Extraction (ROBEX) method (Iglesias et al. 2011) to the bias and non-bias corrected T1-weighted MRIs.
Brain tissue segmentation (gray matter, white matter, and cerebrospinal fluid) of the skull-stripped T1-weighted MRI was generated via Atropos (Avants et al. 2011). The label map was further parcellated into the regions defined by the SRI24 atlas (Rohlfing et al. 2010) by non-rigidly registering the atlas to the MRI via ANTS (Avants et al. 2008). Gray matter was parcellated into six lobar regions: frontal, temporal, parietal, occipital, cingulate, and insular cortices (Figure 1). Automatic labeling was always visually inspected for accuracy by a trained research scientist. Based on our hypotheses we also measured subcortical and cerebellar regions including the caudate, pons, hippocampus, thalamus, and superior cerebellum.
Figure 1:

Color-coded atlas identifying the gray matter regional volumes.
Statistical analyses
Test scores were statistically corrected for age and education and standardized on the control group [mean and standard deviation for CTRL group: Z=0±1], allowing direct comparison of tests across groups. Where higher raw scores indicated worse performance (e.g., time to complete a test), scores were multiplied by −1, so that lower Z-scores always indicated worse performance. For data reduction and to minimize Type I error, theoretically-derived composite scores were calculated comprising each of the 3 functional domains: Executive Functions (EF), Episodic Memory (MEM), and Static Balance (BAL). Composite Z-scores were computed by averaging the Z-scores across all measures included in that composite. The Shapiro-Wilk Test was used to examine for heteroscedasticity for all composite scores and brain measure volumes.
Group differences on the composite scores were assessed with t-tests. Cohen’s effect size was also reported for significant group differences. Correlational analyses (Pearson product-moment) tested relations between composite scores and brain volumes and relations among these measures and alcohol or demographic variables within the ALC group. When data distribution was skewed or when groups had noticeably different sample sizes non-parametric statistics were used. Power analyses were conducted and given the number of subjects included in this study a correlation coefficient above .30 was determined to reflect cases in which there was an 80% chance that the null hypothesis was accurately rejected. Use of False Discovery Rates (FDR: based on 3 comparisons across the cognitive and motor domains; p≤.0167/.033/.05) reduced the risk of reporting false positive results (Benjamini and Hochberg 1995). All probabilities values are reported as two-tailed with the exception of the correlational analyses examining the relations between the composite scores and the lobular and associated regional brain volume measures based on a priori hypotheses (i.e., frontal, temporal, parietal, occipital, cingulate, insular, caudate, pons, hippocampus, thalamus, and superior cerebellum), where greater volumes were predicted to correlate with better performance scores. Multiple regression analyses were conducted to determine the independence of factors that demonstrated first order relationships with the dependent variables; Cook’s distance was calculated to assess the level of influence of each participant’s score such that no one score carried the analysis (Di value <0.5).
RESULTS
Raw scores for all test measures included in the composite scores are in Table 2.
Table 2.
Raw Scores for Cognitive and Motor Test: ALC and CTRL (mean, sd, range)
| ALC | CTRL | |
|---|---|---|
| Executive Functions | ||
| Trails B number of second to complete | 95.54 (56.46) 31 to 316 |
65.08 (21.95) 29 to 118 |
| Controlled Oral Word Association Test total words produced | 39.72 (13.03) 15 to 78 |
47.69 (12.45) 12 to 69 |
| Ruff Figural Fluency Test number of unique designs | 62.97 (23.07) 19 to 126 |
78.05 (19.58) 31 to 118 |
| Episodic Memory | ||
| Logical Memory I - WMS-R immediate memory (max=50) | 20.60 (8.57) 2 to 37 |
26.65 (7.24) 8 to 39 |
| Logical Memory II - WMS-R delayed memory (max=50) | 16.07 (8.70) 1 to 35 |
22.60 (6.97) 5 to 34 |
| Rey-Osterrieth Complex Figure immediate recall (max=36) | 10.74 (5.32) 0 to 29 |
14.89 (5.61) 4.5 to 26.5 |
| Rey-Osterrieth Complex Figure delayed recall (max=36) | 11.13 (4.90) 2.5 to 23.5 |
14.11 (5.80) 5 to 24.5 |
| Balance Test | ||
| Eyes Open - Right Leg (max=60sec) | 38.10 (22.83) 0 to 60 |
53.70 (12.60) 17 to 60 |
| Eyes Open - Left Leg (max=60sec) | 37.53 (21.47) 0 to 60 |
53.38 (14.66) 10 to 60 |
| Eyes Closed - Right Leg (max=60sec) | 11.47 (12.40) 0 to 60 |
19.68 (18.62) 0 to 60 |
| Eyes Closed - Left Leg (max=60sec) | 11.99 (12.23) 0 to 60 |
20.73 (19.12) 0 to 60 |
WMS-R: Wechsler Memory Scale-Revised
Heteroscedasticity was detected in the EF and MEM composite Z-scores and indicated that 3 EF scores and 1 MEM score were outliers. These cases were omitted from subsequent analyses examining EF and MEM composite scores.
Cognitive and Motor Composite Scores
ALC scored lower than CTRL on all three composite scores [EF t(120)=2.83, p=.006, Cohen’s d=.52; MEM t(125)=4.50, p<.0001, Cohen’s d=.81; BAL t(123)=2.87, p=.0025, Cohen’s d=.52] (Figure 2).
Figure 2:
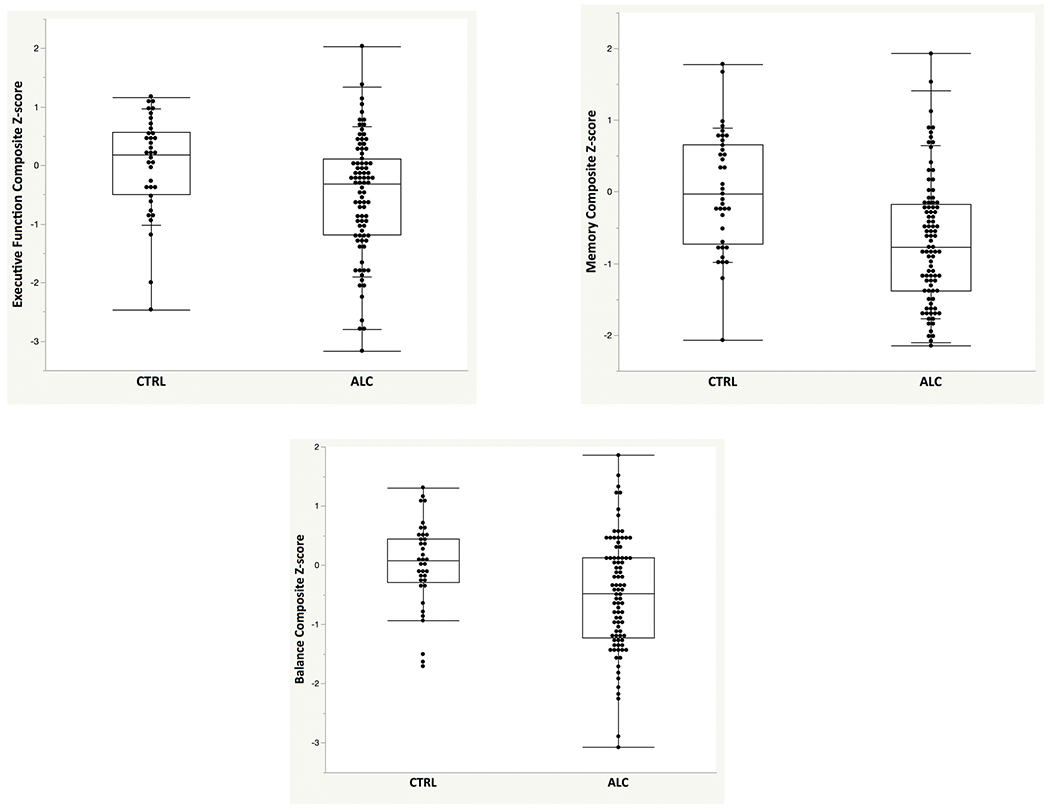
Box plots with individual data points depicting age- and education-corrected Z-scores (based on the control group: mean=0, standard deviation=1) for executive functions (EF), memory (MEM), and static balance (BAL) scores for the ALC and CTRL groups.
Regional Brain Volumes
Heteroscedasticity was tested among brain volume measures; a non-normal distribution was detected for pontine volume. The two pontine cases that were determined to be outliers were omitted in all analyses examining pontine volume.
ALC had smaller cingulate [t(129)=2.36, p=.020, Cohen’s d=.42, 3.5% smaller], insular [t(129)=2.84, p=.005, Cohen’s d=.42, 4% smaller], parietal [t(129)=2.39, p=.018, Cohen’s d=.42, 3% smaller], and hippocampal [t(127)=2.16, p=.033, Cohen’s d=.38, 3.5% smaller] volumes and modestly smaller frontal [t(129)=1.96, p=.052, Cohen’s d=.35, 2% smaller] volumes than CTRL (Table 3).
Table 3.
Brain Volume Measures for ALC and CTRL (mean, sd, range)
| ALC | CTRL | t-test (2-tailed) | 95% CI | ||
|---|---|---|---|---|---|
| ROIs | |||||
| Frontal | 147.9 (7.3) 129.9 to 161.3 |
150.5 (5.7) 138.3 to 164.1 |
p=.052 | ✻ | [−5.27, .02] |
| Temporal | 95.9 (4.7) 82.9 to 106.1 |
97.4 (4.7) 88.5 to 106.7 |
p=.117 | ns | [−3.26, .36] |
| Parietal | 72.7 (5.5) 60.4 to 85.6 |
75.1 (4.9) 61.3 to 85.9 |
p=.018 | * | [−4.48, −.42] |
| Occipital | 63.3 (4.9) 51.3 to 74.4 |
63.7 (4.2) 54.2 to 74.3 |
p=.679 | ns | [−2.20, 1.44] |
| Cingulate | 20.1 (1.5) 16.1 to 24.0 |
20.8 (1.4) 16.5 to 22.7 |
p=.020 | * | [−1.22, −.11] |
| Insula | 12.3 (10) 10.1 to 14.61 |
12.8 (1.0) 11.0 to 15.4 |
p=.005 | ** | [−.91, −.16] |
| Caudate | 8.4 (0.8) 6.3 to 10.2 |
8.2 (0.7) 7.0 to 10.2 |
p=.152 | ns | [−.08, .49] |
| Pons | 8.0 (0.9) 5.6 to 9.9 |
8.3 (0.9) 6.3 to 10.9 |
p=.231 | ns | [−57, .14] |
| Hippocampus | 8.5 (.1) 7.0 to 9.6 |
8.8 (.7) 7.6 to 10.6 |
p=.033 | * | [−.50, −.02] |
| Thalamus | 11.8 (.8) 10.2 to 14.2 |
11.9 (8) 10.2 to 13.5 |
p=.407 | ns | [−.46, .19] |
| Superior Cerebellum | 50.2 (4.1) 39.2 to 59.4 |
50.1 (4.9) 35.3 to 61.2 |
p=.914 | ns | [−1.61, 1.79] |
p <.05,
p<.01,
p<.06
Correlations Between Functional Composite Scores and Regional Brain Volumes in ALC
Lower EF scores correlated with smaller frontal (r=.20, p=.036), temporal (r=.26, p=.008), and insular (r=.24, p=.014) volumes (Table 4). Lower MEM scores correlated with smaller frontal (r=.23, p=.015). Lower BAL scores correlated with smaller frontal (r=.32, p=.0013), caudate (r=.24, p=.012), and pontine (r=.30, p=.014) volumes. Spearman rank-order correlation coefficients were also significant for each of these relations.
Table 4.
Pearson correlations between cognitive and motor composite scores and regional brain volumes in ALC
| EF | MEM | BAL | |
|---|---|---|---|
| Frontal | .195 | .228 | .317 |
| Temporal | .262 | .109 | −.054 |
| Parietal | −.039 | −.018 | .095 |
| Occipital | −.125 | −.060 | .209 |
| Cingulate | .121 | .120 | .030 |
| Insula | .238 | .095 | .100 |
| Caudate | .167 | .152 | .242 |
| Pons | .110 | −.235 | .296 |
| Hippocampus | .053 | −.034 | .105 |
| Thalamus | .032 | −.144 | .163 |
| Superior Cerebellum | .041 | −.057 | −.043 |
Correlations were tested one-tailed: greater volume related to better performance
Stepwise forward multiple regression analyses tested whether any of the brain ROIs were independent predictors of composite scores. Modeling EF scores from brain ROIs volumes indicated that temporal (p=.0014) and caudate (p=.047) volumes were independent predictors. No single brain volume was an independent predictor of MEM score. Modeling BAL scores from brain ROIs indicated that frontal (p=.005), occipital (p=.007), caudate (p=.022), and pontine (p=.01) volumes were independent predictors of variance. Using the Cook’s distance statistic, no score was identified as having undue influence on any overall model (all scores <.5).
Composite Scores and Regional Brain Volumes: Relations with Demographic and Alcohol Consumption Variables
Correlational analyses tested relations in the ALC group between age, sex, total alcohol consumption, duration of sobriety, and time since last an individual met diagnostic criteria for an alcohol diagnosis and cognitive and motor scores and regional brain volumes. Depending on the distribution of scores either Pearson or Spearman tests were conducted. Lower BAL scores correlated with older age (r=−.36, p=.0006), whereas EF and MEM scores did not correlate with age (r=−.15, p=.16; r=−.03, p=.77). By contrast, lower EF (rho=−.24, p=.025) and lower MEM (rho=−.33, p=.002), but not BAL (rho=−.142, p=.19) scores correlated with greater lifetime alcohol consumption (Figure 3). Duration of abstinence and time since last met alcohol dependence diagnosis was not correlated with any of the composite scores. There were no sex differences on any of the composite scores.
Figure 3:

Scatterplots depicting relations between EF, MEM, and BAL scores (age- and education-corrected Z-scores) and age at testing and total lifetime alcohol consumption (kg) in ALC.
Multiple regression analyses examined whether age or total alcohol consumption were independent predictors of EF, MEM, or BAL. Neither age nor total alcohol consumption was an independent predictor of EF scores. Total alcohol but not age was an independent predictor of MEM scores, whereas age but not total alcohol was an independent predictor of BAL scores, keeping in mind that these composite scores were already corrected for normal aging effects. For MEM scores age accounted for 1.6% of the variance, whereas total alcohol consumption accounted for 14.8% of the variance. For BAL scores age accounted for 11.3% of the variance and total alcohol did not account for any of the variance.
Most of the alcohol participants in this sample reported having smoked cigarettes. At the time of testing there was smoking information for 92 or 94 ALC subjects with 27 never having met nicotine dependence, 18 had past nicotine dependence, and 47 had current nicotine dependence. There were no differences observed between individuals who had no history of nicotine dependence compared with individuals who had past, current, or lifetime nicotine dependence on EF, MEM, BAL composite scores or any brain volume measure. The group of alcoholics who had a lifetime nicotine dependence diagnosis (past or current) had fewer years of formal education than the group of alcoholics who never met criteria for nicotine dependence (Z=2.64, p=.008).
For regional brain volumes, older age was predictive of smaller overall frontal (r=−.34, p=.004), insular (r=−.24, p=.009), caudate (r=−.22, p=.017), and thalamic (r=−.43, p<.0001) volumes. Greater lifetime alcohol consumption was predictive of smaller insular volumes (rho=−.33, p=.001). Duration of abstinence and time since last met alcohol dependence diagnosis was not correlated with any brain volume measure with the exception of time since last met diagnosis and frontal orbital volume (rho=−.22, p=.03) but this was in the unexpected direction (greater duration since last met diagnosis was related to smaller volume). No sex differences were observed between alcoholic men and women, with the exception of parietal volume (Z=2.19, p=.029), with alcoholic men having 3.7 % smaller volume than alcoholic women.
Exploratory Analyses
Frontal Subregional Volumes
In support of our hypothesis, EF, MEM, and BAL scores correlated with smaller volumes of the total frontal cortex. Frontal subregional volumes were quantified in the same way as were our other regional brain volumes (Figure 4). ALC had smaller precentral volumes than CTRL (t(128)=2.99, p=.002; Cohen’s d=.53, 6% smaller) (Table 5). Exploratory analyses sought possible dissociable relations between frontal subregional volumes [precentral, superior, orbital, middle, inferior, supplementary motor, and medial] and EF, MEM, and BAL scores. These analyses indicated that lower MEM scores correlated with smaller orbital (r=.439, p=.0001) and inferior (r=.236, p=.013) frontal volumes. Lower BAL scores correlated with smaller precentral (r=.249, p=.01), middle (r=.251, p=.01), and supplementary motor (r=.250, p=.01) frontal volumes (Table 5).
Figure 4:

Color-coded atlas identifying the subregional volumes of the frontal cortices.
Table 5.
Frontal Regional Brain Volume Measures for ALC and CTRL (mean, sd, range)
| ALC | CTRL | t-test (2-tailed) | 95% CI | ||
|---|---|---|---|---|---|
| Frontal ROIs | |||||
| precentral | 17.4 (1.9) 12.9 to 22.9 |
18.5 (1.7) 13.5 to 21.7 |
p=.003 | ** | [−1.81, −.37] |
| superior | 19.3 (1.8) 15.8 to 24.6 |
19.2 (1.5) 16.0 to 22.5 |
p=.826 | ns | [−.59, .73] |
| orbital | 26.1 (2.1) 21.8 to 33.3 |
26.4 (1.8) 23.9 to 32.4 |
p=.440 | ns | [−1.10, .48] |
| middle | 25.2 (2.1) 19.8 to 31.0 |
25.9 (1.9) 23.5 to 31.3 |
p=.093 | ns | [−1.49, .12] |
| inferior | 23.8 (1.8) 20.0 to 27.6 |
24.1 (1.5) 20.5 to 27.4 |
p=.323 | ns | [−.98, .33] |
| supplementary motor | 11.2 (1.3) 8.5 to 14.1 |
11.4 (1.1) 9.3 to 14.1 |
p=.303 | ns | [−.75, .24] |
| medial | 24.7 (1.6) 21.1 to 28.2 |
24.9 (1.8) 21.3 to 28.8 |
p=.625 | ns | [−.81, .49] |
p<.01
Stepwise forward multiple regression analyses modeling composite scores from regional frontal volumes indicated that frontal superior (p=.04) and frontal orbital (p=.0002) volumes were independent predictors of MEM scores.
Non-alcohol Substance Diagnosis History in the Alcohol Group
Next, we examined whether a history of a non-alcohol substance diagnosis in the context of alcoholism was associated with more severe deficits or different brain correlates from those reported on the entire alcohol group, which included alcoholics who did not have a history of a non-alcohol substance diagnosis. Examination of these 2 ALC subgroups (no history of non-alcohol substance diagnosis vs. yes history of non-alcohol substance diagnosis) revealed no differences on EF, MEM, or BAL composite scores or any brain volume measure with the exception of occipital volumes (Z=2.00, p=.045): the ALC subgroup with a history of a non-alcohol substance diagnosis had larger occipital volumes than the ALC subgroup without a drug history..
In the subgroup of alcoholics with no drug diagnosis history, lower EF scores were related to smaller temporal (r=.533, p=.0024) and frontal superior (r=.372, p=.043) volumes. Lower MEM scores in this subgroup were related to smaller frontal superior (r=.405, p=.021) and frontal inferior (r=.396, p=.025) volumes. Lower BAL scores were related to smaller overall frontal (r=.453, p=.009), frontal precentral (r=.510, p=.003), and frontal inferior (r=.374, p=.035) volumes.
In the subgroup of alcoholics with a drug diagnosis history, lower EF scores were related to smaller insula volumes (r=.277, p=.039). Lower MEM scores were related to smaller frontal orbital volumes (r=.521, p=.0001). Within this subgroup, lower BAL scores were related to smaller occipital (r=.290, p=.03), frontal middle (r=.282, p=.037), and pontine (r=.282, p=.037) volumes.
The difference between the correlation coefficient reflecting the relation between MEM scores and frontal orbital volumes between the subgroup of alcoholics with a non-alcohol substance diagnosis in their lifetime and those without a non-alcohol substance diagnosis in the lifetime approached significance (r=.52 vs. r=.17, p=.07) (Figure 5).
Figure 5:

Scatterplots depicting relations between MEM scores and frontal orbital volumes in ALC subgroups divided into those who have never had a non-alcohol substance diagnosis in their lifetime and those who had or have a non-alcohol substance diagnosis.
DISCUSSION
This study identified a number of brain-behavior relations in alcoholism. These relations lend support to hypotheses invoking different neural systems rather than one common or diffuse neural pathway underlying the cognitive and motor deficits observed in chronic alcoholism.
Brain volume deficits in this sample of chronic alcoholics reflected those observed in the full group of alcoholics from which this sample was selected (Pfefferbaum et al. 2018; Sullivan et al. 2018) and are consistent with reports from previous imaging studies (Cardenas et al. 2007; Ritz et al. 2016){Makris et al 2008}. Using atlas-based quantitative MRI, this study demonstrated that the alcoholics examined herein had volume deficits in frontal, cingulate, insular, parietal, and hippocampal regions as observed in the larger sample from which this group was drawn (Sullivan et al. 2018){Pfefferbaum 2018}. In addition, after taking normal aging into account, older age was associated with greater volume deficits in frontal, insular, caudate, and thalamus regions, also consistent with our previous reports.
This study extends previous research by directly comparing nonamnesic alcoholics across several functional domains in relation to cortical and subcortical brain volumes. As predicted, all three composite scores – executive function, memory, and balance – were related to frontal lobe volume in our group of alcoholics. These results support the hypothesis that consistent functional deficits observed in individuals with alcohol use disorder are associated with frontally-based neural systems (Oscar-Berman and Hutner 1993; Zahr et al. 2017). In addition to relations with the frontal lobe, independent predictors of executive functions included temporal and caudate volumes and independent predictors of balance included frontal, occipital, caudate, and pontine volumes.
Executive functions comprise a wide array of higher-order cognitive processes including set-shifting, divided attention, inhibitory control, planning, and decision making and have been shown to be associated with extra-frontal regions (Alvarez and Emory 2006). The relevance of temporal lobe and caudate volumes to executive function performance highlights the role of extra-frontal regions in the execution of these multifactorial tasks, also proposed previously (Chung et al. 2014). Functional MRI studies have demonstrated involvement of the temporal regions in executive functions of inhibitory and set-shifting processes (Collette et al. 2006). Similarly, use of intracerebral recording in individuals with epilepsy indicates a role for temporal neocortex in executive functions (Bockova et al. 2007; Rusnakova et al. 2011). Slower information processing speed generally considered as a feature of executive functions was associated with cortical thinning including temporal regions (MacPherson et al. 2017). These results also extend a previous study (Macfarlane et al., 2013) that reported poorer executive function was associated with smaller caudate volumes in a sample of older adults with abnormal white matter signal on MRI. Taken together, these studies demonstrate the relevance of temporal neocortical and caudate integrity to the performance of tasks purported to assess executive functions.
Our findings provide additional evidence of the integrity of the pons and caudate to motor functions associated with balance in alcoholism. These results are consistent with previous reports and further highlight critical nodes within the frontopontocerebellar systems subserving balance and gait (Sullivan et al. 2003). These results also extend a previous study (Macfarlane et al., 2015) that reported poorer gait and balance was associated with shape abnormalities of the caudate nucleus in a sample of older adults with abnormal white matter signal on MRI. Balance and gait deficits are often reported in alcoholics, even after prolonged sobriety (Smith and Fein 2011; Sullivan et al. 2000b). Despite statistically removing the effects of normal aging, older age persisted in predicting poorer static balance in the alcoholics which in turn could contribute to an increased risk of falls with aging.
Subregional Frontal Volumes
Exploratory analyses investigating relations between subregional frontal volumes and composite scores identified different patterns of associations between neural substrates and cognitive and motor processes in alcoholism. In particular, orbitofrontal volume was a unique predictor of memory scores, accounting for almost 15% of the variance. Integrity of the frontal cortex, specifically orbitofrontal regions (Frey and Petrides 2000; Frey and Petrides 2002), is critical for memory processes (Buckner et al. 1999). Convergent evidence from non-human primate studies (Meunier et al. 1997) and human functional imaging studies (Frey and Petrides 2000; Frey and Petrides 2002) indicates that orbitofrontal cortex plays a key role in encoding of information. A debate endures in studies of human alcoholism divided on whether the memory deficits are a consequence of executive dysfunction or whether they are a result of genuine memory compromise (Pitel et al. 2007). Taking a systems approach, it may be that the memory circuit compromised in nonamnesic alcoholics includes impairment of orbitofrontal, medial temporal regions, or both regions, especially given their rich connections (Frey and Petrides 2002). Thus, impairment in memory performance may be a result of both an encoding deficit subserved by orbitofrontal-medial temporal integrity and executive dysfunction, specifically retrieval deficits, subserved by a separate frontally-based neural system (Eichenbaum 2017). Further to this point, post-hoc analyses revealed that the relation between orbitofrontal volumes and memory scores was observed only in the alcohol subgroup with a drug diagnosis history and not the alcohol subgroup without an alcohol history. This result suggests that heterogeneity in results pertaining to memory performance in nonamnesic alcoholics could possibly be partially explained by the comorbidity of lifetime non-alcohol substance diagnosis in the context of alcoholism.
Relations Between Age and Alcohol Variables and Performance
Demographic and disease-related variables were predictive of alcohol-related functional deficits. Age and total lifetime alcohol consumption, although related to each other as would be expected, demonstrated selective relations with cognitive and motor abilities in our sample of alcoholics. Older age was predictive of poorer performance on static balance, whereas greater total lifetime alcohol consumption was predictive of poorer memory performance. These findings provide evidence of the moderating influences of demographic and disease-related variables in relations to the memory and motor deficits observed in chronic alcoholism.
Limitations
Limitations of this study include the difficulty inherent in measuring small regions of the cerebellum, medial temporal, and diencephalic regions. Although global volumes can be assessed for these regions, parcellation of specific regions are more difficult. Segmentation and parcellation of regional cerebellar volumes are particularly challenging, and lack of demonstrated brain-behavior relations in this study does not argue against the demonstrated relevance of the cerebellar to cognitive and motor abilities demonstrated in other studies. In addition, reflective of the population, the alcohol group in this study had a number of comorbid conditions that could influence their performance on cognitive and motor tasks including a history of drug abuse or dependence, current smoking, and current depression and anxiety. Although statistical analyses were conducted to assess the moderating influence of these factors to performance, small sample sizes preclude determination of the effects of different drugs on observed deficits. Nonetheless, post-hoc analyses did determine that it was the alcohol group with a history of drug diagnosis that showed the relationship between memory performance and orbital frontal volume and not the alcoholics without a history of drug diagnosis. Further, by virtue of the cross-sectional nature of this study, it must be acknowledged that the observed outcomes reported here could be due to pre-existing risk factors, and thus causal direction cannot be determined. Finally, given the sample size of our alcohol group, interpretation of first-order correlations below r=.30 should be deemed speculative.
Conclusion
Taken together, these results demonstrate brain-behavior relations in a cohort of alcoholics and provide further evidence that the cognitive and motor deficits in alcoholism are likely a result of different neural systems. These results also demonstrate differential moderating influences of age and total alcohol consumption on cognitive and motor deficits in alcoholism. Further, this study indicates moderating influences of drug use in the context of alcoholism notable on episodic memory processes and associated orbital frontal volume. Together these relations contribute to identification of factors underlying heterogeneity in expression of brain structural and functional deficits of alcohol use disorder.
Acknowledgements:
This study was funded by the National Institutes of Health (NIH) (AA010723, AA017923, AA005965). We would like to thank Wesley K. Thompson, Ph.D., Professor in the Division of Biostatistics and Bioinformatics at the University of California in San Diego for his invaluable guidance in statistical analysis.
Footnotes
Disclosure of potential conflicts of interest: The authors declare that they have no conflict of interest.
Compliance with Ethical Standards:
Research involving Human Participants and/or Animals: Research was conducted on human participants. All procedures performed in this study were in accordance with the ethical standards of the institutional and/or national research committee and with the 1964 Declaration of Helsinki and its later amendments. [This study was approved by the Institutional Review Boards of Stanford University and SRI International.]
Informed Consent: Informed consent was obtained from all individual participants included in the study.
REFERENCES:
- Alvarez JA, Emory E (2006) Executive function and the frontal lobes: a meta-analytic review Neuropsychology Review 16:17–42 doi: 10.1007/s11065-006-9002-x [DOI] [PubMed] [Google Scholar]
- Avants BB, Epstein CL, Grossman M, Gee JC (2008) Symmetric diffeomorphic image registration with cross-correlation: evaluating automated labeling of elderly and neurodegenerative brain Medical Image Analysis 12:26–41 doi: 10.1016/j.media.2007.06.004 [DOI] [PMC free article] [PubMed] [Google Scholar]
- Avants BB, Tustison NJ, Song G, Cook PA, Klein A, Gee JC (2011) A reproducible evaluation of ANTs similarity metric performance in brain image registration NeuroImage 54:2033–2044 doi: 10.1016/j.neuroimage.2010.09.025 [DOI] [PMC free article] [PubMed] [Google Scholar]
- Beck AT, Steer RA, Brown GK (1996) Manual for the Beck Depression Inventory-II. Psychological Corporation, San Antonio, TX [Google Scholar]
- Benjamini Y, Hochberg Y (1995) Controlling the false discovery rate: a practical and powerful approach to mulitple testing J Royal Stat Soc Ser B 57:289–300 [Google Scholar]
- Bockova M, Chladek J, Jurak P, Halamek J, Rektor I (2007) Executive functions processed in the frontal and lateral temporal cortices: intracerebral study Clin Neurophysiol 118:2625–2636 doi: 10.1016/j.clinph.2007.07.025 [DOI] [PubMed] [Google Scholar]
- Borkowski JG, Benton AL, Spreen O (1967) Word fluency and brain damage Neuropsychologia 5:135–140 [Google Scholar]
- Buckner RL, Kelley WM, Petersen SE (1999) Frontal cortex contributes to human memory formation Nature Neuroscience 2:311–314 doi: 10.1038/7221 [DOI] [PubMed] [Google Scholar]
- Cardenas VA, Studholme C, Gazdzinski S, Durazzo TC, Meyerhoff DJ (2007) Deformation-based morphometry of brain changes in alcohol dependence and abstinence NeuroImage 34:879–887 doi: 10.1016/j.neuroimage.2006.10.015 [DOI] [PMC free article] [PubMed] [Google Scholar]
- Chanraud S et al. (2007) Brain morphometry and cognitive performance in detoxified alcohol-dependents with preserved psychosocial functioning Neuropsychopharmacology 32:429–438 doi: 10.1038/sj.npp.1301219 [DOI] [PubMed] [Google Scholar]
- Chung HL, Weyandt LL, Swentowsky A (2014) The physiology of executive functioning In: Goldstein S, Naglieri JA (eds) Handbook of Executive Functioning. Springer, New York, pp 13–27 [Google Scholar]
- Collette F, Hogge M, Salmon E, Van der Linden M (2006) Exploration of the neural substrates of executive functioning by functional neuroimaging Neuroscience 139:209–221 doi: 10.1016/j.neuroscience.2005.05.035 [DOI] [PubMed] [Google Scholar]
- Coupe P, Yger P, Prima S, Hellier P, Kervrann C, Barillot C (2008) An optimized blockwise nonlocal means denoising filter for 3-D magnetic resonance images IEEE Transactions on Medical Imaging 27:425–441 doi: 10.1109/tmi.2007.906087 [DOI] [PMC free article] [PubMed] [Google Scholar]
- Courville CB (1955) Effects of Alcohol on the Nervous System of Man. San Lucas Press, Los Angeles [Google Scholar]
- Cox RW (1996) AFNI: software for analysis and visualization of functional magnetic resonance neuroimages Computers and Biomedical Research 29:162–173 [DOI] [PubMed] [Google Scholar]
- Dupuy M, Chanraud S (2016) Imaging the Addicted Brain: Alcohol International Review of Neurobiology 129:1–31 doi: 10.1016/bs.irn.2016.04.003 [DOI] [PubMed] [Google Scholar]
- Eichenbaum H (2017) Memory: Organization and Control Annual Review of Psychology 68:19–45 doi: 10.1146/annurev-psych-010416-044131 [DOI] [PMC free article] [PubMed] [Google Scholar]
- Fama R, Le Berre AP, Hardcastle C, Sassoon SA, Pfefferbaum A, Sullivan EV, Zahr NM (2019) Neurological, nutritional and alcohol consumption factors underlie cognitive and motor deficits in chronic alcoholism Addiction Biology 24:290–302 doi: 10.1111/adb.12584 [DOI] [PMC free article] [PubMed] [Google Scholar]
- Fama R, Sullivan EV (2014) Alcohol In: Allen DN, Woods SP (eds) Neuropsychological Aspects of Substance Use Disorders. National Academy of Neuropsychology Series on Evidence-Based Practices Oxford University Press, New York, pp 103–133 [Google Scholar]
- First MB, Spitzer RL, Gibbon M, Williams JBW (1998) Structured Clinical Interview for DSM-IV Axis I Disorders (SCID) Version 2.0. Biometrics Research Department, New York State Psychiatric Institute, New York, NY [Google Scholar]
- Fregly AR (1968) An ataxia battery not requiring rails Aerospace Medicine 39:277–282 [PubMed] [Google Scholar]
- Fregly AR, Graybiel A, Smith MS (1972) Walk on floor eyes closed (WOFEC): A new addition to an ataxia test battery Aerospace Medicine 43:395–399 [PubMed] [Google Scholar]
- Frey S, Petrides M (2000) Orbitofrontal cortex: A key prefrontal region for encoding information Proceedings of the National Academy of Sciences of the United States of America 97:8723–8727 doi: 10.1073/pnas.140543497 [DOI] [PMC free article] [PubMed] [Google Scholar]
- Frey S, Petrides M (2002) Orbitofrontal cortex and memory formation Neuron 36:171–176 [DOI] [PubMed] [Google Scholar]
- Grodin EN, Lin H, Durkee CA, Hommer DW, Momenan R (2013) Deficits in cortical, diencephalic and midbrain gray matter in alcoholism measured by VBM: Effects of co-morbid substance abuse NeuroImage Clinical 2:469–476 doi: 10.1016/j.nicl.2013.03.013 [DOI] [PMC free article] [PubMed] [Google Scholar]
- Hanganu A, Provost JS, Monchi O (2015) Neuroimaging studies of striatum in cognition part II: Parkinson’s disease Frontiers in Systems Neuroscience 9:138 doi: 10.3389/fnsys.2015.00138 [DOI] [PMC free article] [PubMed] [Google Scholar]
- Harper CG, Kril JJ (1990) Neuropathology of alcoholism Alcohol and Alcoholism 25:207–216 [DOI] [PubMed] [Google Scholar]
- Iglesias JE, Liu CY, Thompson PM, Tu Z (2011) Robust brain extraction across datasets and comparison with publicly available methods IEEE Transactions on Medical Imaging 30:1617–1634 doi: 10.1109/tmi.2011.2138152 [DOI] [PubMed] [Google Scholar]
- Jernigan TL (1990) Techniques for Imaging Brain Structure - Neuropsychological Applications Neuropsychology 17:81–105 [Google Scholar]
- Le Berre AP et al. (2014) Chronic alcohol consumption and its effect on nodes of frontocerebellar and limbic circuitry: comparison of effects in France and the United States Human Brain Mapping 35:4635–4653 doi: 10.1002/hbm.22500 [DOI] [PMC free article] [PubMed] [Google Scholar]
- Le Berre AP, Laniepce A, Segobin S, Pitel AL, Sullivan EV (2019) Alcohol use disorder: permanent and transient effects on the brain and neuropsychological functions In: Stern RA, Michael A (eds) The Oxford Handbook of Adult Cognitive Disorders. Oxford University Press, New York [Google Scholar]
- Macfarlane MD et al. (2013) Executive dysfunction correlates with caudate nucleus atrophy in patients with white matter changes on MRI: a subset of LADIS Psychiatry Research 30:16–23 [DOI] [PubMed] [Google Scholar]
- Macfarlane MD et al. (2015) Shape abnormalities of the caudate nucleus correlates with poorer gait and balance: results from a subset of the LADIS Study American Journal of Geriatric Psychiatry 23:59–71 [DOI] [PMC free article] [PubMed] [Google Scholar]
- MacPherson SE et al. (2017) Processing speed and the relationship between Trail Making Test-B performance, cortical thinning and white matter microstructure in older adults Cortex 95:92–103 doi: 10.1016/j.cortex.2017.07.021 [DOI] [PMC free article] [PubMed] [Google Scholar]
- Makris N et al. (2008) Decreased Volume of the Brain Reward System in Alcoholism Biological Psychiatry 64:192–202 [DOI] [PMC free article] [PubMed] [Google Scholar]
- Mattis S (2004) Dementia Rating Scale (DRS) Professional Manual. Psychological Assessment Resources, Inc., Odessa, FL [Google Scholar]
- Meunier M, Bachevalier J, Mishkin M (1997) Effects of orbital frontal and anterior cingulate lesions on object and spatial memory in rhesus monkeys Neuropsychologia 35:999–1015 [DOI] [PubMed] [Google Scholar]
- Nakamura-Palacios EM, Souza RS, Zago-Gomes MP, de Melo AM, Braga FS, Kubo TT, Gasparetto EL (2014) Gray matter volume in left rostral middle frontal and left cerebellar cortices predicts frontal executive performance in alcoholic subjects Alcoholism: Clinical and Experimental Research 38:1126–1133 doi: 10.1111/acer.12308 [DOI] [PubMed] [Google Scholar]
- Nelson HE (1982) The National Adult Reading Test (NART). Nelson Publishing Company, Windsor, Canada [Google Scholar]
- Oscar-Berman M, Hutner N (1993) Frontal lobe changes after chronic alcohol ingestion In: Hunt WA, Nixon SJ (eds) Alcohol-Induced Brain Damage, NIAAA Research Monographs, No. 22 National Institutes of Health, Rockville, MD, pp 121–156 [Google Scholar]
- Oscar-Berman M, Valmas MM, Sawyer KS, Ruiz SM, Luhar RB, Gravitz ZR (2014) Profiles of impaired, spared, and recovered neuropsychologic processes in alcoholism Handb Clin Neurol 125:183–210 doi: 10.1016/B978-0-444-62619-6.00012-4 [DOI] [PMC free article] [PubMed] [Google Scholar]
- Pfefferbaum A, Zahr NM, Sassoon SA, Kwon D, Pohl KM, Sullivan EV (2018) Accelerated and Premature Aging Characterizing Regional Cortical Volume Loss in Human Immunodeficiency Virus Infection: Contributions From Alcohol, Substance Use, and Hepatitis C Coinfection Biological Psychiatry Cognitive neuroscience and neuroimaging doi: 10.1016/j.bpsc.2018.06.006 [DOI] [PMC free article] [PubMed] [Google Scholar]
- Pitel A-L, Zahr NM, Jackson K, Sassoon S, Rosenbloom M, Pfefferbaum A, Sullivan E (2011) Signs of preclinical Wernicke’s Encephalopathy and thimine levels as predictors of neuropsychological deficits in acoholism without Korsakoff’s syndrome Neuropsychopharmacology 36:580–588 doi: 10.1038/npp.2010.189 [DOI] [PMC free article] [PubMed] [Google Scholar]
- Pitel AL et al. (2007) Genuine episodic memory deficits and executive dysfunctions in alcoholic subjects early in abstinence Alcoholism: Clinical and Experimental Research 31:1169–1178 [DOI] [PMC free article] [PubMed] [Google Scholar]
- Pitel AL, Chanraud S, Muller-Oehring EM, Pfefferbaum A, Sullivan EV (2013) Modulation of limbic-cerebellar functional connectivity enables alcoholics to recognize who is who Brain Structure & Function 218:683–695 doi: 10.1007/s00429-012-0421-6 [DOI] [PMC free article] [PubMed] [Google Scholar]
- Reitan RM (1958) Validity of the Trail Making Test as an indicator of organic brain damage Perceptual and Motor Skills 8:271–276 [Google Scholar]
- Rey A (1942) L’examen psychologique dans les cas d’encephalopathie traumatique Archives de Psychologie 28:286–340 [Google Scholar]
- Ritz L et al. (2016) Direct voxel-based comparisons between grey matter shrinkage and glucose hypometabolism in chronic alcoholism Journal of Cerebral Blood Flow and Metabolism 36:1625–1640 doi: 10.1177/0271678x15611136 [DOI] [PMC free article] [PubMed] [Google Scholar]
- Ritz L et al. (2014) Brain structural substrates of cognitive procedural learning in alcoholic patients early in abstinence Alcoholism: Clinical and Experimental Research 38:2208–2216 doi: 10.1111/acer.12486 [DOI] [PMC free article] [PubMed] [Google Scholar]
- Rohlfing T, Brandt R, Menzel R, Maurer CR Jr., (2004) Evaluation of atlas selection strategies for atlas-based image segmentation with application to confocal microscopy images of bee brains NeuroImage 21:1428–1442 [DOI] [PubMed] [Google Scholar]
- Rohlfing T, Zahr NM, Sullivan EV, Pfefferbaum A (2010) The SRI24 multi-channel atlas of normal adult human brain structure Human Brain Mapping 31:798–819 doi: 10.1002/hbm.20906 [DOI] [PMC free article] [PubMed] [Google Scholar]
- Ruff R (1988) Ruff Figural Fluence Test: Administration Manual. Neuropsychological Resources, San Diego, CA [Google Scholar]
- Rusnakova S, Daniel P, Chladek J, Jurak P, Rektor I (2011) The executive functions in frontal and temporal lobes: a flanker task intracerebral recording study J Clin Neurophysiol 28:30–35 doi: 10.1097/WNP.0b013e31820512d4 [DOI] [PubMed] [Google Scholar]
- Sadananthan SA, Zheng W, Chee MW, Zagorodnov V (2010) Skull stripping using graph cuts NeuroImage 49:225–239 doi: 10.1016/j.neuroimage.2009.08.050 [DOI] [PubMed] [Google Scholar]
- Sawyer KS, Oscar-Berman M, Mosher Ruiz S, Galvez DA, Makris N, Harris GJ, Valera EM (2016) Associations Between Cerebellar Subregional Morphometry and Alcoholism History in Men and Women Alcoholism: Clinical and Experimental Research 40:1262–1272 doi: 10.1111/acer.13074 [DOI] [PMC free article] [PubMed] [Google Scholar]
- Skinner HA (1982) Development and Validation of a Lifetime Alcohol Consumption Assessment Procedure. Addiction Research Foundation, Toronto, Canada [Google Scholar]
- Skinner HA, Sheu WJ (1982) Reliability of alcohol use indices: The lifetime drinking history and the MAST Journal of Studies on Alcohol 43:1157–1170 [DOI] [PubMed] [Google Scholar]
- Smith S (2002) Fast robust automated brain extraction Human brain mapping 17:143–155 [DOI] [PMC free article] [PubMed] [Google Scholar]
- Smith S, Fein G (2010) Cognitive performance in treatment-naive active alcoholics Alcoholism: Clinical and Experimental Research 34:2097–2105 doi: 10.1111/j.1530-0277.2010.01306.x [DOI] [PMC free article] [PubMed] [Google Scholar]
- Smith S, Fein G (2011) Persistent but less severe ataxia in long-term versus short-term abstinent alcoholic men and women: a cross-sectional analysis Alcoholism: Clinical and Experimental Research 35:2184–2192 doi: 10.1111/j.1530-0277.2011.01567.x [DOI] [PMC free article] [PubMed] [Google Scholar]
- Sullivan EV, Deshmukh A, Desmond JE, Lim KO, Pfefferbaum A (2000a) Cerebellar volume decline in normal aging, alcoholism, and Korsakoff’s syndrome: Relation to ataxia Neuropsychology 14:341–352 [DOI] [PubMed] [Google Scholar]
- Sullivan EV et al. (2003) Disruption of frontocerebellar circuitry and function in alcoholism Alcoholism: Clinical and Experimental Research 27:301–309 [DOI] [PubMed] [Google Scholar]
- Sullivan EV, Pfefferbaum A (2005) Neurocircuitry in alcoholism: A substrate of disruption and repair Psychopharmacology (Berl) 180:583–594 [DOI] [PubMed] [Google Scholar]
- Sullivan EV, Rose J, Pfefferbaum A (2006) Effect of vision, touch, and stance on cerebellar vermian-related sway and tremor: A quantitative MRI and physiological study Cerebral Cortex 16:1077–1086 doi:16221930 [DOI] [PubMed] [Google Scholar]
- Sullivan EV, Rosenbloom MJ, Lim KO, Pfefferbaum A (2000b) Longitudinal changes in cognition, gait, and balance in abstinent and relapsed alcoholic men: Relationships to changes in brain structure Neuropsychology 14:178–188 [PubMed] [Google Scholar]
- Sullivan EV, Zahr NM, Sassoon SA, Thompson WK, Kwon D, Pohl KM, Pfefferbaum A (2018) The Role of Aging, Drug Dependence, and Hepatitis C Comorbidity in Alcoholism Cortical Compromise JAMA Psychiatry 75:474–483 doi: 10.1001/jamapsychiatry.2018.0021 [DOI] [PMC free article] [PubMed] [Google Scholar]
- Tustison NJ, Avants BB, Siqueira M, Gee JC (2011) Topological well-composedness and glamorous glue: a digital gluing algorithm for topologically constrained front propagation IEEE Transactions on Image Processing 20:1756–1761 doi: 10.1109/tip.2010.2095021 [DOI] [PubMed] [Google Scholar]
- Wechsler D (1987) Wechsler Memory Scale - Revised. The Psychological Corporation, San Antonio, TX [Google Scholar]
- Zahr NM, Pfefferbaum A, Sullivan EV (2017) Perspectives on fronto-fugal circuitry from human imaging of alcohol use disorders Neuropharmacology 122:189–200 doi: 10.1016/j.neuropharm.2017.01.018 [DOI] [PMC free article] [PubMed] [Google Scholar]