Abstract
Purpose:
We demonstrate the feasibility of optical imaging as a quality assurance tool for static small beamlets, and pre-treatment verification tool for radiosurgery and VMAT plans.
Methods:
Small static beams and clinical Volumetric-modulated arc therapy (VMAT) plans were simulated in a treatment planning system (TPS) and delivered to a cylindrical tank filled with water-based liquid scintillator. Emission was imaged using a blue-sensitive, intensified CMOS camera time-gated to the linac pulses. For static beams, percentage depth and cross beam profiles of projected intensity distribution were compared to treatment planning system (TPS) data. 2D gamma analysis was performed on all clinical plans, and the technique was tested for sensitivity against common errors (multileaf collimator position, gantry angle) by inducing deliberate errors in the VMAT plans control points. The technique’s detection limits for spatial resolution and the smallest number of control points that could be imaged reliably was also tested. The sensitivity to common delivery errors was also compared against a commercial 2.5D diode array dosimeter.
Results:
A spatial resolution of 1 mm was achieved with our imaging setup. The optical projected percentage depth intensity profiles agreed to within 2% relative to the TPS data for small static square beams (5, 10 and 50mm2). For projected cross beam profiles, a gamma pass rate >99% was achieved for a 3%/1mm criteria. All clinical plans passed the 3%/3mm criteria with >95% passing rate. A static 5 mm beam with 20 Monitor Units could be measured with an average percent difference of 5.5 ±3% relative to the TPS. The technique was sensitive to multileaf collimator errors down to 1 mm and gantry angle errors of 1°.
Conclusions:
Optical imaging provides ample spatial resolution for imaging small beams. The ability to faithfully image down to 20 MU of 5 mm, 6 MV beamlets prove the ability to perform quality assurance for each control point within dynamic plans. The technique is sensitive to small offsets errors in gantry angles and Multi-leaf collimator (MLC) leaf positions, and at certain scenario it exhibits higher sensitivity than a commercial 2.5D diode array.
Keywords: Scintillation, Optical Imaging, SRS, SBRT, Small Fields
1. Introduction
Intensity Modulated Radiation Therapy (IMRT) and Volumetric Modulated Arc Therapy (VMAT)1,2 enable highly conformal dose delivery to the tumor while keeping the dose to organs-at-risk (OAR) low. Techniques such as Stereotactic body Radiation Therapy (SBRT) and Stereotactic Radiosurgery (SRS) are also widely used due to favorable outcomes for non-small lung cancer3 and brain metastases4. Common to these modalities is the use of small, irregularly shaped and intensity modulated beamlets with the goal of steep dose gradients. However, there are well documented problems associated with small fields.5,6,7,8. Improper detector selection for measurement of output factors can be problematic.9 Moreover, AAPM has instituted stringent criteria for IMRT and VMAT compared to conventional radiotherapy10.
Unfortunately, current quality assurance techniques have not been able to keep up with the ever-increasing demands of modern radiation therapy. Ionization chambers are generally the gold standard for radiation dosimetry but are not ideal for small beamlet QA, because they suffer from volume averaging effects (i.e. steep dose variation over the active sensing volume) and can under report the dose for small fields11. Micro-ionization chambers have been developed for small fields, but they suffer from low sensitivity due to their small size. Silicon diodes can provide high resolution for small fields. However, diodes suffer from dose perturbation effects7 and have angular dependence.
For patient specific quality assurance, cylindrical diode arrays have been used for end-to-end testing. However, such devices usually suffer from coarse resolution and fail to provide dose at isocenter. More recently, 3D gel dosimetry13 has been used for patient specific QA tests, however issues of long readout times and uncertainty in absolute dose measurements have complicated use of this technique14. Electronic portal imaging devices (EPID) have become routinely used for pre-treatment verification, providing high resolution dose verification. However, amorphous silicon based EPIDs have been reported to be oversensitive to low energy photons because of scatter inside the bulk layer of the imager15.
Optical emission of Cherenkov radiation18 and scintillation has been demonstrated to be a reliable surrogate for dose deposition inside a water equivalent phantom16,17. Recently, Cherenkov imaging was used as quality assurance tool for broad beams in a MR-Linac19. Good agreement was found between the optical images obtained from an intensified charge-coupled device (CCD) camera and the simulated dose distribution from the TPS. However, the authors were not able to image small beamlets reliably due to a low signal to noise ratio (SNR).
In this study, we present data acquired with a blue-sensitive intensified CMOS camera that captures optical photons generated due to small beamlets in a cylindrical water phantom doped with quinine sulfate. Additionally, we evaluated the efficacy of scintillation imaging to be employed as a pre-treatment verification technique. Projected percentage depth dose (pPDD) profiles and cross beam profiles (pCBP) were compared with simulated dose distributions from the TPS. Clinical plans were imaged and gamma index analysis20 was performed. The technique’s ability to temporally resolve individual control points and sensitivity to delivery error was also tested.
2. Materials and Methods
2.1. Phantom Construction.
A 140mm diameter × 305mm long cylindrical container was constructed from acrylic. The internal surface of the phantom was painted black except for the front optical window. The black paint minimizes internal light reflection and prevents contamination of the scintillation signal by radioluminescence produced in the walls of the phantom. A front facing image of the phantom is shown in Figure 1 a). This rotationally symmetric shape was intentionally chosen for the phantom because it appropriately resembles typical patient geometries. This is essential for end-to-end testing, where the whole clinical workflow (from imaging to positioning to delivery) is tested on a phantom. Moreover, a diagonal beam delivered to a standard rectangular tank will have slightly different propagation depth at the edges21, thereby inducing errors in the periphery of cross-beam profiles.
Figure 1.
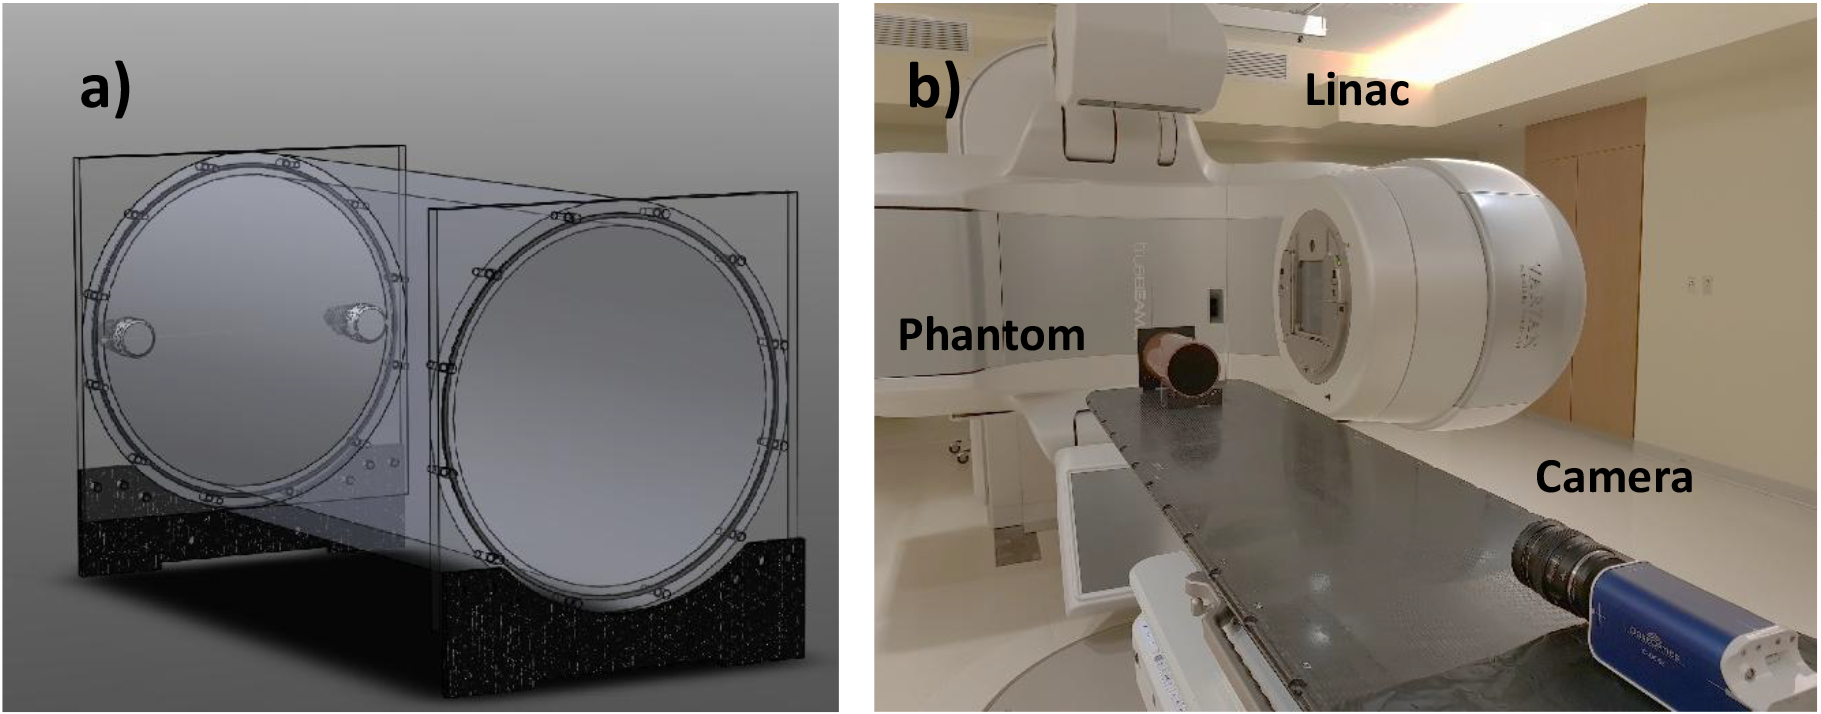
a) 3D model of a 140mm diameter ×305mm long cylindrical water phantom doped with 1g/L quinine sulfate. b) Experimental setup.
The tank was filled with distilled water doped with 1g/L quinine sulfate which was pre dissolved in 0.5N HCl (99% Quinine hemisulfate monohydrate, Sigma Aldrich, St Louis, MO). The quinine is used to convert the deposited dose to visible light emission via scintillation, but it also converts the anisotropic Cherenkov emission16,18 into an isotropic Cherenkov-excited fluorescence emission. Quinine sulfate was chosen as the best scintillator candidate because of the large Stoke’s shift between its emission and absorption spectra. Self-absorption and re-emission of scintillation light due to a significant overlap between the absorption and emission spectrum can cause blurring of the optical signal at some concentrations. It is essential that this blurring be minimized or avoided if the optical imaging is meant to be used as a commissioning and quality assurance tool. Previous studies completed a comparison of different fluorophores for this purpose16. 2D imaging cumulates the intensity (i.e. dose surrogate signal) from a solid angle defined by pixel size and the optical geometry. Standard beam quantities of percent depth dose (PDD) and cross-beam profile (CBP) are thus averaged along the optical axis, adding up dose information from areas off the beam axis. For this reason, we use projected percent depth dose (pPDD) and projected cross-beam profile (pCBP) to distinguish the 2D projected intensity profiles from true dosimetric quantities.
2.2. Imaging Radioluminescence
Optical signal from water tank, composed of scintillation light and to lesser extent of Cherenkov emission (addressed elsewhere as scintillation), was imaged using an intensified time-gated (CMOS) camera (C-Dose, DoseOptics LLC., Lebanon, NH). The image intensifier employed a blue-sensitive photocathode, ensuring maximal sensitivity in the spectral range of quinine emission (Fig. 2). Increasing the spectral sensitivity to the blue emission wavelengths of the quinine was pivotal for imaging small beamlets present in highly modulated dose delivery plans. The camera was remotely gated to the linac pulses using a scintillator-coupled solid-state detector22. Time-gating was essential for removing ambient background and acquiring images only during beam delivery. A 100 mm F/8 lens (Canon Inc., Ōta, Tokyo, Japan) was mounted to the camera. The choice of aperture of the lens was important and depended on the trade-off between the amount of signal captured and the achievable depth of field (DOF). A DOF smaller than the beam width would result in blurring near the beam edge, which would translate into erroneous beam profiles. Ideally, the depth of field should span the entirety of the phantom. To study this phenomenon, the edge spread function (ESF) of the optical system was obtained by imaging a black and white board. By taking the derivative of the ESF, the line spread function (LSF) was extracted (Fig 3). The full width at half maximum (FWHM) of the line spread function was used to define the metric of spatial resolution of the system. With the camera 1.7 m away from the isocenter, a pixel spacing of 0.23 mm/pixel was achieved, which translates to a true spatial resolution of ~1 mm. Half of this value was chosen as the acceptable limit of sharpness (0.5mm). Using this information, it was estimated that a F/8 aperture would produce a DOF of ~16cm. This DOF would be sufficient for imaging small beamlets in radiotherapy, without suffering from optical blurring.
Figure 2:
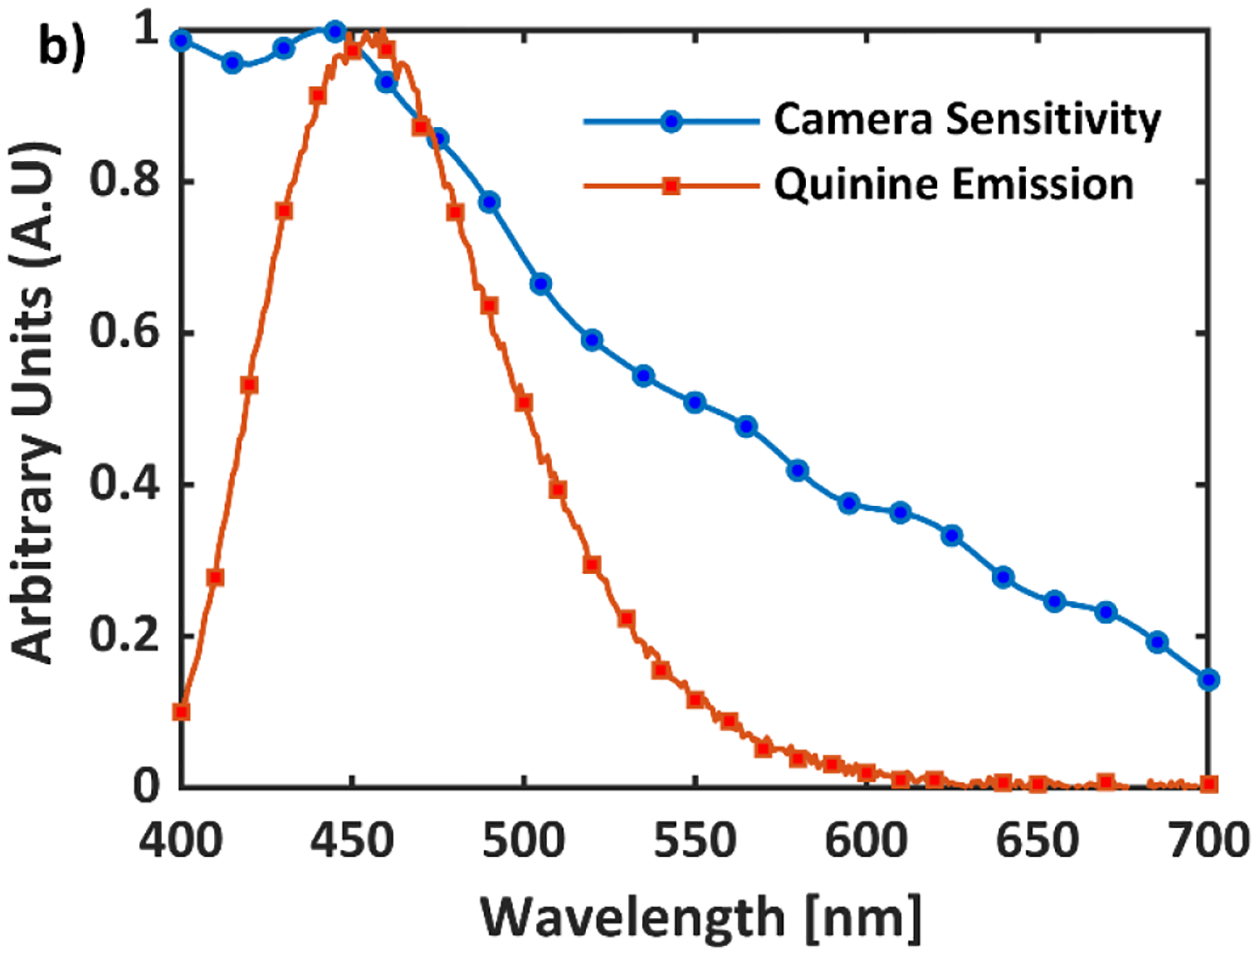
Emission Spectrum of Quinine Sulfate (1g/L) and quantum efficiency of the CMOS blue sensitive camera.
Figure 3.
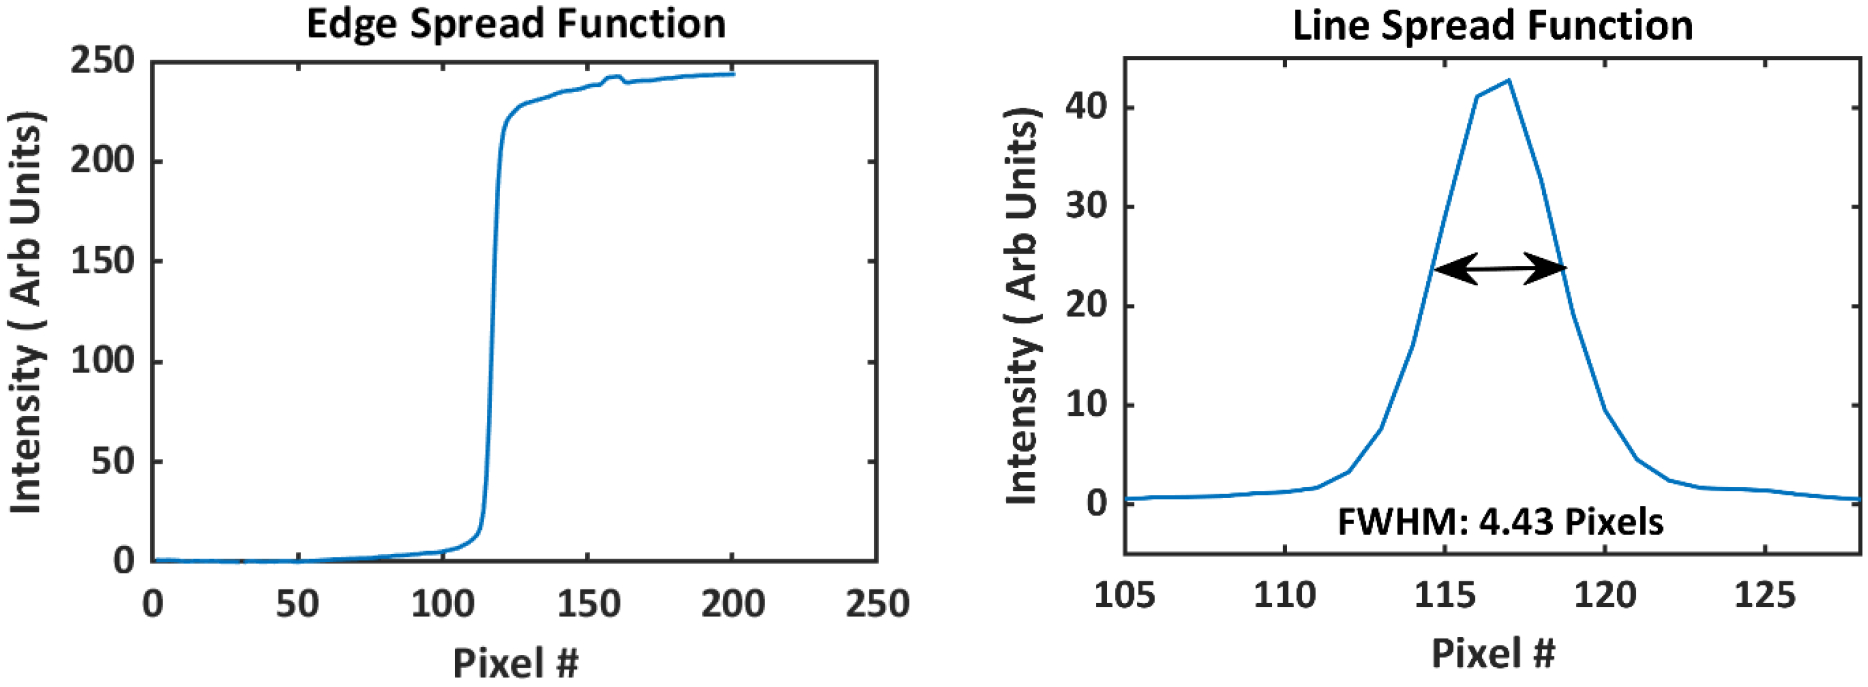
a) Edge spread function of the optical imaging system obtained by imaging a black and white edge at 1.7 b) Line spread function was found by taking the spatial derivative of the edge spread function. Full width at half maximum (FWHM) of the line spread function was found to be 4.4 pixels
Prior to image acquisition, the water phantom was scanned using a 16-slice CT scanner (Lightspeed VCT, GE Healthcare, Chicago, IL) with a slice thickness of 1.3mm , and a range of static beams and dynamic plans were simulated through the Eclipse treatment planning system (TPS) (Varian Medical Systems, Palo Alto, CA). The plans were transferred to a TrueBeam Linac (Varian Medical Systems) and delivered to the phantom. The midpoint of the phantom was aligned to the isocenter using alignment lasers in the linac bunker. The geometrical axis of the cylindrical phantom was also aligned to the optical axis of the camera. The camera was placed at the base of the couch at 1.7 m distance between the photocathode and the isocenter. A picture of the experimental setup is shown in Figure 1 b). The camera exposure time was set to 51 ms. A 5-image window temporal filter and a 5×5 pixel window median spatial filters were applied over the image stack to eliminate salt and pepper noise due to stray radiation, and the image frames were summed together, yielding a final cumulative frame with temporal resolution of 20 frames per second. The final cumulative frame was darkfield and flat-field corrected. The flatfield image was obtained by detecting the emission from an extended, highly uniform light panel positioned at distance of 1 m and normalizing the detected frame by its mean intensity value.
2.3. Static Beams
For static beams, lateral beams were applied with the gantry head rotated to 90°. A total of 500 monitor-units (MU) at 600 MU/min were delivered for 5 mm, 10 mm and 50 mm square 6 MV beams, where 1MU is defined to deliver 1cGy at dmax for a 10×10cm2 field under reference conditions. Projection percentage depth dose (pPDD) curves and projection cross beam profiles (pCBP) were extracted from the acquired images and compared against the projected PDD and CBP curves obtained from the treatment planning system. Varian’s Anisotropic Analytical Algorithm (AAA) was used as the dose calculation engine with a voxel size of 1.5 mm. The TPS images were summed along the optical axis and the optical images were summed over time. For both modalities, images were normalized to their respective maximum pixel values. The optical images were down sampled to 1.5 mm/pixel to match the TPS voxel size. The TPS and Optical images were aligned using rigid transformation. Discrepancies were seen near the entrance and exit surface dose because of the thick wall (~5mm) of the water phantom that does not produce any optical signal. Ignoring the signal originating from outer 5 mm circumference of the phantom, a circular region of interest (ROI) was chosen to extract the projected depth dose and cross beam profiles. Profiles were extracted by averaging pixel values along the beam axis.
2.4. Dynamic Plans
Five clinically approved Volumetric Modulated Arc Therapy (VMAT) plans were anonymized and delivered to the water phantom and 2.5D cylindrical diode array (ArcCHECK, Sun Nuclear, Melbourne, FL). The plans included a prostate plan, two head and neck plans, a stereotactic body radiation therapy (SBRT) plan and a multi-lesion stereotactic radiosurgery (SRS) plan. All plans other than the SRS included coplanar arcs, and all arcs were delivered to the phantom without couch rotations. The prostate plan had three 10 MV fields and a prescription dose of 180 cGy/fx. The first head and neck plan was a bilateral neck plan which delivered 180 cGy/fx with three 6MV arcs. The second head and neck plan had two 6MV FFF arcs with a prescription dose of 180cGy/fx. The SBRT plan had three 6MV FFF arcs with a prescription of 1000cGy/fx. Finally, the SRS plan was a 4-lesion, 10MV FFF three non-coplanar arc plan with a prescription of 2000cGy in a single fraction. These plans were specifically chosen to cover a range of different VMAT plan types with varying degrees of modulation and field sizes. Dose rates varied from 120 MU/min (for head and neck) to 2400MU/min (SRS). All 5 dynamic plans were delivered to the phantom on the same day to minimize setup errors.
Using DICOM files for the dynamic plans, histograms of monitor units and the average field size per control point were extracted. Average field size was calculated by summing up apertures of all non-zero MLC leaf openings and dividing by the total number of non-zero MLC leaf openings. The final cumulative normalized optical dose distribution was aligned with the projected TPS data using a rigid transformation and gamma analysis was performed for all the plans. As a comparison against the primary quality assurance (QA) modality used at our institution, the same plans were delivered to a cylindrical diode array, followed by gamma analysis.
The ability of this new optical technique to image down to a single control point even for highly modulated VMAT plans was also tested. The average number of monitor units delivered per control point and average field size per control point can be estimated from the histograms of those parameters. Using this information, a small square beam was delivered to the phantom with decreasing number of monitor units (200 to 5 MU). pPDD curves for each number of monitor units were compared against the TPS data and the average error between the two profiles was computed.
2.5. Sensitivity to Delivery Errors
The technique’s sensitivity to delivery errors was also tested. An in-house MATLAB script was written to introduce gantry and MLC errors per control point. The 4 lesion SRS plan was used for this purpose. The SRS plan included three non-coplanar arcs; two fields consisted of 98 control points and the third field had 178 control points.
For MLC offset errors, a negative offset was added to one MLC leaf and a positive offset was added to the opposite leaf per control point. Essentially, such an offset in practice would widen the MLC aperture. Offsets of 1 mm, 2 mm, 3 mm, and 4 mm were used for this study.
For gantry angle errors, a sinusoidal error function was generated, similar to that introduced by Liang et al23. A sinusoidal error signifies error in dose delivery due to gravitational effects. Essentially, the error mimics gantry sag. The magnitude of the error function was increased from 1° to 4°.
The original, unperturbed plan along with the perturbed plans were delivered to the water phantom and ArcCHECK. The same transformation matrix used to align the unperturbed optical image to the TPS image was applied to all perturbed optical images. The perturbed optical images were then compared against the original dose distribution generated by the TPS. 3%/3 mm gamma pass rate with global normalization and 10% dose threshold was evaluated as a function of the error magnitude for both ArcCHECK and the phantom.
Additionally, an overmodulated plan was mocked up in the Eclipse treatment planning system. The planning tumor volume (PTV) was chosen to be a 4 cm spherical target inside the water phantom, about 2cm off the iso-center. The lower MU objective was set to 4000 MU and the prescription dose was 600 cGy/fx. Stringent normal tissue objectives were used; the dose outside the target volume was set to drop to 10% of the maximum dose at a steep fall off rate. A single 6MV FFF beam was used for this experiment. These settings resulted in a total delivery of 4199 MU. 95% of the PTV received 100% of the prescribed dose and 90% of the other ‘normal’ tissue (outside target volume) received less than 10% of the prescribed dose. The plan was delivered to ArcCHECK, EPID and the water phantom.
3. Results
3.1. Static Beams
Figure 4 shows projected TPS (a, b and c) and scintillation images (d, e and f) for a static 6 MV beam of widths of 5mm, 10mm and a 50 mm. A total of 500MU was delivered for each beam. The projected percentage depth dose profiles are presented in Figure 5.
Figure 4.
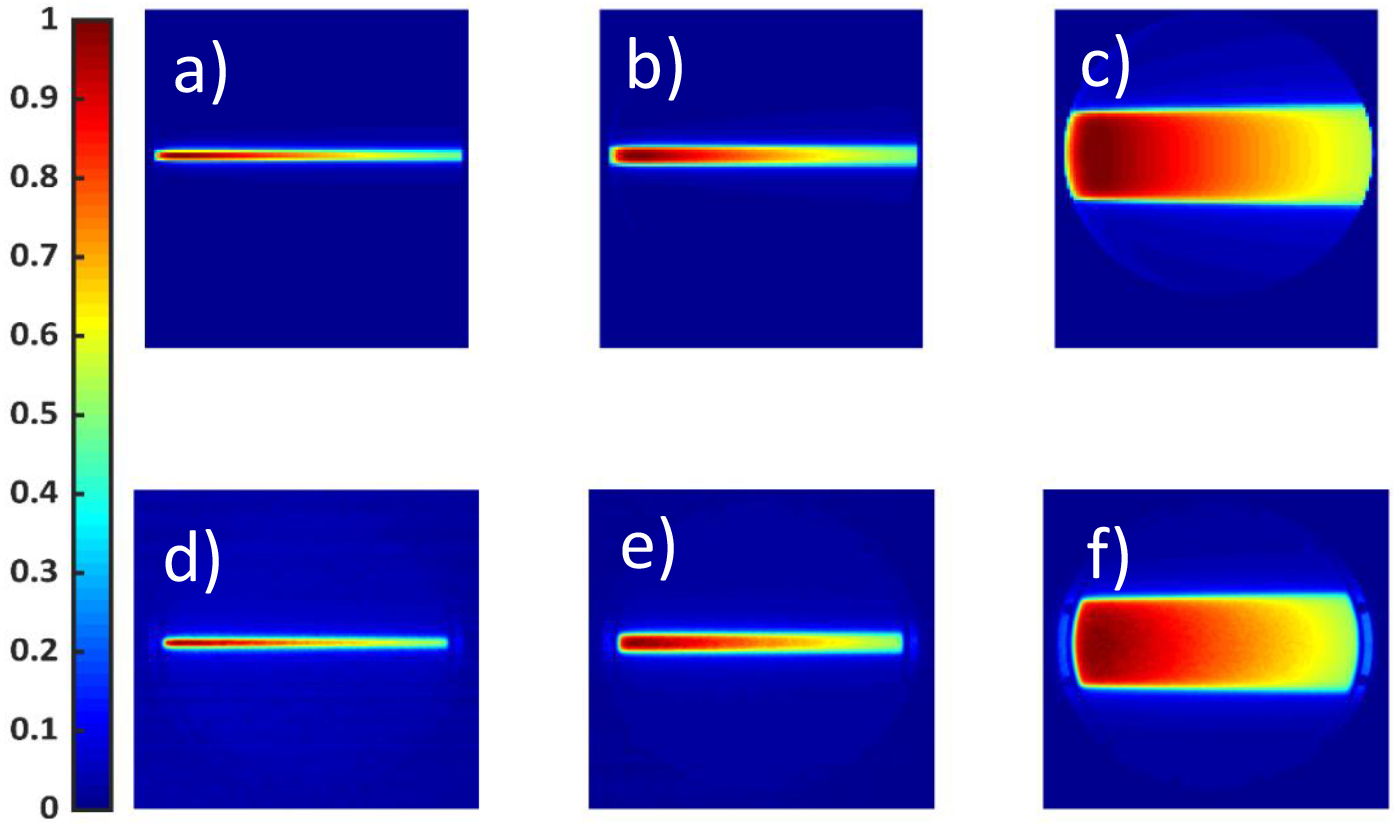
a), b) and c) show projected dose distributions obtained from the TPS for a 5mm,10mm,50mm square beam, respectively. A total of 500 Monitor Units, at 600MU/min for a 6MV beam, were delivered. d), e) and f) show the corresponding images captured using an intensified CMOS camera. Spatial and temporal filters were applied over the optical images. Both TPS and Optical Images are normalized to their maximum pixel value.
Figure 5:
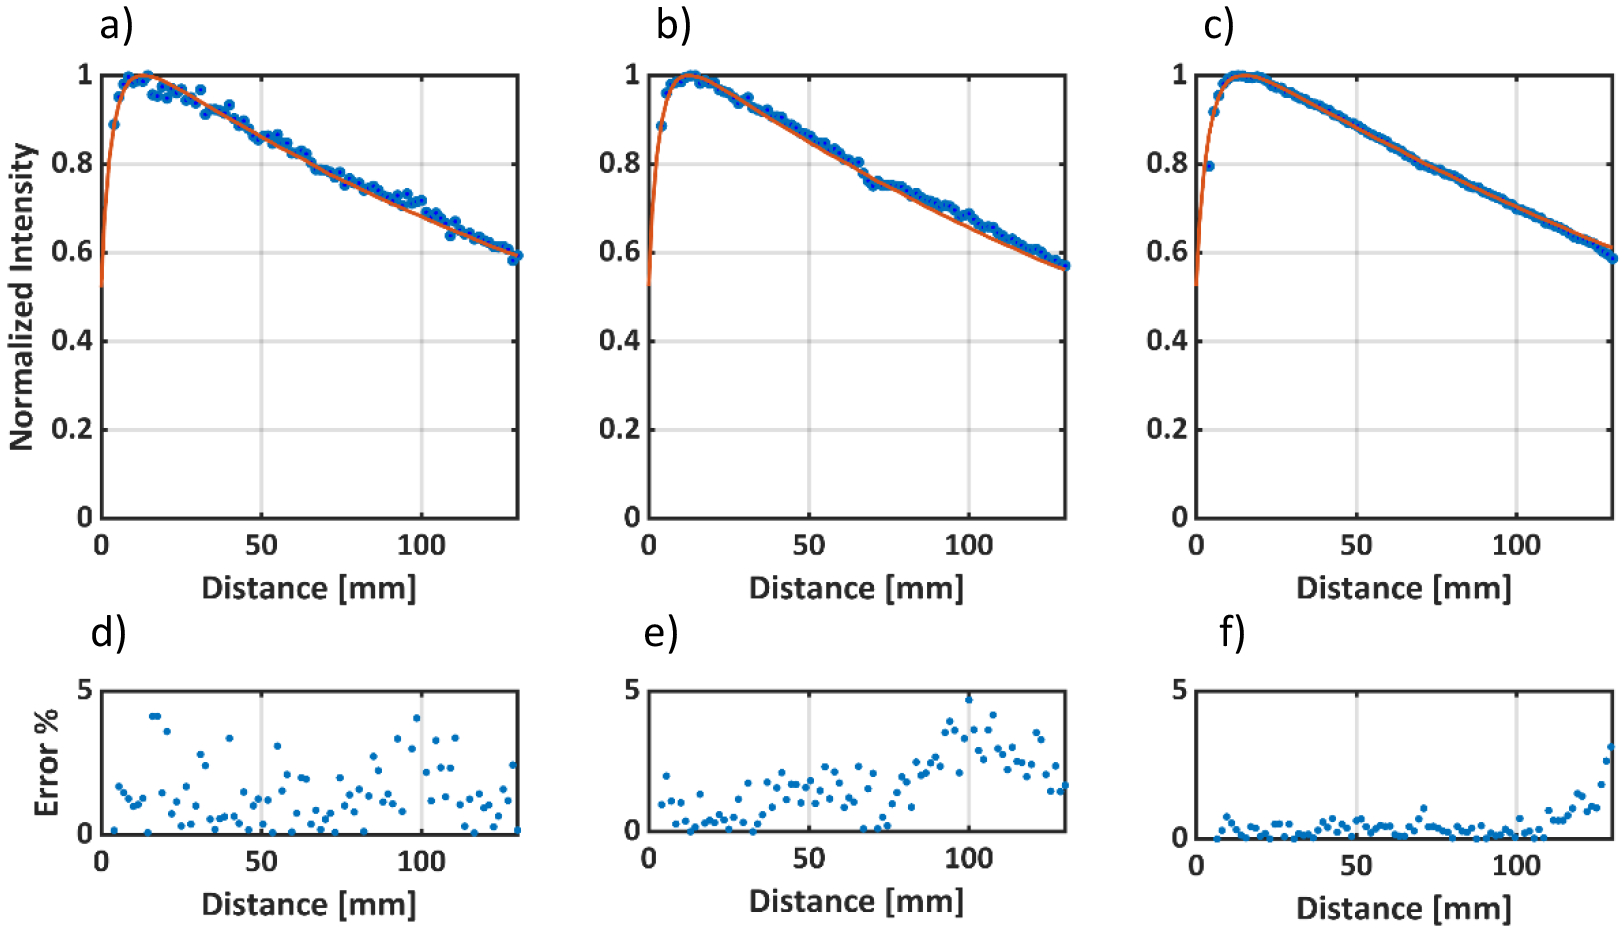
Percentage Depth Dose Curves normalized to Dmax for a) 5mm, b) 10mm and c) 50mm 6MV square beams. The solid red line represents the TPS data and the blue dots represent the optical data. d), e) and f) represent the percentage error between the TPS data and the optical data for the 5mm, 10mm and 50mm beams, respectively. The average error was the largest for the 5mm beam, but still within 1.5% average error.
Figure 5 a), b) and c) show pPDD’s for the 5 mm, 10 mm and 50 mm beam, respectively. Figure 5 d), e) and f) show percentage difference between Optical and the TPS data points. Beyond the buildup region, the average percentage differences between the TPS and Optical profiles for the 50 mm, 10 mm, 5 mm beam were 0.52%, 1.25% and 1.53% respectively. The average percentage difference increases with decreasing beam size. Noise tends to dominate for smaller beam size due to a proportionally lower optical signal. However, the average difference is still <2%, even for the smallest beam (5 mm).
Figure 6 a), b) and c) compare TPS and optical pCBPs at the depths of maximum dose for the 5mm, 10mm, 50mm beams, respectively. Figure 6 d), e) and f) show the corresponding 3%/1mm gamma index20 variation for the pCBP’s compared to the TPS projected reference data. Gamma index takes in to account the dose difference and distance to agreement (DTA) between the measured and reference dose distribution. The DTA criteria is incorporated to account for the steep dose gradients. Global normalization was used and the DTA criteria was chosen to be 1 mm, instead of the usual 3 mm, because of the steep gradient fall off in small fields. A gamma index of ≤1 for a pixel indicates that the given pixel is within the acceptable limits set by the gamma criteria (i.e 3%/1mm). All cross-beam profiles exhibited a 3%/1mm gamma passing rate of >99% i.e at least 99% of the pixels had a gamma index ≤1. The gamma index was seen to increase in the penumbra region but the average gamma value for all profiles was less than 0.5.
Figure 6:
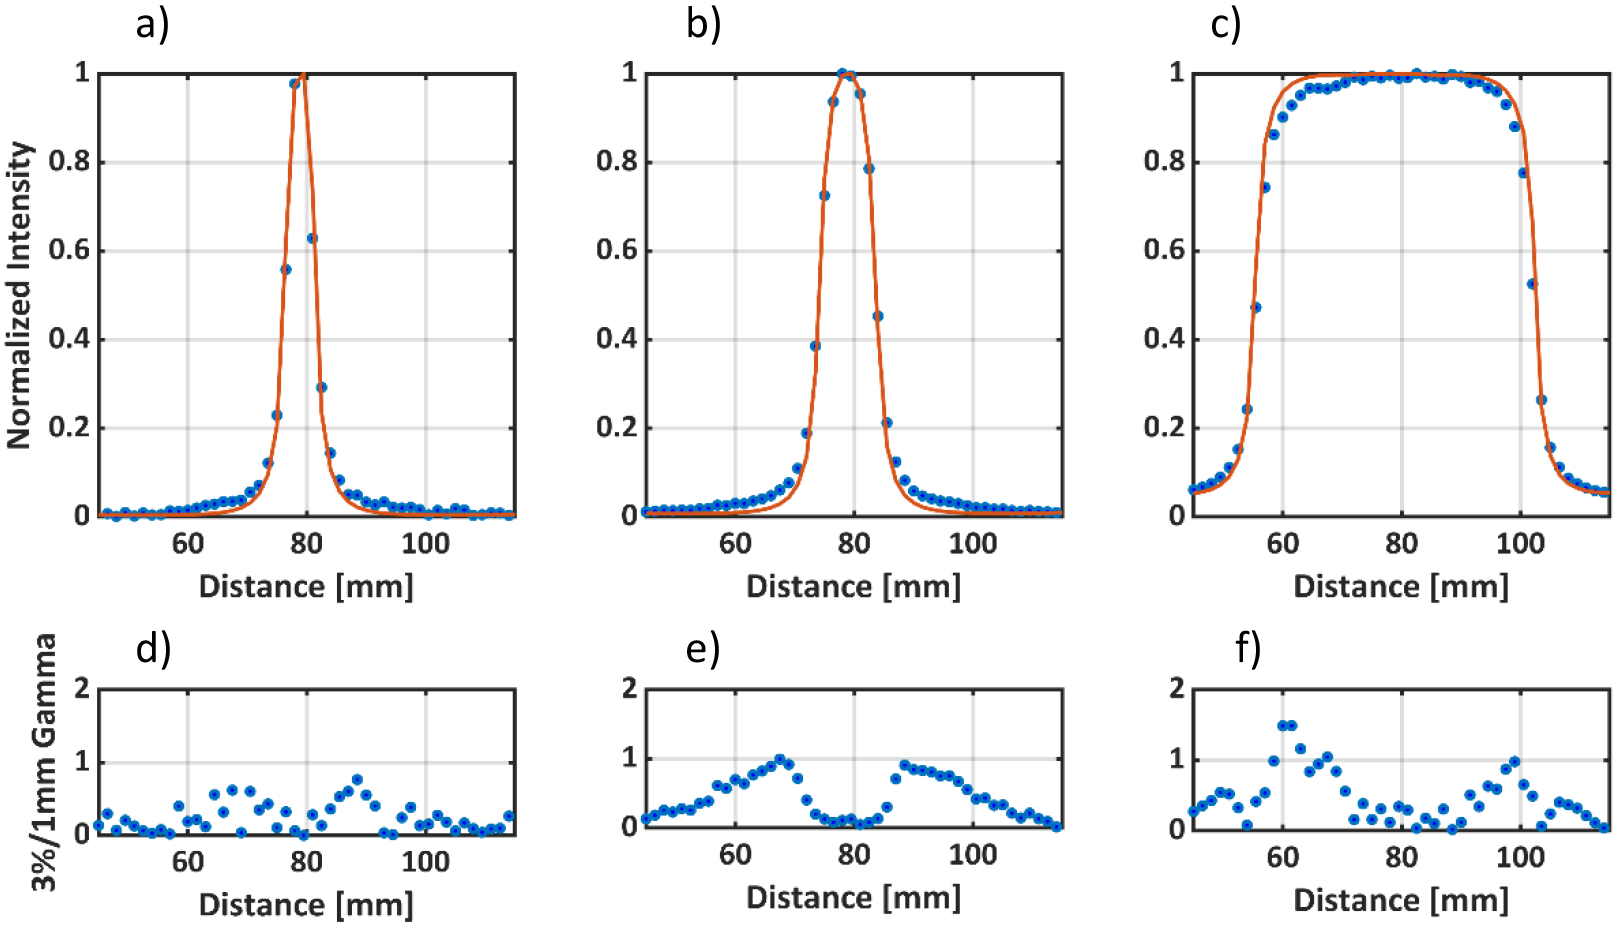
Cross Beam Profiles at Dmax for a) 5mm, b) 10mm and c) 50mm 6MV square beams. The solid red line represents the TPS data and the blue dots represent the optical data. d), e) and f) represents the 3%/1mm gamma criteria (global normalization) for the optical cross beam profiles for 5mm, 10mm, and 50mm beams respectively with the corresponding TPS data as the reference.
4. Dynamic Plans
Histograms for monitor units and average MLC opening per control point for the plans imaged in this study are shown in Figure 7. Highly modulated SRS plans deliver up to 60 MU per control point. However, the average MLC opening for each leaf pair in such plans is on the order ~ 5 mm. On the other end of the spectrum, head and neck and plans deliver around 2–3 MU per control point but have an average MLC opening of around 50 mm. The SRS plan had an avoidance angle, where no beam was delivered at certain control points. Those control points were excluded from the histogram. Based on this information, a static 5×5 mm2 beam was delivered to the water phantom with decreasing number of monitor units. A total of 200, 100,50, 20, 10 ,5 Monitor units were delivered with a 6 MV beam at a dose rate of 600 MU/min. Figure 8 shows the pPDD profiles extracted from the optical images versus the TPS data. The average percent difference for 5mm beams down to 50 MU was less than 3.5%. For 20, 10 and 5 MU, the average percent differences were 5.5±3%, 8.1±5% and 18.6±11%, respectively. All pPDD profiles were normalized to Dmax, except for 10 and 5 MU beams, where the optical profiles were normalized to ± 5 pixel values around the maximum pixel intensity value to account for the noisy data.
Figure 7:
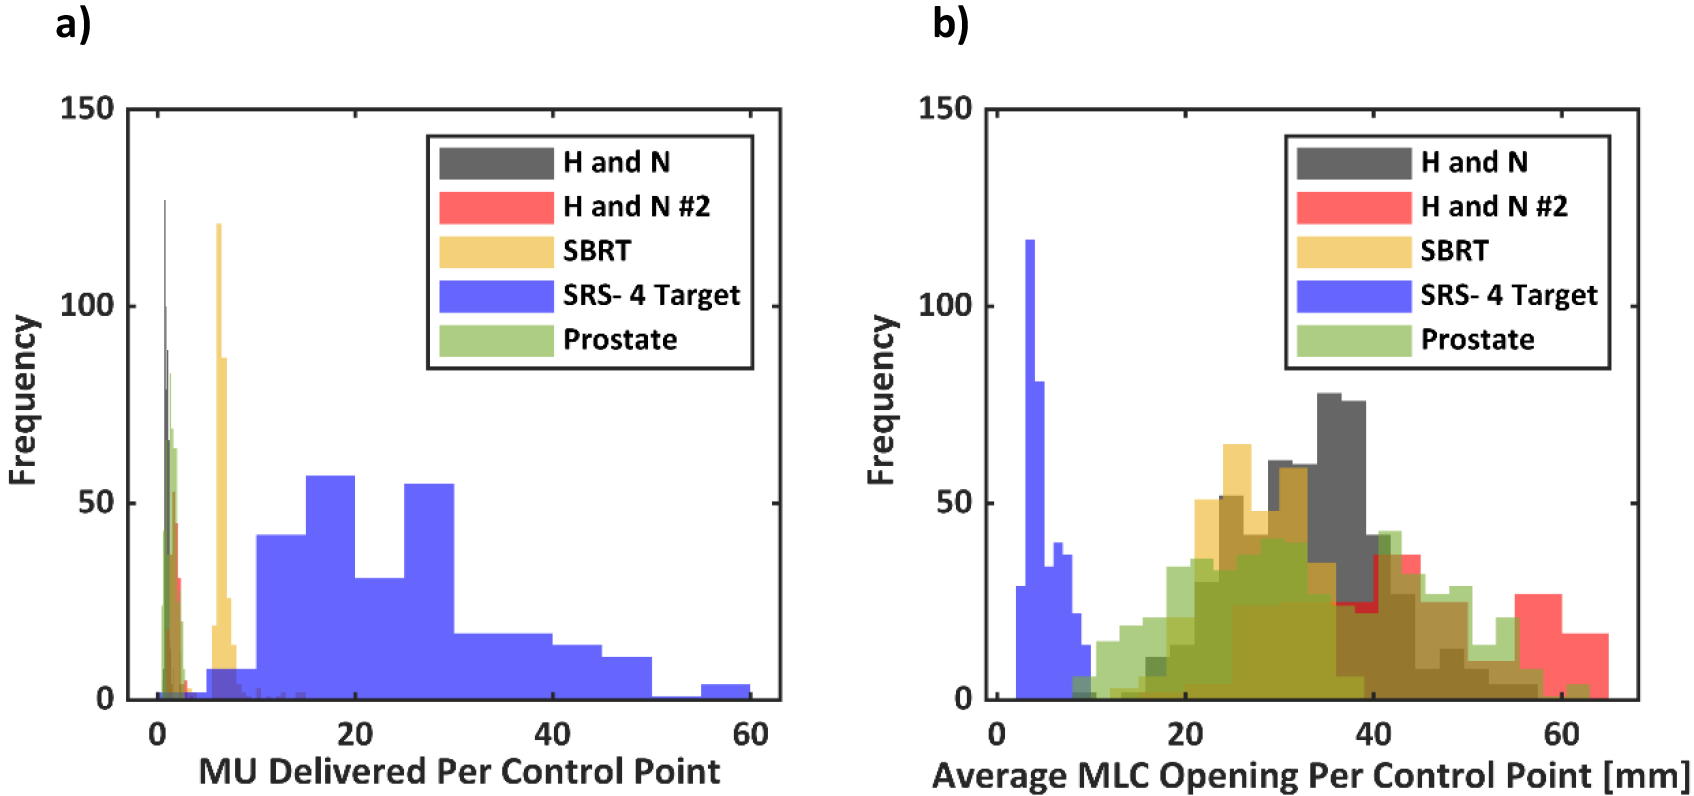
a) A histogram of monitor units delivered per control point and b) average MLC opening per control point for the dynamic plans imaged.
Figure 8.
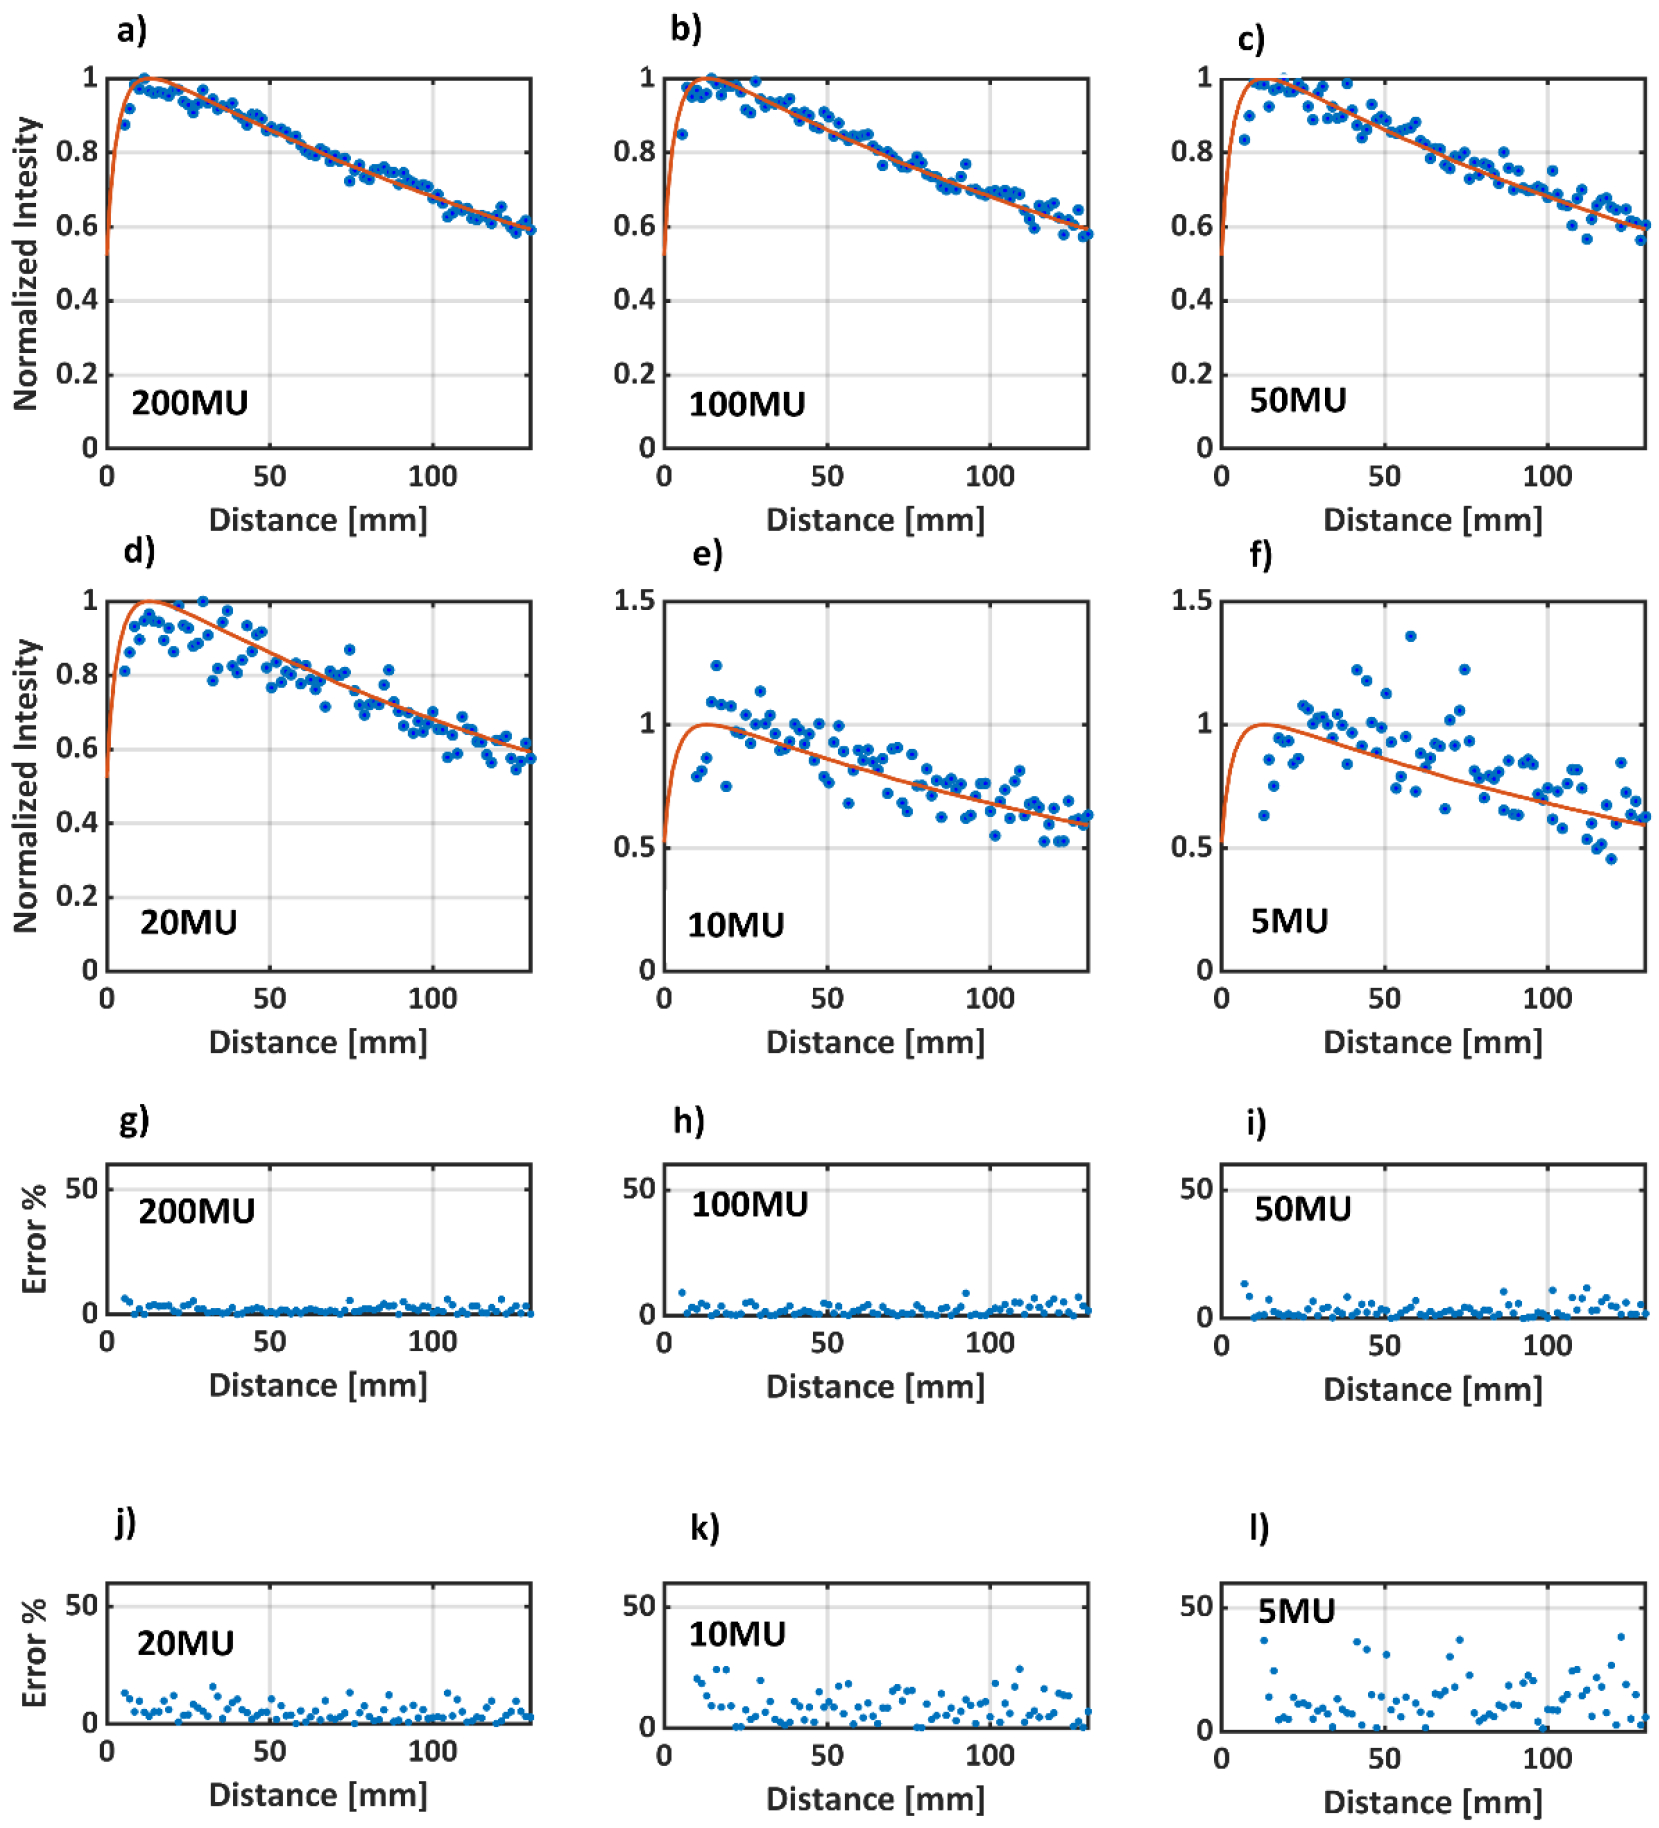
a) to e) pPDD profiles for a static 5 mm beam with 200, 100, 50,20,10,5 MU, respectively. The solid red line represents TPS data, whereas the blue dots are the optical data. Note that profiles a) to d) are normalized to pDmax, whereas e) and f) are normalized to average of the +/−5 pixels values around pDmax. g) to l) show the percentage error between TPS and optical data for 200, 100, 50,20,10,5 MUs, respectively. The average errors for the different number of MU’s are as follow:
200MU: 2.0±1%, 100MU:2.5±2%, 50MU:3.5±3%, 20MU:5.5±3%, 10MU:8.1±5%, 5MU:18.6±11%
The clinically approved VMAT plans were then delivered to the optical phantom and ArcCHECK. Optical images were sampled down to the TPS resolution (1.5 mm/pixel) and co-registered to the TPS images using a rigid 2D transformation in MATLAB. Both images were normalized to the maximum pixel intensity value. Gamma analysis was performed on the normalized, co-registered images. A criterion of 3%/3 mm was used along with a 10% dose threshold and global normalization. The results are presented in Figure 9, where each column corresponds to a different plan. The first row corresponds to the simulated TPS dose distribution. The second row shows the optical images. Since the plans were retrospective clinical plans, they had already passed the patient-specific QA at our institution. All 5 plans exhibited good passing rates with an average gamma value of < 0.5. Discrepancies were seen mostly in the low dose and high dose-gradient regions, especially in the SRS plan. Additionally, for the SRS plan a 4%/1.5mm criteria was also evaluated. The passing rate for the 4%/1.5 mm criteria was found to be 97.3%. Stricter DTA criterion might be used for radiosurgery plans, where dose localization is of more importance vs the dose delivered. Table 1 shows a side by side gamma pass rate comparison for both ArcCHECK and Optical imaging. Relative gamma was used for ArcCHECK as well. Both modalities agree well with each other.
Figure 9:
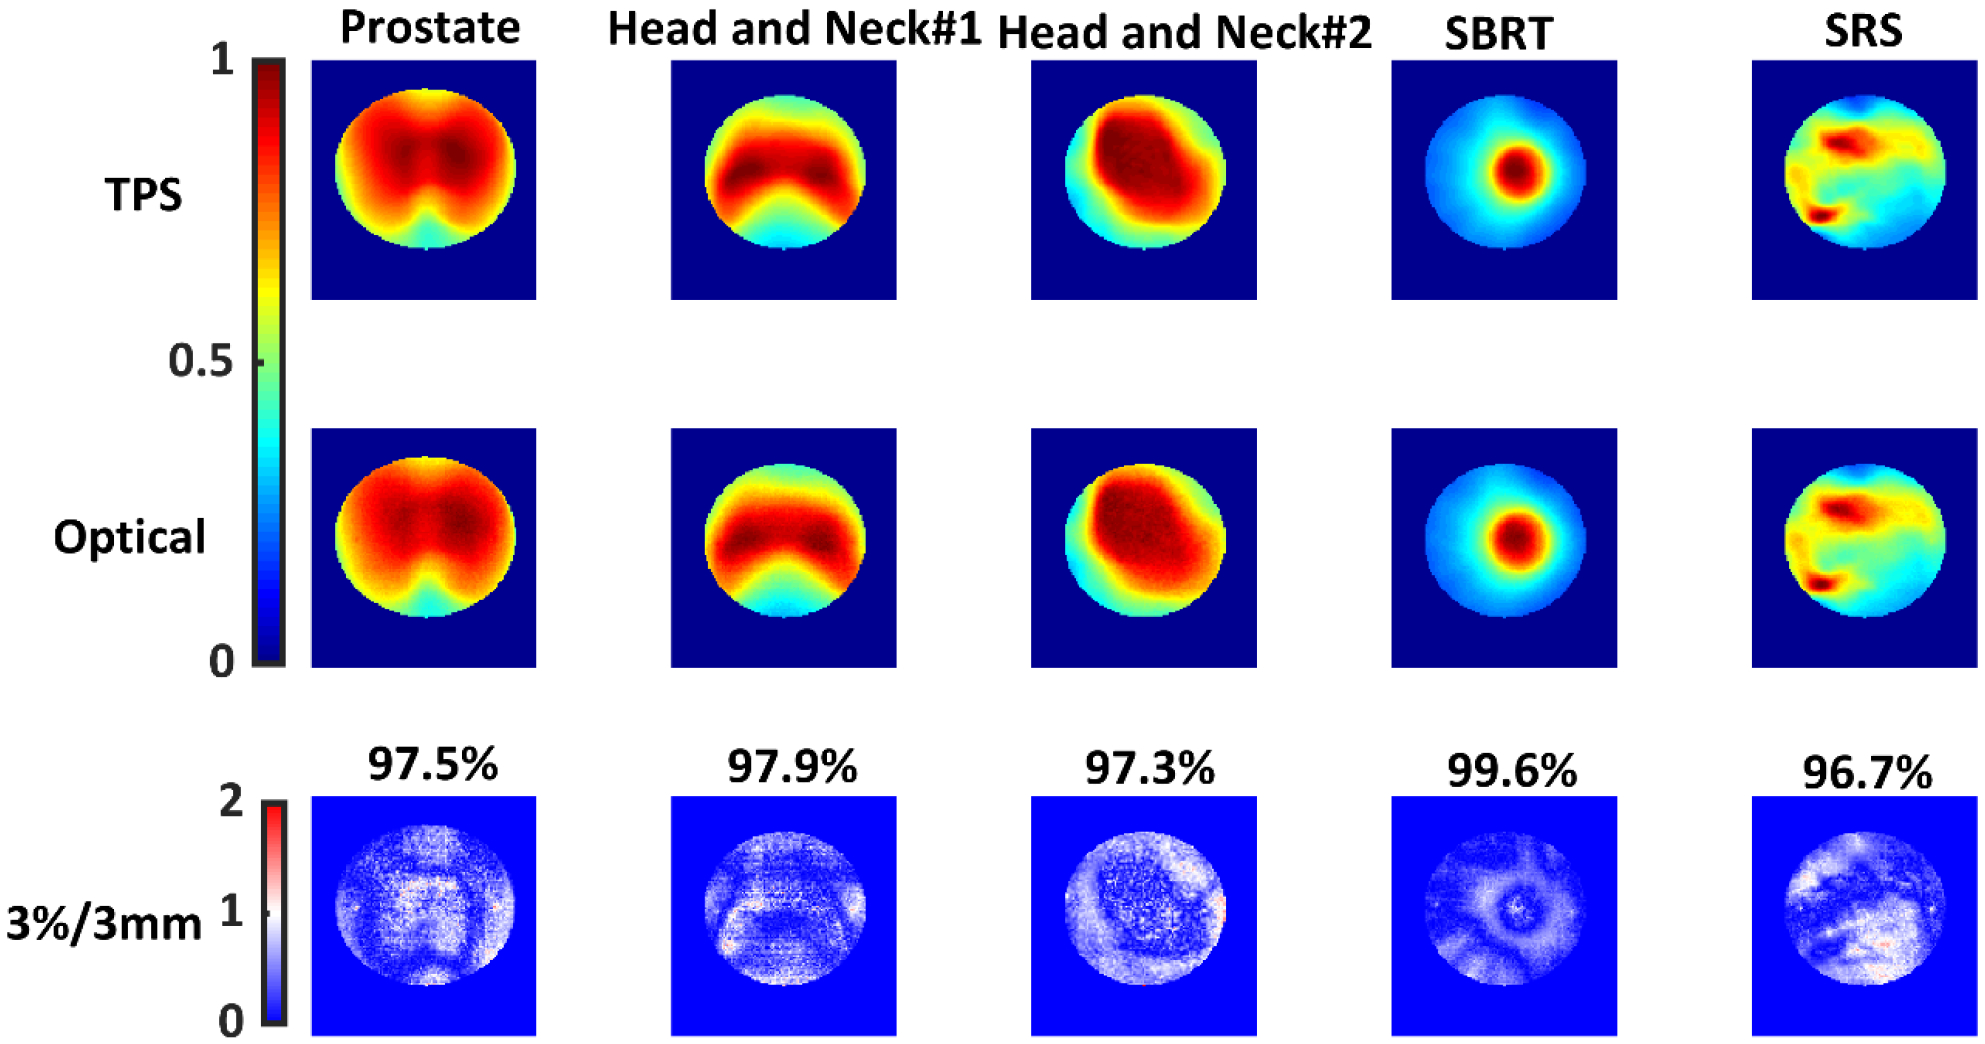
Each column represents a different VMAT plan. The first row shows the normalized cumulative projected doses from the TPS. The second row shows normalized optical images acquired using an intensified CMOS camera. The third row shows gamma index map with the passing rates for each plan. 3%/3 mm, 10% dose threshold, global normalization was used. TPS data was used as the reference dataset.
Table 1:
3%/3mm Gamma Index Passing Rates
| Plan | ArcCheck | Optical Imaging |
|---|---|---|
| Prostate | 96.9% | 97.5% |
| Head and Neck #1 | 100.0% | 97.9% |
| Head and Neck #2 | 96.8% | 97.3% |
| SBRT | 96.5% | 99.6% |
| SRS | 94.5% | 96.7% |
4.1. Sensitivity to Delivery Errors
Figure 10 a–e) show gamma index map variation with increasing MLC offset error. Rapid decrease in the 3%/3mm (global normalization and 10% threshold) gamma pass rates was seen for MLC errors. Figure 10 f–j) show the change in error with respect to increasing gantry angle error. The decrease in the gamma passing rate for gantry angular errors was not as rapid as MLC offset error, but still significant. In both cases, most of the pixels failing the 3%/3 mm criteria lie in the low dose region. The high dose region seems to not to be affected by these gross errors. The same sequence of plans, original and perturbed with MLC and gantry angle errors were delivered to ArcCheck. 3%/3 mm, global normalization, and a dose threshold of 10% was used in the ArcCheck software. Relative dose was used with every point normalized to maximum dose. This ensured a fair comparison between two modalities, since every pixel was normalized to the maximum pixel value in optical technique too. Moreover, ‘calc shift’ in the SNC patient software was applied to measured ArcCheck data to ensure optimal registration with the TPS data. The results are for this study are shown in Figure 11. Both ArcCheck and the optical technique were able to catch MLC and gantry errors. However, the optical technique was observed to be more sensitive to MLC errors. The gamma fall-off rate, beyond an error of 1°, was steeper for ArcCheck. For the optical technique, the gamma index falls off rapidly and then plateaus. For ArcCheck, an increase in gamma was seen at 1°, followed by a rapid fall off.
Figure 10.
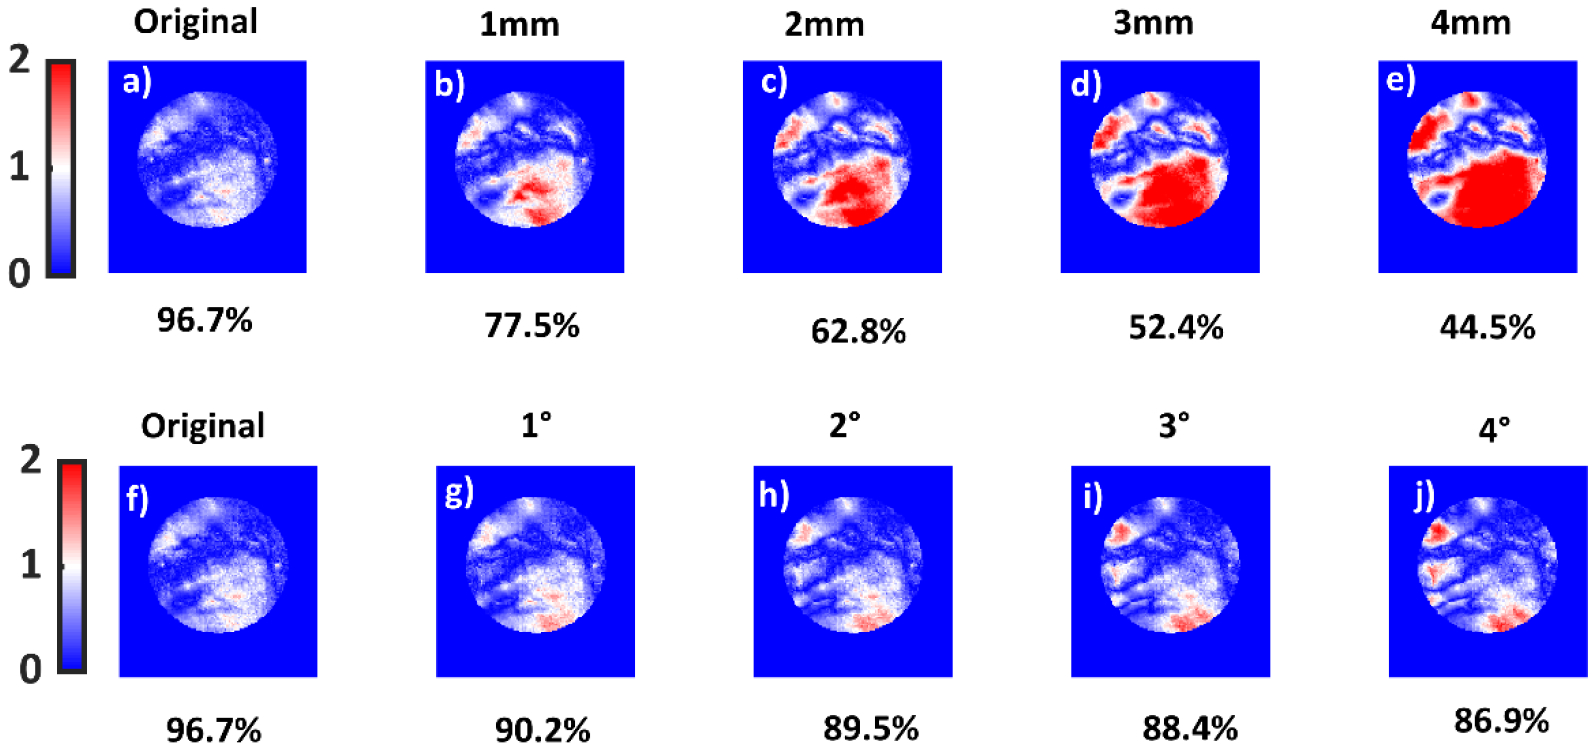
a), b), c), d) and e) show 3%/3mm gamma index variation and passing rates for the 4 lesion SRS plan with MLC offsets of 0mm,1mm,2mm,3mm and 4mm, respectively. The original SRS plan and the corresponding gamma pass rate is also shown in Figure 9, last column. f), g), h), i) and j) show gamma index for the same criteria but for gantry angle errors. f), g), h), i) and j) correspond to gantry angle errors of 0, 1, 3 and 4 degrees, respectively. TPS data were used as the reference dataset.
Figure 11.
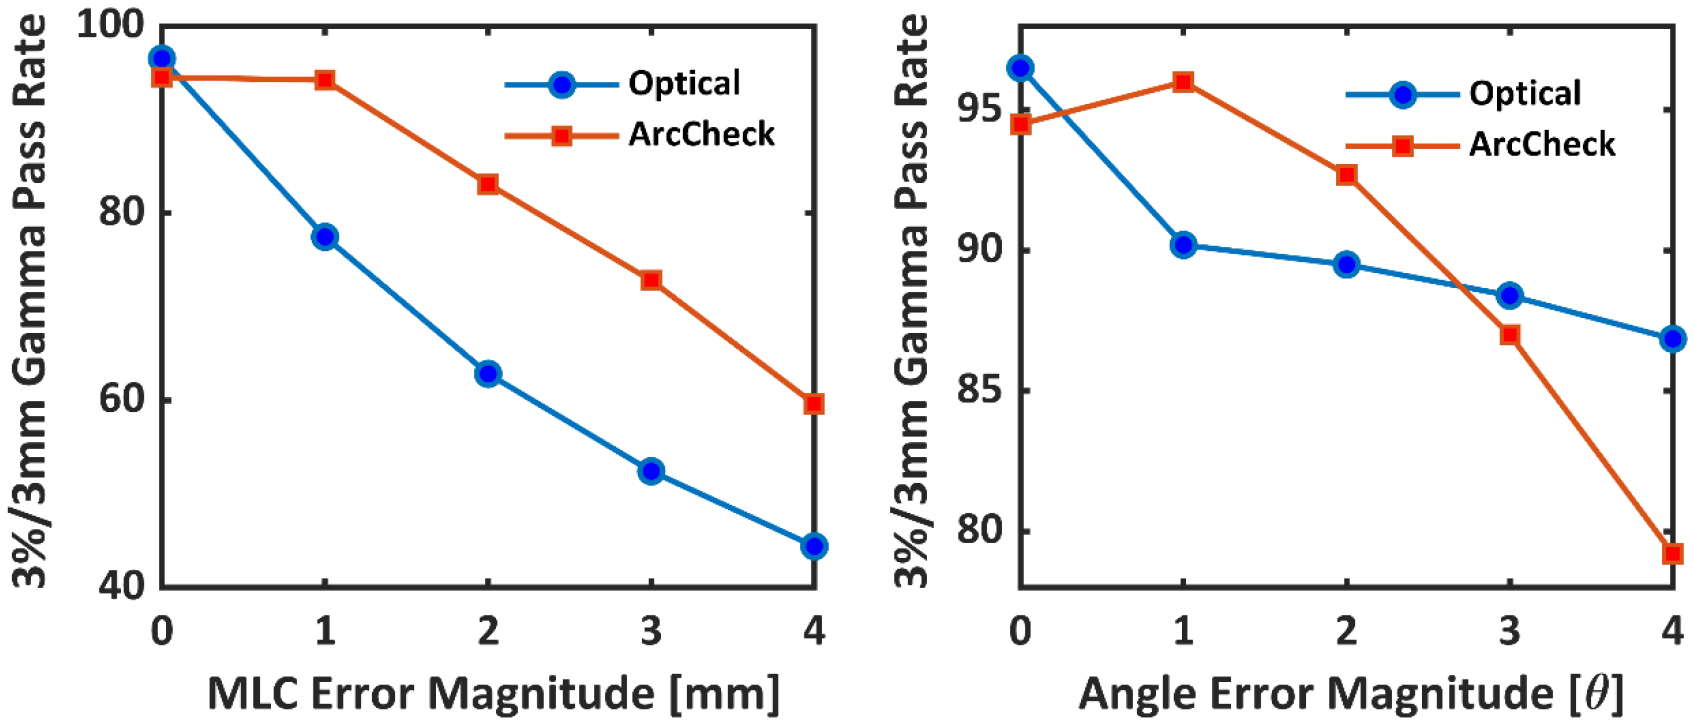
a) Optical and ArcCheck gamma pass rates (3%/3mm) for increasing magnitudes of MLC offset errors. b) Optical and ArcCheck gamma pass rates for increasing magnitudes of gantry angle errors.
3.4. Sensitivity to Overmodulation
The results for the over-modulated plan are shown in Figure 12. The global, 3%/3mm, 10% threshold gamma pass rate for optical imaging was 69.3.%. Good agreement between the TPS and the optical image was seen inside the target volume. However, many pixels failed in the low dose region. The same plan was then delivered to EPID and ArcCheck. The global 3%/3mm, 10% dose threshold gamma pass rate for EPID and ArcCheck were 75.1% and 100%, respectively.
Figure 12).

a) An over modulated dose distribution with a delivery of 4199 MU at 600cGy per fraction generated by the treatment planning system. b) The same plan delivered to a cylindrical water phantom. C) 3%/3mm global gamma variation map with the TPS image set as the reference. 40.8% of the pixels passed the criteria.
5. Discussion
5.1. Static Beam QA.
For the 6MV, 5mm beam and a total dose delivery of 500 MU, the average percentage difference in the projection depth dose curve, beyond the buildup region, was less than 1.6%. For the projected cross beam profiles, some disagreement was seen in the penumbra region. This blurring is expected due to camera system and optical scatter inside the phantom. Signal in the initial 6mm of the buildup region was lost due to the thick walls of the phantom and refractive index mismatch between phantom-air interface. The refractive index mismatch resulted in a spatial mismatch of 3 mm near the outer diameter of the water phantom. For the purpose of this study, the exterior wall of the phantom including 3 mm wide band of the outer diameter of the phantom were excluded from the image analysis. The parallax effect can be minimized by using a telecentric lens. Another solution to the perspective and refractive index mismatch problem was proposed by Robertson et al24.
5.2. Dynamic VMAT Plans.
Our technique was able to image a variety of VMAT and radiosurgery plans with varying degrees of modulation and target geometries. Five clinical plans were imaged, and all passed the 3%/3 mm gamma criteria. The same clinical plans were delivered to ArcCheck too. The gamma index criteria were kept constant for both modalities. Both techniques showed good agreement with each other in terms of the passing rate.
Crucially, with optical imaging, the variation of dose delivered with depth from the surface can be visualized. By providing a 2D map of gamma index in the patient’s geometry, one can figure out where exactly failures occur and the if the failing regions are going to result in clinically relevant errors. While in this work we focus on analysis of the projected 2D pattern, a 3D reconstruction approach can be utilized to enable 3D gamma and dose-volume histogram analysis.
Rigid registration was used to align the optical images with the TPS image as a reference, while keeping the registration parameters constant for each perturbed plan. However, such a method can act as a confounding variable due improper alignment and introduce systematic errors. In future iterations, optical fiducials or a beam that covers the whole extent of the phantom could be used to align the phantom to the TPS image.
Our results show that the technique can image a range of different VMAT plans with high signal-to-noise ratio. From highly modulated SRS plans to head and neck plans, good agreement was found between the TPS simulated dose and the optical images (average gamma pass rate of 97.8±2%). Most failing pixels were in high dose gradient and low dose areas. Even though quinine sulfate exhibits a large Stoke’s shift, (therefore it is expected to have minimal reabsorption and scatter inside the volume of the phantom), this effect is not fully eliminated and can cause dose blurring in high dose gradient areas. Moreover, some optical blurring is expected due to the point spread function of the camera. In future iterations, it is imperative that the imaging system is corrected for optical blurring.
The technique’s ability to image down to a single control point was also tested. We were able to image a 5 mm beam down to 20 MU; relative percentage difference of 5.5±3%, with the TPS. While SRS and SBRT plans have an average MLC leaf pair opening on the order of few millimeters, each control point is expected to contain field with way more than the limiting 20 MU level. On the other hand in Head and Neck plan delivery, 2–5 MU can be delivered per control point, with standard MLC opening greater than 10 mm. Therefore, despite the dependency of beam detectability on beam size and minimum MU, we demonstrated that the optical imaging-based dosimetric technique is a good candidate for patient specific QA for a wide variety of modalities.
A good QA technique should be able to detect errors during dose delivery. Patient specific QA tests are performed daily to assess if the plan is deliverable and if the MLC log files and other instructions are properly transferred from the TPS over to the Linac. To assess the technique’s sensitivity to delivery errors, deliberate errors were induced in one of the clinical SRS plans. An offset error in MLC might seem like a gross and a superficial error. However, studies in past have shown that errors as small as 0.5 mm can have clinical repercussions25. Moreover, AAPM TG 14210 has reported that leaf position repeatability should be with in ±1 mm. Thus, it’s paramount that such an error be caught in a patient specific QA test. Moreover, the nature of error chosen in this paper was a constant offset. Random errors could have been used; however, Oliver et al.26 have shown that systematic open/MLC errors tend to have a greater effect on clinical dose as opposed to random errors. In addition to MLC errors, gantry angle errors were also added per control point. For gantry angle, a periodic error function was used. As Liang et al23. point out in their publication, gantry angles are usually only checked daily at static angles (i.e 0° and 180°), but not dynamically. Thus, a periodic function can mimic gantry angle errors during VMAT delivery caused due to gravity. Gantry angle errors were also noted to occur frequently in radiotherapy clinics.27
For both type of errors, our technique was able to detect small offsets (1mm and 1°). For MLC errors, our technique was more sensitive than a 2.5D cylindrical diode array, most likely due to the improved sampling resolution. The diode array was not able to detect a 1 mm MLC offset, confirming the previous work of Vieillevigne et al25. Liang et al. report that gantry angle errors of 1° (sinusoidal error function) go undetected by ArcCHECK. We saw similar results in our study. Both techniques exhibited a less steep gamma fall off for gantry angle vs MLC errors. This can be explained by the fact that two different errors forms were used for gantry and MLC errors.
The baseline plan used in this study was the complex 4-lesion SRS plan. SRS plans require an even greater accuracy in MLC leaf position to achieve a steep dose gradient. Thus, it is critical that such errors are caught for SRS plans. However, it should be mentioned here that the perturbed dose distribution and subsequent drop in gamma pass rates with increasing magnitude of error depends highly on the type of baseline plan. A similar analysis was carried out on a head and neck plan. The gamma index fall-off for both gantry angle and MLC error were not as steep as the SRS plan. This can be explained by the fact that most dose discrepancies in the SRS plan occurred in the low dose and high dose-gradient regions. On the other hand, a head and neck plan results in a more homogenous dose distribution with fewer low dose regions inside the water phantom. For such plans, one can look at how the average gamma value varies with increasing magnitude of error.
The technique’s ability to detect overly complex and modulated plans was also tested. As dose conformity increases, complex small beamlets and a higher number of MU are needed to deliver the prescription dose. In some cases, a Linac might not be able to keep up with MLC movement speed required to achieve complex apertures. This might lead to erroneous delivery of the prescribed plan, making organs at risk susceptible to over-dosing. Thus, it is paramount that such errors be detected in patient specific quality assurance tests. A highly modulated plan was mocked up in the TPS and the plan was delivered to the water phantom, EPID and ArcCheck. The plan failed the 3%/3 mm gamma criteria for both EPID and Optical Imaging with a passing rate of 75% and 69.3%., respectively. Most of the failing regions were in the low dose regions for both EPID and the water phantom. Whereas, inside the target volume, there was good agreement between simulated and measured dose for both EPID and optical imaging. This indicates that most of the failing pixels were due to a steep dose gradient and leakage from the MLC. ArcCHECK, on the other hand, exhibited a 100% pass rate. This may be attributed to the coarse resolution of ArcCHECK. The helical diode array with a 1cm spacing between diodes was not able to detect the transient leakage radiation and thus exhibited a 100% pass rate.
To overcome the technique’s limitation of 2D projected dose compression, a three-dimensional reconstruction of beams can be realized21 using additional beam’s eye view information. With this capability, one can potentially validate central axis depth dose profiles, off axis ratios (OAR) and output factors for small beams precisely without suffering from volume averaging artifacts. Moreover, there has been a recent shift in radiotherapy to move from gamma analysis to DVH- based metrics. Keeping in line with this trend, our future work will build on moving towards clinically relevant errors and DVH based metrics.
6. Conclusion.
Optical imaging provides high resolution, real-time view of static beams and dynamic plans. The technique can provide 2D projected, cumulative dose distribution of IMRT and VMAT plans with varying degrees of modulation. The ability to image 5 mm beams down to 20 MU potentially allows us to capture data per single control point with high sensitivity as compared to current methods. For SRS plans, the technique is more sensitive to small offset errors in gantry angles (1°) and MLC leaf positions (1 mm) compared to a standard helical diode array.
7. Acknowledgements
This work has been sponsored by National Institutes of Health research grants R44 CA199681, R01 EB023909, R01 EB024498, and P30 CA 23108.
7. References.
- 1.Otto K Volumetric modulated arc therapy: IMRT in a single gantry arc. Med Phys. 2007;35(1):310–317. doi: 10.1118/1.2818738 [DOI] [PubMed] [Google Scholar]; Teoh M, Clark C, Wood K, Whitaker S and Nisbet A (2011). Volumetric modulated arc therapy: a review of current literature and clinical use in practice. The British Journal of Radiology, 84(1007), pp.967–996. [DOI] [PMC free article] [PubMed] [Google Scholar]
- 2.Teoh M, Clark C, Wood K, Whitaker S, Nisbet A. Volumetric modulated arc therapy: a review of current literature and clinical use in practice. Br J Radiol. 2011;84(1007):967–996. doi: 10.1259/bjr/22373346 [DOI] [PMC free article] [PubMed] [Google Scholar]
- 3.Davis J, Medbery C, Sharma S et al. Stereotactic body radiotherapy for centrally located early-stage non-small cell lung cancer or lung metastases from the RSSearch® patient registry. Radiation Oncology. 2015;10(1). doi: 10.1186/s13014-015-0417-5 [DOI] [PMC free article] [PubMed] [Google Scholar]
- 4.Aoyama H, Shirato H, Tago M et al. Stereotactic Radiosurgery Plus Whole-Brain Radiation Therapy vs Stereotactic Radiosurgery Alone for Treatment of Brain Metastases. JAMA. 2006;295(21):2483. doi: 10.1001/jama.295.21.2483 [DOI] [PubMed] [Google Scholar]
- 5.Das I, Ding G, Ahnesjö A. Small fields: Nonequilibrium radiation dosimetry. Med Phys. 2007;35(1):206–215. doi: 10.1118/1.2815356 [DOI] [PubMed] [Google Scholar]
- 6.Sauer O, Wilbert J. Measurement of output factors for small photon beams. Med Phys. 2007;34(6Part1):1983–1988. doi: 10.1118/1.2734383 [DOI] [PubMed] [Google Scholar]
- 7.Beddar A, Mason D, O’Brien P. Absorbed dose perturbation caused by diodes for small field photon dosimetry. Med Phys. 1994;21(7):1075–1079. doi: 10.1118/1.597350 [DOI] [PubMed] [Google Scholar]
- 8.Laub W, Wong T. The volume effect of detectors in the dosimetry of small fields used in IMRT. Med Phys. 2003;30(3):341–347. doi: 10.1118/1.1544678 [DOI] [PubMed] [Google Scholar]
- 9.Derreumaux S, Etard C, Huet C et al. Lessons from recent accidents in radiation therapy in France. Radiat Prot Dosimetry. 2008;131(1):130–135. doi: 10.1093/rpd/ncn235 [DOI] [PubMed] [Google Scholar]
- 10.Klein E, Hanley J, Bayouth J et al. Task Group 142 report: Quality assurance of medical accelerators). Med Phys. 2009;36(9Part1):4197–4212. doi: 10.1118/1.3190392 [DOI] [PubMed] [Google Scholar]
- 11.Low D, Parikh P, Dempsey J, Wahab S, Huq S. Ionization chamber volume averaging effects in dynamic intensity modulated radiation therapy beams. Med Phys. 2003;30(7):1706–1711. doi: 10.1118/1.1582558 [DOI] [PubMed] [Google Scholar]
- 12.Ju S, Ahn Y, Huh S, Yeo I. Film dosimetry for intensity modulated radiation therapy: Dosimetric evaluation. Med Phys. 2002;29(3):351–355. doi: 10.1118/1.1449493 [DOI] [PubMed] [Google Scholar]
- 13.Maryanski M, Ibbott G, Eastman P, Schulz R, Gore J. Radiation therapy dosimetry using magnetic resonance imaging of polymer gels. Med Phys. 1996;23(5):699–705. doi: 10.1118/1.597717 [DOI] [PubMed] [Google Scholar]
- 14.De Deene Y, Jirasek A. Uncertainty in 3D gel dosimetry. Journal of Physics: Conference Series. 2015;573:012008. doi: 10.1088/1742-6596/573/1/012008 [DOI] [Google Scholar]
- 15.van Elmpt W, McDermott L, Nijsten S, Wendling M, Lambin P, Mijnheer B. A literature review of electronic portal imaging for radiotherapy dosimetry. Radiotherapy and Oncology. 2008;88(3):289–309. doi: 10.1016/j.radonc.2008.07.008 [DOI] [PubMed] [Google Scholar]
- 16.Glaser A, Davis S, Voigt W, Zhang R, Pogue B, Gladstone D. Projection imaging of photon beams using Čerenkov-excited fluorescence. Phys Med Biol. 2013;58(3):601–619. doi: 10.1088/0031-9155/58/3/601 [DOI] [PMC free article] [PubMed] [Google Scholar]
- 17.Goulet M, Rilling M, Gingras L, Beddar S, Beaulieu L, Archambault L. Novel, full 3D scintillation dosimetry using a static plenoptic camera. Med Phys. 2014;41(8Part1):082101. doi: 10.1118/1.4884036 [DOI] [PMC free article] [PubMed] [Google Scholar]
- 18.Čerenkov P Visible Radiation Produced by Electrons Moving in a Medium with Velocities Exceeding that of Light. Physical Review. 1937;52(4):378–379. doi: 10.1103/physrev.52.378 [DOI] [Google Scholar]
- 19.Andreozzi J, Mooney K, Brůža P et al. Remote Cherenkov imaging-based quality assurance of a magnetic resonance image-guided radiotherapy system. Med Phys. 2018;45(6):2647–2659. doi: 10.1002/mp.12919 [DOI] [PubMed] [Google Scholar]
- 20.Low D, Harms W, Mutic S, Purdy J. A technique for the quantitative evaluation of dose distributions. Med Phys. 1998;25(5):656–661. doi: 10.1118/1.598248 [DOI] [PubMed] [Google Scholar]
- 21.Bruza P, Andreozzi J, Gladstone D, Jarvis L, Rottmann J, Pogue B. Online Combination of EPID & Cherenkov Imaging for 3-D Dosimetry in a Liquid Phantom. IEEE Trans Med Imaging. 2017;36(10):2099–2103. doi: 10.1109/tmi.2017.2717800 [DOI] [PMC free article] [PubMed] [Google Scholar]
- 22.Ashraf M, Bruza P, Krishnaswamy V, Gladstone D, Pogue B. Technical Note: Time‐gating to medical linear accelerator pulses: Stray radiation detector. Med Phys. 2018. doi: 10.1002/mp.13311 [DOI] [PMC free article] [PubMed] [Google Scholar]
- 23.Liang B, Liu B, Zhou F, Yin F, Wu Q. Comparisons of volumetric modulated arc therapy (VMAT) quality assurance (QA) systems: sensitivity analysis to machine errors. Radiation Oncology. 2016;11(1). doi: 10.1186/s13014-016-0725-4 [DOI] [PMC free article] [PubMed] [Google Scholar]
- 24.Robertson D, Hui C, Archambault L, Mohan R, Beddar S. Optical artefact characterization and correction in volumetric scintillation dosimetry. Phys Med Biol. 2013;59(1):23–42. doi: 10.1088/0031-9155/59/1/23 [DOI] [PMC free article] [PubMed] [Google Scholar]
- 25.Vieillevigne L, Molinier J, Brun T, Ferrand R. Gamma index comparison of three VMAT QA systems and evaluation of their sensitivity to delivery errors. [DOI] [PubMed]
- 26.Oliver M, Gagne I, Bush K, Zavgorodni S, Ansbacher W, Beckham W. Clinical significance of multi-leaf collimator positional errors for volumetric modulated arc therapy. Radiotherapy and Oncology. 2010;97(3):554–560. doi: 10.1016/j.radonc.2010.06.013 [DOI] [PubMed] [Google Scholar]
- 27.Klein E, Drzymala R, Purdy J, Michalski J. Errors in radiation oncology: A study in pathways and dosimetric impact. J Appl Clin Med Phys. 2005;6(3):81–94. doi: 10.1120/jacmp.v6i3.2105 [DOI] [PMC free article] [PubMed] [Google Scholar]


