

Abstract
Advancing age is associated with both declines in episodic memory and degradation of medial temporal lobe (MTL) structure. The contribution of MTL to episodic memory is complex and depends upon the interplay among hippocampal subfields and surrounding structures that participate in anatomical connectivity to the cortex through inputs (parahippocampal and entorhinal cortices) and outputs (fornix). However, the differential contributions of MTL system components in mediating age effects on memory remain unclear. In a sample of 177 healthy individuals aged 20–94 we collected high-resolution T1-weighted, ultrahigh-resolution T2/PD, and diffusion tensor imaging (DTI) MRI sequences on a 3T Phillips Achieva scanner. Hippocampal subfield and entorhinal cortex (ERC) volumes were measured from T2/PD scans using a combination of manual tracings and training of a semiautomated pipeline. Parahippocampal gyrus volume was estimated using Freesurfer and DTI scans were used to obtain diffusion metrics from tractography of the fornix. Item and associative episodic memory constructs were formed from multiple tests. Competing structural equation models estimating differential association among these structural variables were specified and tested to investigate whether how fornix diffusion and volume of parahippocampal gyrus, ERC, and hippocampal subfields mediate age effects on associative and/or item memory. The most parsimonious, best-fitting model included an anatomically based path through the MTL as well as a single hippocampal construct which combined all subfields. Results indicated that fornix microstructure independently mediated the effect of age on associative memory, but not item memory. Additionally, all regions and estimated paths (including fornix) combined to significantly mediate the age-associative memory relationship. These findings suggest that preservation of fornix connectivity and MTL structure with aging is important for maintenance of associative memory performance across the lifespan.
Keywords: aging, episodic memory, fornix diffusion, hippocampal subfields, structural equation modeling
1 |. INTRODUCTION
The hippocampus is thought to support episodic memory through both internal function of hippocampal subfields (Marr, 1971; O’Reilly, Bhattacharyya, Howard, & Ketz, 2011; Rolls, 2016; Yassa & Stark, 2011), and through its anatomical connectivity with the rest of the brain, namely through input by the parahippocampal and entorhinal cortices, and output by the fimbria and fornix (Duvernoy, Cattin, & Risold, 2013). In particular, the hippocampus is critical in supporting the creation of episodic memories that rely on the encoding and retrieval of associations (Eichenbaum, Yonelinas, & Ranganath, 2007; Squire, Stark, & Clark, 2004; Wang, Daselaar, & Cabeza, 2017). Performance on tests of episodic memory is consistently found to decline with age in both cross-sectional and longitudinal studies (Brickman & Stern, 2009; Nyberg, Lövdén, Riklund, Lindenberger, & Bäckman, 2012; Park & Reuter-Lorenz, 2009; Tromp, Dufour, Lithfous, Pebayle, & Després, 2015), with an emphasis on declines in associative memory as compared to memory for individual items (Chalfonte & Johnson, 1996; Naveh-Benjamin, 2000; Old & Naveh-Benjamin, 2008; Spencer & Raz, 1995). To date, reported associations between an individual’s age, hippocampal structure and connectivity, and memory performance have been mixed, and relatively few studies assessed these relationships in large lifespan samples (for review see de Flores, La Joie, & Chételat, 2015; Wang et al., 2017). Thus, the aims of the current study are to investigate both the nature of the associations among these variables as well as to test whether specific anatomical connectivity through hippocampal input, hippocampal subfields, and hippocampal output best explain the relationships.
1.1 |. Medial temporal lobe structures support episodic memory
It has been well established that the hippocampus is critical for the encoding and retrieval of episodic memories (Scoville & Milner, 1957; Squire et al., 2004). The hippocampus is thought to support the rapid formation of episodic memories through functional specialization of hippocampal subfields including the subiculum, cornu ammonis (CA) fields 1–4, and the dentate gyrus (DG; Rolls, 2016; Yassa & Stark, 2011). Subfield-specific processing is thought to allow for information from cortical association areas to be encoded and retrieved despite the fact that the current environment may be extremely similar or dissimilar to previously encountered environments (O’Reilly et al., 2011). Hippocampal subfields form a tri-synaptic loop in which DG engages in sparse firing to prevent catastrophic interference between similar episodes; recurrent collaterals in CA3 support the generalization of incomplete information; and CA1 and subiculum support the formation of a stable representation that can be reactivated in the cortex (Marr, 1971; McClelland, McNaughton, & O’Reilly, 1995; O’Reilly et al., 2011; Rolls, 2016; Yassa & Stark, 2011). While subfield-specific processing is critical to the successful formation and retrieval of memories, connections among the hippocampus proper and the rest of the cortex are equally critical.
The parahippocampal and entorhinal cortices, primary inputs to the hippocampus, receive much of their input from the occipital cortex, temporal cortex, and posterior parietal association cortex (Duvernoy et al., 2013). The hippocampus is therefore situated in such a way that its input is a combination of processed sensory-level information. The primary outputs of the hippocampus are the fimbria and fornix, which synapse on the mammillary bodies and anterior nucleus of the thalamus before continuing to the anterior and posterior cingulate, retrosplenial cortex, temporal pole, and prefrontal cortex (Douet & Chang, 2015; Duvernoy et al., 2013). Importantly, it is thought that the hippocampus encodes activation patterns occurring throughout the cortex, and at retrieval is able to reinstate these patterns of cortical activation to reactivate a previously encoded episode (Damasio, 1989; Rugg, Johnson, Park, & Uncapher, 2008). Therefore, the combination of intrahippocampal processing and connectivity with the rest of the cortex through the parahippocampal, entorhinal cortices, and fornix act together to allow for robust and multimodal long term memories.
1.2 |. Effect of aging on medial temporal lobe structures
Healthy aging is associated with a variety of changes to the brain’s structure, including both gray and white matter changes, most often indexed by volume and diffusion, respectively (Bennett & Madden, 2014; Bennett, Madden, Vaidya, Howard, & Howard, 2010; de Flores, La Joie, et al., 2015; Kennedy & Raz, 2015; Madden et al., 2012; Wang et al., 2017). While some volumetric and diffusion differences measured across the lifespan likely represent normal maturation (e.g., synaptic pruning or a reduction in synaptic density; Lister & Barnes, 2009), it is also apparent that smaller volumes and altered diffusion in adulthood can be linked to detrimental changes in brain structure (Douet & Chang, 2015; Dubois et al., 2016; Jack et al., 2010, 2016; Kantarci, 2014).
In studies of healthy aging, an inconsistent pattern of age-related differences in hippocampal subfield volume has been reported (for review see de Flores, La Joie, et al., 2015). Cornu ammonis 1 appears to show the most robust decline; however, it is likely that all subfields exhibit some reduction in volume with aging, as reports of age-related volume reduction in each subfield can be found across the literature (de Flores, La Joie, et al., 2015). Relatedly, there are relatively few studies including large lifespan samples (de Flores, La Joie, Landeau, et al., 2015; Mueller & Weiner, 2009; Raz, Daugherty, Bender, Dahle, & Land, 2015; Yang, Goh, Chen, & Qiu, 2013; Ziegler et al., 2012) and the results from these studies are similarly inconsistent. Despite the disparate findings in reported patterns of age-related subfield differences, entorhinal cortex (ERC) is thought to exhibit small declines and potentially remain stable in volume across adulthood (Raz et al., 2005; Raz, Rodrigue, Head, Kennedy, & Acker, 2004; Rodrigue & Raz, 2004) except in populations exhibiting symptoms of Alzheimer’s disease (de Flores, La Joie, & Chételat, 2015; Dickerson et al., 2009). More consistent age-related decreases in volume have been found when investigating the parahippocampal cortex and the hippocampus as a whole (Gorbach et al., 2017; Henson et al., 2016; Kennedy et al., 2009; Kennedy & Raz, 2015; Nyberg et al., 2012; Pelletier et al., 2013; Persson et al., 2012; Raz et al., 2004), and along with the mixed findings in the subfield literature, again suggests a likely decrease across both components.
As measures of white matter structure, several metrics can be derived from diffusion tensor images (DTI) (i.e., fractional anisotropy [FA], mean diffusivity [MD], radial diffusivity, and axial diffusivity), however many studies of aging and diffusion have investigated FA and MD as measures of white matter microstructure. FA measures the degree to which diffusion is directional, tending to decrease with age, and MD is a measure of mean diffusion across all axes, tending to increase with age. Each measure is thought to underlie specific alterations to white matter integrity (Burzynska et al., 2010), however, when taken together these diffusion metrics are thought to represent overall white matter health (Bennett & Madden, 2014). Association and commissural white matter tracts, as compared to projection fibers (Lebel et al., 2012; Sullivan, Rohlfing, & Pfefferbaum, 2010), consistently show negative (FA) and positive (MD) relationships with age (Bennett et al., 2010; Bennett & Madden, 2014; Burzynska et al., 2010; Douet & Chang, 2015; Kennedy & Raz, 2009; Lebel et al., 2012; Madden et al., 2012; Pelletier et al., 2013; Sala et al., 2012; Sullivan et al., 2010), including tracts connecting the medial temporal lobes (MTLs) such as the fornix, cingulum, uncinate, and inferior longitudinal fasciculus (Douet & Chang, 2015; Metzler-Baddeley, Jones, Belaroussi, Aggleton, & O’Sullivan, 2011; Pelletier et al., 2013).
1.3 |. Association between MTL structure and cognition
Metrics of brain structure, such as volume and diffusion, exhibit complex, and occasionally nonlinear relationships across the lifespan (Daugherty, Bender, Raz, & Ofen, 2016; Douet & Chang, 2015; Kennedy et al., 2009; Lebel et al., 2012; Raz et al., 2005; Sala et al., 2012), and many of these changes likely reflect normal development. Therefore, understanding the consequences of these MTL alterations with age requires linking these measures either directly to pathological states (Douet & Chang, 2015; Kantarci, 2014) or to the variability of cognitive performance within healthy aging. Reported associations between MTL structure (volume, white matter measures) and cognition have been mixed. Several early studies showed seemingly clear links between lower hippocampal volume and poorer memory in older adults (Golomb et al., 1993, 1994, 1996); however, this relationship may be relatively weak (for review see Van Petten, 2004). When considering specific hippocampal subfields and the surrounding MTL structure, there are similarly mixed findings regarding which regions are most closely associated with memory performance (Carr et al., 2017; Daugherty, Flinn, & Ofen, 2017; Dickerson et al., 2009; Doxey & Kirwan, 2015; Shing et al., 2011; Yonelinas et al., 2007). These inconsistent findings likely stem from variability in the measurement of cognition and/or the measurement of volume across studies. The majority of studies utilize a single measure of memory or cognition, reducing the reliability, robustness, and generalizability of these constructs. Furthermore, because a unified protocol for measuring hippocampal and subfield volume has not been fully developed (see Olsen et al., in press; Wisse et al., 2017), prior studies have measured MTL volume based on different protocols and criteria, introducing uncontrolled error variance across studies.
White matter diffusion in tracts innervating the MTLs tends to show stronger associations with cognition (Bender, Prindle, Brandmaier, & Raz, 2016; Kennedy & Raz, 2009; Metzler-Baddeley et al., 2011; Sasson, Doniger, Pasternak, Tarrasch, & Assaf, 2012; Sullivan et al., 2010), where the fornix is specifically sensitive to episodic memory (Henson et al., 2016; Metzler-Baddeley et al., 2011; Rudebeck et al., 2009). However, in studies that include both MTL volume and diffusion metrics, the results are varied, with studies reporting volume only (Doxey & Kirwan, 2015; Gorbach et al., 2017), diffusion only (Fletcher et al., 2013; Gazes, Li, Sun, Razlighi, & Tsapanou, 2018), or both (Ezzati, Katz, Lipton, Zimmerman, & Lipton, 2016; Henson et al., 2016; Persson et al., 2006) as significant predictors of cognitive performance.
1.4 |. Aims and hypotheses
Given the inconsistent literature on the associations among MTL regional brain volumes, anatomical connectivity, and memory, the current study has two primary aims. First, to assess the relationship among age, MTL volume, and white matter microstructure across a large lifespan sample. Second, using structural equation modeling, we aim to investigate whether these structural measures mediate the relationship between age and memory and gauge the extent to which various models of structural connectivity may differentially account for potentially mediated relationships. In an attempt to overcome some of the weaknesses in the current literature, we utilize a harmonized hippocampal subfield segmentation protocol developed across several labs (Olsen et al., in press; Wisse et al., 2017), and implement multiple measurments of memory to increase the generalizability of our findings. Based on the prior literature, we hypothesize that hippocampal subfield volume and measures of fornix white matter microstructure will show negative associations with age, with the ERC exhibiting the weakest relationship, and fornix diffusion the strongest. We also hypothesize that measures of MTL structure will mediate the relationship between age and memory, where associative memory will likely show stronger mediation as compared to item memory.
2 |. METHODS
2.1 |. Participants
Participants were recruited as part of a lifespan study of aging from the Dallas Fort-Worth metroplex (n = 219) screened against a history of metabolic, neurologic or psychiatric conditions, head trauma, drug or alcohol problems, cardiovascular disease, depression (Center for Epidemiological Study—Depression ≤16; Radloff, 1977), and were cognitively intact (Mini Mental State Exam >25; Folstein, Folstein, & McHugh, 1975). A subset of 186 individuals had complete cognitive and MRI (i.e., T1-, T2-, and diffusion-weighted imaging sequences) data. Of these, nine participants were removed from the data set for poor data quality of both the high-resolution T2, used for hippocampal segmentation, and DTI scans. An additional 13 individuals did not have tractography data due to an inability to track fornix bilaterally (n = 6) or due to insufficient number of streamlines found (number of streamlines >1.4 SD below the mean, n = 7). Participant demographic data are summarized in Table 1.
TABLE 1.
Summary of participant data
| N | Mean | SD | Range | ||
|---|---|---|---|---|---|
| Demographics | |||||
| Age | 177 | 53.66 | 19.09 | 20 | 94 |
| Education (years) | 177 | 15.56 | 2.49 | 12 | 20 |
| Sex (% female) | 177 | 59.32 | |||
| MMSE | 177 | 29.02 | 0.86 | 26 | 30 |
| CESD | 177 | 4.36 | 3.82 | 0 | 16 |
| Cognitive measures | |||||
| CVLT immediate Total | 177 | 56.80 | 10.69 | 30 | 77 |
| CVLT long delay free recall | 177 | 12.66 | 2.93 | 4 | 16 |
| MfN delayed | 177 | 22.76 | 9.47 | 0 | 36 |
| MfN immediate | 177 | 55.81 | 11.22 | 29 | 72 |
| VPA immediate total | 177 | 35.54 | 10.51 | 12 | 56 |
| VPA delayed free recall | 177 | 11.28 | 2.75 | 4 | 14 |
| VPA delayed recognition | 177 | 38.92 | 1.71 | 32 | 40 |
| VPA delayed cued recall | 177 | 17.71 | 5.23 | 5 | 28 |
| Gray matter volumes (mm3) | |||||
| Left parahippocampal gyrus | 177 | 2018.00 | 343.53 | 1,197.16 | 3,795.58 |
| Right parahippocampal gyrus | 177 | 1857.69 | 315.22 | 1,071.54 | 3,065.04 |
| Left entorhinal cortex | 177 | 252.13 | 45.34 | 124.35 | 388.41 |
| Right entorhinal cortex | 177 | 278.94 | 47.00 | 154.04 | 460.07 |
| Left subiculum | 177 | 283.26 | 36.67 | 160.62 | 378.33 |
| Right subiculum | 177 | 278.32 | 36.06 | 181.83 | 384.42 |
| Left CA1/2 | 177 | 148.28 | 19.37 | 104.31 | 198.43 |
| Right CA1/2 | 177 | 165.01 | 22.08 | 87.72 | 224.85 |
| Left CA3/DG | 177 | 233.60 | 34.55 | 133.81 | 335.45 |
| Right CA3/DG | 177 | 228.96 | 32.91 | 147.15 | 335.98 |
| Tractography measures | |||||
| Fornix FA | 164 | 0.38 | 0.05 | 0.27 | 0.5 |
| Fornix MDxl00° | 164 | 1.29 | 0.18 | 0.99 | 2.04 |
Note: All variables significantly correlate with age (ps < .046) except for education, r(175) = .051, p = .504, and CESD, r(175) = −.093, p = .219. Abbreviations: CA, cornu ammonis; CVLT, California Verbal Learning Test; ERC, entorhinal cortex; FA, fractional anisotropy; MD, mean diffusivity (after multiplying by 1,000); MfN, memory for names; VPA, verbal paired associates.
2.2 |. Cognitive testing
Participants underwent a comprehensive battery of cognitive tests across two assessment sessions prior to MRI scanning. The current study utilized multiple measures of associative and item memory. Associative memory measures included the WAIS-IV verbal paired associates (VPA) subtest (Wechsler, 2009) including immediate recall, delayed cued and free recall, and delayed recognition scores, and the Woodcock–Johnson Psychoeducational Battery-III Memory for Names (MfN) subtest (Woodcock, McGrew, & Mather, 2007) including immediate and delayed memory scores. Item memory was measured from the California Verbal Learning Test (CVLT; Delis, Kramer, Kaplan, & Ober, 2000) including total immediate free recall and long delay free recall scores. Tests were administered by trained psychometricians using standard administration outlined in each test manual.
2.3 |. Imaging protocol
2.3.1 |. Sequence acquisition
All magnetic resonance imaging was conducted on the same 3T Phillips Achieva (Phillips Medical Systems, Andover, MA) whole body scanner at the University of Texas Southwestern Medical Center’s Advanced Imaging Research Center using a 32-channel head coil using sense encoding. The current study utilized a T1-weighted high-resolution MP-RAGE sequence for measurement of regional brain volumes (TR = 8.3 ms, TE = 3.8 ms, FOV = 256 × 204 mm, voxel size = 1 × 1 × 1 mm3, 160 sagittal slices, FA = 12°, total time = 3:57 min), an ultrahigh-resolution T2/PD-weighted image of the MTL aligned along the longitudinal axis of the hippocampus for subfield volume measurement (TR = 3,500 ms, TE = 44 ms, FOV = 215 × 215 mm, voxel size = 0.42 × 0.42 × 2.00 mm3, 30 coronal slices, FA = 120°, total time = 6:46), and a diffusion-weighted imaging sequence for tractography of the fornices, single-shot EPI (TR = 5,611 ms, TE = 51 ms, FOV = 224 × 224 mm, voxel size = 2 × 2 × 2.2 mm3 reconstructed to 0.875 × 0.875 × 2 mm3, 65 axial slices, FA = 90°, total time = 4:19 min), 30 diffusion-weighted directions (b-value 1,000 s/mm2) and 1 nondiffusion-weighted (b-value 0 s/mm2).
2.3.2 |. Hippocampal subfield measurement
Manual tracing of 30 participants for training of semiautomated atlas
One expert rater (A.K.), trained by (K.K.) used the Analyze software (Mayo Clinic, Rochester, MN) and a 21 in. high definition digitizing tablet with stylus (Wacom Cintiq) to manually trace hippocampal subfields on the T2/PD images for 30 participants for use in training a semiautomated atlas, detailed in section “Semiautomated Segmentation of Hippocampal Subfields” (age in years, M = 54.13, SD = 14.72, range 21–81; 13 female; education in years, M = 15.20, SD = 2.66, range 12–20). Traced regions included the ERC, subiculum, CA1/2, and CA3/DG. All subfields were traced bilaterally with excellent reliability (tests conducted using 10 participants’ scans traced by both A.K. and K.K), ICC(3): right and left ERC = 0.88 and 0.96, right and left subiculum = 0.97 and 0.95, right and left CA1/2 = 0.91 and 0.79, right and left CA3/DG = 0.99 and 0.95. To manually define hippocampal subfield regions we followed (Shing et al., 2011), modified from Mueller et al. (2007) and Mueller and Weiner (2009), with two additional modifications derived from the hippocampal subfield harmonization workgroup (Yushkevich, Amaral, et al., 2015; Wisse et al., 2017). First, based on recommendations from the hippocampal subfield working group, the range of slices for subfields was extended to include a total of five slices, however, ERC range was maintained at the original six slices. The anterior range for subfields begins posterior to the uncal apex and after digitation in the hippocampal head is no longer visible. The last slice of the ERC is the first slice of the subfields and extends five slices anterior. Second, the border between the subiculum and CA1/2 was shifted laterally such that the boundary is determined geometrically using an ellipse formed by the DG and lateral CA1/2/3. A vertical bisector of the ellipse is used to determine the boundary between CA1/2 and subiculum as well as CA1/2 and CA3/DG. The boundary between the subiculum and CA1/2 is drawn perpendicular to the white matter of the parahippocampal gyrus where the bisector intersects this region. The zenith of the ellipse is used to define the CA1/2 and CA3/DG boundary leaving a notch at the top of the ellipse to ensure the CA3 is captured and included in with the DG. For illustration of the manually demarcated hippocampal subfields see Figure 1a,d.
FIGURE 1.
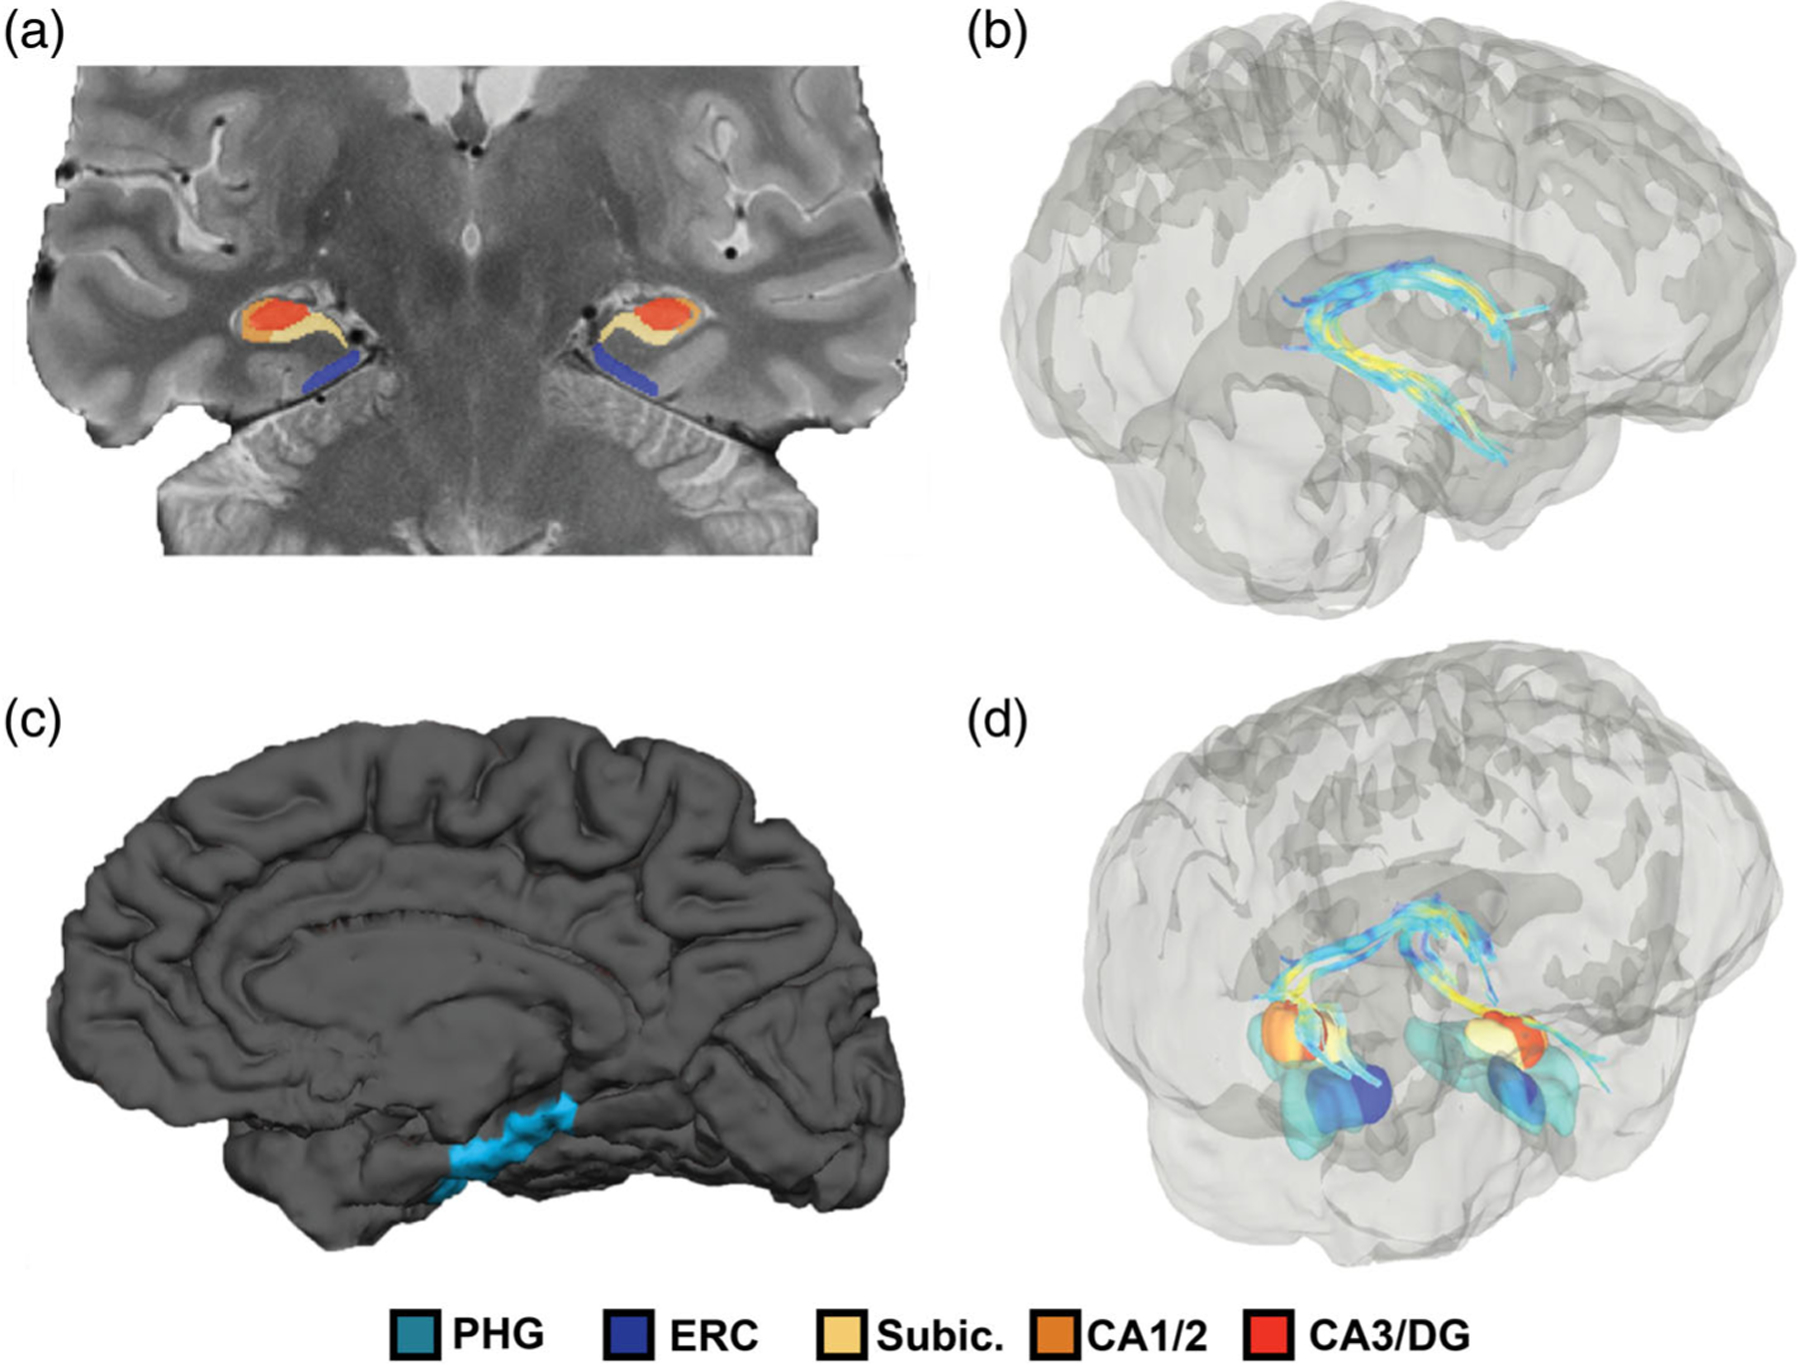
Illustration of measures of MTL structure: subfield segmentation, fornix tractography, and parahippocampal volume. Illustration of structural measures from one representative middle-aged (46 years old) adult in native subject space. (a) Illustrates in a coronal slice on the ultrahigh-resolution T2/PD scan the bilateral hippocampal body subfield segmentation ROIs. (b) Illustrates in a 3D rendered diffusion image the tractography of the bilateral fornix. (c) Illustrates Freesurfer estimation of the parahippocampal gyrus shown on a medial surface T1 image. (d) Illustrates all modalities with medial temporal lobe volumes warped into diffusion space. ERC, entorhinal cortex; MTL, medial temporal lobe; PHG, parahippocampal gyrus
Semiautomated segmentation of hippocampal subfields
The 30 manually segmented participants’ regions were used to train and inform the Automatic Segmentation of Hippocampal Subfields v1.0 (ASHS; Yushkevich et al., 2010; Yushkevich, Pluta, et al., 2015) pipeline. The ASHS protocol recommends a minimum of 20 scans and a maximum of 30 scans (after which yields diminished returns) for atlas segmentation training. Thirty individuals were selected who spanned the age-range of the sample and represented images of varying quality to maximize study-specific variance. ASHS was then used to segment all participants’ subfields using a study-specific atlas derived from the 30 participants who had manually defined ROIs described above (see Figure 1a). Before submitting each participant’s T1- and T2/PD-weighted MRI scans for segmentation they were coregistered using ANTS (advancednormalization tools (ANTs) software package (open-source software;http://picsl.upenn.edu/software/ants). A detailed description of the ASHS pipeline can be found in Yushkevich et al. (2010) and (2015). Mean volume (in mm3) for each subfield was extracted for each individual and residualized for manually measured intracranial volume using ANCOVA (see Raz et al., 2005).
Assessing bias in the hippocampal segmentation procedure
Two approaches were implemented to assess differences in volume estimates from the manual as compared to automated procedures. Two-way mixed intraclass correlations with a random effect on subject and a fixed effect on rater (McGraw & Wong, 1996) were calculated using the 30 subjects who were both manually traced and estimated in ASHS to assess agreement between the two methods, and second Bland–Altman plots (Bland & Altman, 1986, 1999) were constructed to assess systematic bias between the two measures. Bland–Altman plots assess the extent to which two methods of measurement agree based on the overall mean of the measurement (i.e., the measurement methods differ by an overall mean shift) and the extent to which the two methods of measurement are in agreement across the range of values being measured (i.e., are larger or smaller values systematically under- or over-estimated).
Intraclass correlations between methods were high for all subfields, (ERC = 0.974, 95% CI [0.947, 0.988]; Subiculum = 0.961, 95% CI [0.92, 0.981]; CA1/2 = 0.950, 95% CI [0.898, 0.976]; CA3/DG = 0.971, 95% CI [0.94, 0.986]), suggesting high agreement between the manual tracings and ASHS segmentation. The Bland–Altman plots (see Figure 2) revealed no systematic mean difference between the two segmentation methods as evidenced by the fact that the mean difference (solid gray horizontal line) is around zero and the confidence intervals (CIs; dashed gray horizontal line) contain zero for all subfields. Further, the plots reveal small-to-no bias along the range of volumes as evidenced by the lack of a strong relationship between pairwise differences and the range of mean values present in the sample (regression line). The ERC does show a small bias along the range of mean volumes. However, given the small bias in the ERC and the lack of bias in other regions we did not implement any correction on ASHS estimated volumes.
FIGURE 2.
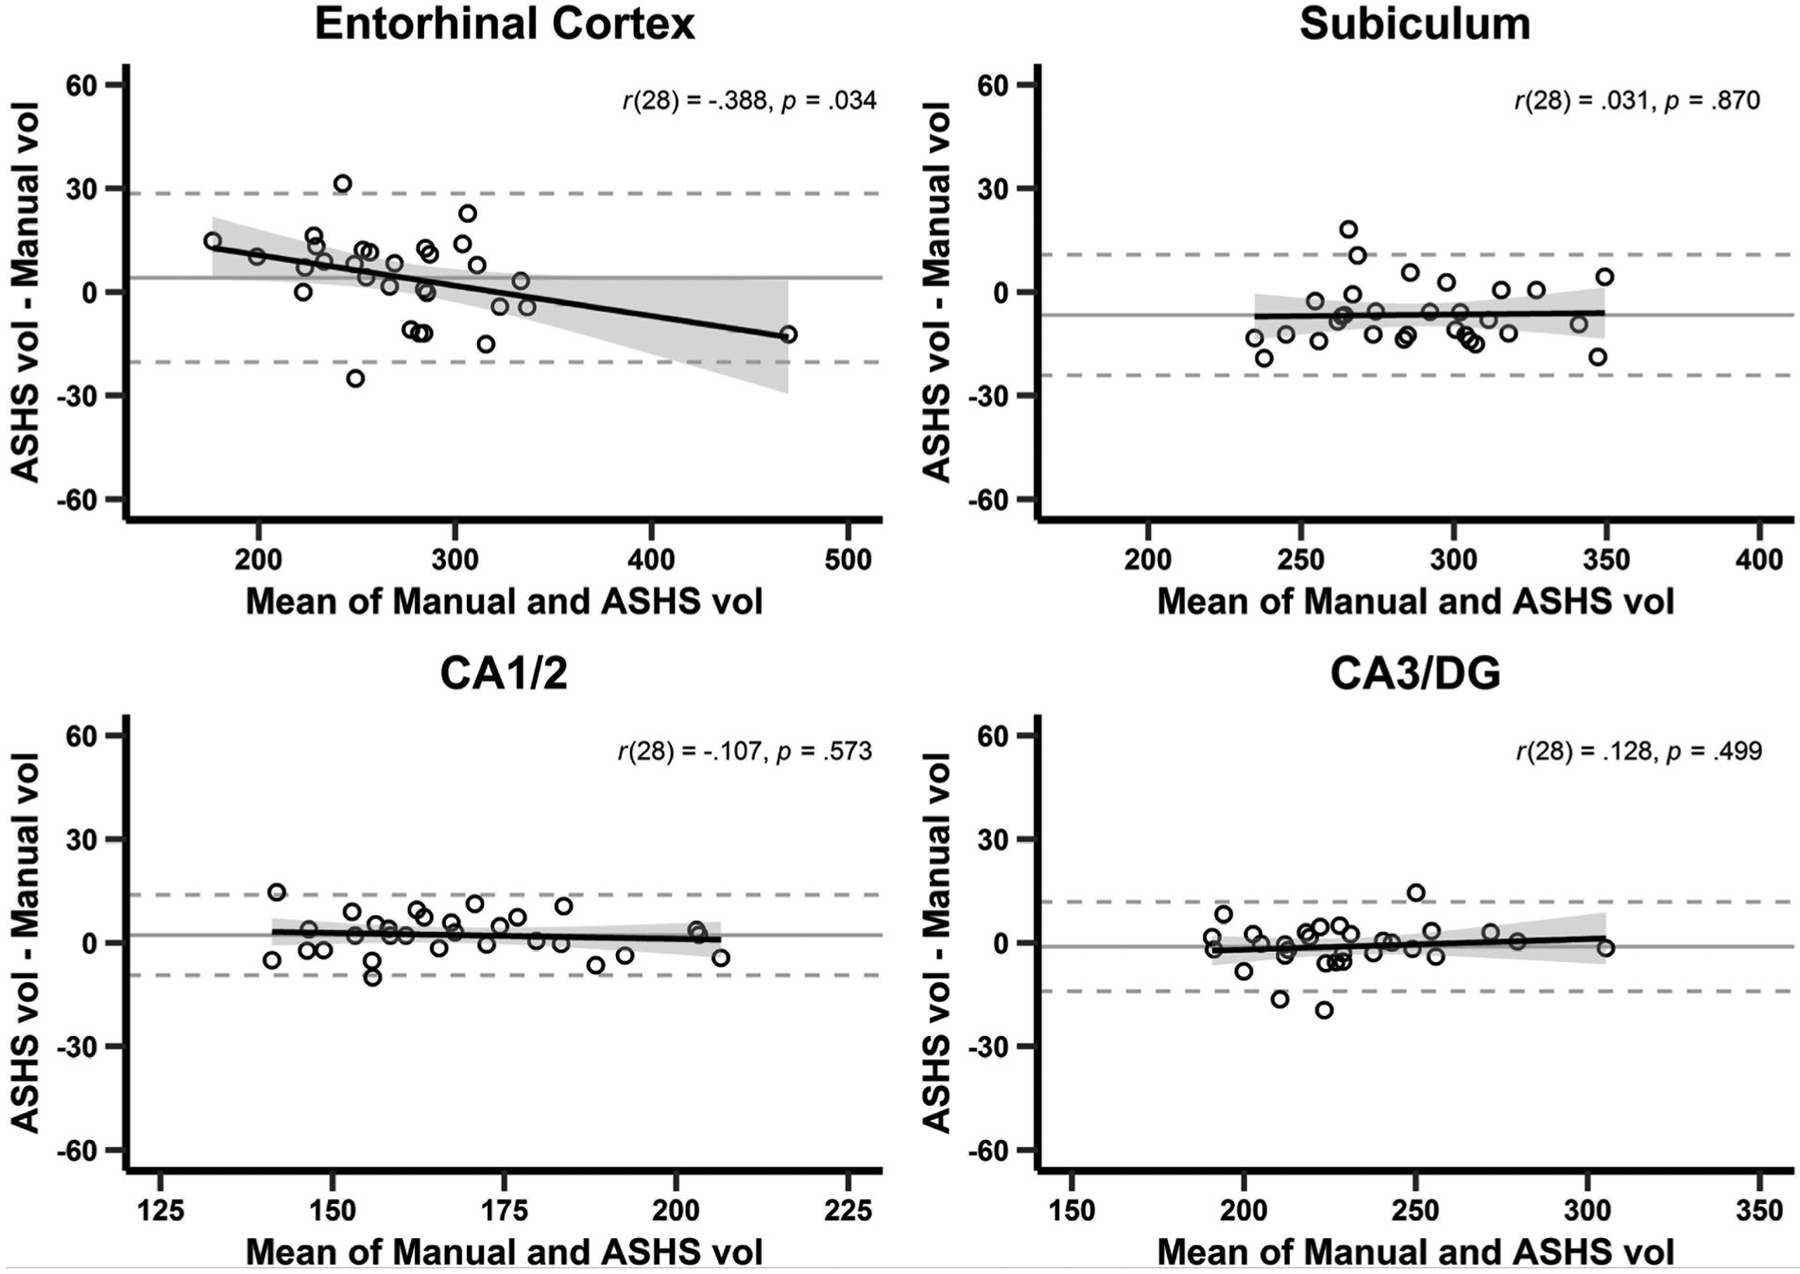
Bland–Altman plot agreement between manual tracing and ASHS subfield volumes, n = 30. Bland–Altman analysis provides information about potential bias in both mean estimates and along the measurement gradient between two measurements of the same variable. These plots reveal no systematic bias between the means (mean difference of approximately zero; solid gray horizontal line with confidence intervals labeled as dashed gray lines) between manual segmentation and the automated segmentation of hippocampal subfields (ASHS) segmentation presented on the x-axis. The relationship between the difference between the estimates (x-axis) and the mean volume estimate (y-axis) also reveals small-to-no bias as a function of estimated volume (regression line), however, there is a weak relationship between the mean volume estimate and the mean difference for the entorhinal cortex. CA, cornu ammonis; DG, dentate gyrus; vol, volume (mm3)
2.3.3 |. Diffusion tensor imaging processing
Diffusion tensor images were processed according to the following pipeline. The B0 and all gradient images were brain extracted (Smith, 2002) by coregistration (Avants et al., 2009) of the brain extracted B0 to each gradient image. All images were visually inspected and an automated quality assessment was then performed using DTIPrep (Liu et al., 2010) to identify and remove artifact slices and/or gradients in the data. On average, four gradients were removed per participant. The b-matrix was then adjusted to account for any adjustments to the orientation of the data slices (Leemans & Jones, 2009). DSI Studio (dsi-studio.labsolver.org) was used to process the B0, gradient images, and the adjusted b-matrix (Yeh, Verstynen, Wang, Fernández-Miranda, & Tseng, 2013).
Deterministic tractography of the bilateral fornices was conducted by creating anatomical seeds and regions of inclusion and avoidance, based on consultation with atlases (Desikan et al., 2006; Hua et al., 2008), on the 1-mm MNI template and warping each region into subject diffusion space. The bilateral hippocampi and parahippocampal gyri were combined (within hemisphere) and used as a seed region, and the JHU fornix ROI, dilated by 3 mm using fslmaths (Smith et al., 2004), was used as a region of inclusion. Regions of avoidance included the brainstem, splenium of the corpus callosum, and bilateral nucleus accumbens. A deterministic tracking algorithm implemented in DSI Studio (Yeh et al., 2013) was used with the following parameters: maximum turning angle of 25°, step size of 0.44 mm, an FA threshold of 0.12, and a minimum/maximum length of 10/100 mm, respectively. All tract output was visually inspected and those without bilateral fornix tracts or those with streamline counts 1.4 SDs below the mean were excluded from analysis. Mean FA and MD were extracted for each participant from the resulting bilateral tracts. Fornix tracts and MTL volumes for a representative subject are illustrated in Figure 1b,d.
2.3.4 |. Regional temporal lobe volume estimates
Individual T1-weighted structural images were manually assessed for subject movement distortions and acquisition artifacts. Images were then submitted to the Freesurfer v5.3 image analysis suite for semiautomated cortical reconstruction and volumetric segmentation (Dale, Fischl, & Sereno, 1999; Fischl & Dale, 2000). Freesurfer includes motion correction and tissue segmentation procedures allowing for regional quantification of both cortical and subcortical tissue properties such as volume. Manual edits were made by trained operators as necessary and re-iterated to improve imperfect segmentations. A standardized atlas (Desikan et al., 2006) was used to generate the bilateral parahippocampal gyri parcels for each participant in the sample (see Figure 1c,d). According to Desikan et al. (2006), the parahippocampal gyrus has a rostral boundary of the posterior end of the ERC and continues anteriorly until the caudal portion of the hippocampus. Therefore the ERC and parahippocampal gyrus display minimal anatomical overlap. Mean volume (mm3) was extracted for each participant’s parahippocampa gyrus parcel and residualized for intracranial volume. See Figure 1b for illustration of parahippocampal gyrus parcellation.
2.4 |. Analysis plan
2.4.1 |. Structural variables and age
The effects of age (continuous) on the structural brain variables were analyzed using a mixed model approach in SAS v9.4 (Cary, NC). Prior to analysis, all structural variables were z-scored. Fornix MD was also multiplied by negative 1 in order to estimate differences in magnitude of the age effect as opposed to differences in direction, since MD typically shows increases with age. Age was mean-centered and a quadratic age term was included to test for the presence of nonlinear age effects. The model included a within-subject variable for all structural variables, a between-subjects factor of age, the interaction between the two, and a random effect on the intercept for subjects. Simple slopes for each structural variable as well as slope comparisons between each structural variable were obtained using the estimate statement in mixed procedure.
2.4.2 |. Confirmatory factor analysis for latent cognitive constructs
A confirmatory factor analysis (CFA) was conducted to establish an associative and item memory latent construct based on the cognitive tests administered to the participants and was implemented in MPlus v8 (Muthén & Muthén, 2017). A latent associative memory construct was built from all cognitive tests administered to participants that required the learning of associations between to-be-remembered stimuli. This construct included four subtests of VPA, both total pairs remembered immediately after presentation, delayed cued recall, delayed free recall, and delayed recognition. Also included were the immediate and delayed memory subtests from MfN. The item memory construct included total words immediately recalled after each of five presentations of word lists from CVLT as well as the total words remembered from the long delay free recall subtest. The mean and variance of each latent construct was set at 0 and 1, respectively, and each loading was freely estimated. Modification indices were used to adjust the CFA if necessary. We used root mean square error of approximation (RMSEA; <0.01 indicates excellent fit, <0.05 indicates good fit, <0.08 indicates mediocre fit), Tucker Lewis index (TLI; >0.95 indicates good fit), and standardized root mean square residual (SRMR; <0.08 indicates good fit), to assess individual model fit.
2.4.3 |. Structural equation model
To investigate the complex relationships among age, MTL brain structural variables, and memory constructs, we utilized a structural equation model comparison approach designed to not only describe whether these brain variables mediated the relationship between age and memory, but also the extent to which a formal structure between the variables could be described. First, mediating variables were placed in the model such that all paths between each variable, age, and memory were tested. Three models were then built with varying degrees of mediating structure following anatomical connectivity as the guide for the structure. Path estimates are derived from bootstrapping with 5,000 iterations and are presented with 95% CIs. Tests of model fit were used to guide model comparison and decisions about which model best described the data. We again used RMSEA, TLI, SRMR, to assess model fit both within and between models, however, we additionally used AIC and BIC, where smaller numbers indicate better fit, and Chi-square tests to compare models.
3 |. RESULTS
3.1 |. The effect of age on brain structural variables
The mixed effects model predicting structural variables from age and age-squared resulted in a significant effect of age (F[1, 176] = 103.28, p < .001), and a significant quadratic effect of age (F[1, 175] = 3.97, p = .048). There was also a significant interaction between the linear effect of age and structure (F[6, 1,021] = 3.97, p < .001), as well as a significant interaction between quadratic age and structure (F[6, 1,021] = 2.28, p = .034). The linear age by structure interaction appears to be primarily a function of a much stronger age effect in fornix FA and MD and a much weaker age effect in the ERC, whereas the subiculum, CA1/2, CA3/DG, and parahippocampal gyrus exhibit similar age effects (see Table 2). The quadratic age by structure interaction appears to be a function of fornix MD exhibiting a significantly stronger quadratic age effect than all other variables except fornix FA, which exhibits a significant but weaker quadratic effect (see Table 2 and Figure 3).
TABLE 2.
Breakdown of age by structural variable interaction analysis
| Effect | Estimate | SE | Df | t-value | p-value |
|---|---|---|---|---|---|
| Structure by age | |||||
| Subiculum by age | −0.01768 | 0.003562 | 831 | −4.96 | <.001* |
| PHG by age | −0.02346 | 0.003562 | 831 | −6.59 | <.001* |
| Fornix MD by age | −0.03427 | 0.003816 | 921 | −8.98 | <.001* |
| Fornix MD by age2 | −0.00072 | 0.000207 | 908 | −3.47 | <.001* |
| Fornix FA by age | −0.03747 | 0.003816 | 921 | −9.82 | <.001* |
| Fornix FA by age2 | −0.00046 | 0.000207 | 908 | −2.22 | 0.026‡ |
| ERC by age | −0.00967 | 0.003562 | 831 | −2.71 | 0.007‡ |
| CA3/DG by age | −0.02073 | 0.003562 | 831 | −5.82 | <.001* |
| CA1/2 by age | −0.01327 | 0.003562 | 831 | −3.72 | <.001* |
| Pairwise comparisons of linear age interaction | |||||
| Subiculum versus PHG | −0.01768 | 0.003562 | 831 | −4.96 | <.001* |
| Subiculum versus fornix MD | −0.02346 | 0.003562 | 831 | −6.59 | <.001* |
| Subiculum versus fornix FA | −0.03427 | 0.003816 | 921 | −8.98 | <.001* |
| Subiculum versus ERC | −0.03747 | 0.003816 | 921 | −9.82 | <.001* |
| Subiculum versus CA3/DG | −0.00967 | 0.003562 | 831 | −2.71 | 0.007‡ |
| Subiculum versus CA1/2 | −0.02073 | 0.003562 | 831 | −5.82 | <.001* |
| PHG versus fornix MD | −0.01327 | 0.003562 | 831 | −3.72 | <.001* |
| PHG versus fornix FA | 0.005777 | 0.004302 | 1,017 | 1.34 | 0.180 |
| PHG versus ERC | 0.01658 | 0.004514 | 1,027 | 3.67 | <.001* |
| PHG versus CA3/DG | 0.01979 | 0.004514 | 1,027 | 4.38 | <.001* |
| PHG versus CA1/2 | −0.00801 | 0.004302 | 1,017 | −1.86 | 0.063 |
| Fornix MD versus fornix FA | 0.003049 | 0.004302 | 1,017 | 0.71 | 0.479 |
| Fornix MD versus ERC | −0.00442 | 0.004302 | 1,017 | −1.03 | 0.305 |
| Fornix MD versus CA3/DG | −0.01353 | 0.004514 | 1,027 | −3.00 | 0.003‡ |
| Fornix MD versus CA1/2 | −0.02100 | 0.004514 | 1,027 | −4.65 | <.001* |
| Fornix FA versus ERC | −0.02781 | 0.004514 | 1,027 | −6.16 | <.001* |
| Fornix FA versus CA3/DG | −0.01674 | 0.004514 | 1,027 | −3.71 | <.001* |
| Fornix FA versus CA1/2 | −0.02421 | 0.004514 | 1,027 | −5.36 | <.001* |
| ERC versus CA3/DG | 0.01106 | 0.004302 | 1,017 | 2.57 | 0.010‡ |
| ERC versus CA1/2 | −0.01353 | 0.004514 | 1,027 | −3.00 | 0.003‡ |
| CA1/2 versus CA3/DG | −0.02100 | 0.004514 | 1,027 | −4.65 | <.001* |
| Pairwise comparisons of quadratic age interaction | |||||
| FA versus subiculum | −0.00022 | 0.000246 | 1,026 | −0.89 | 0.3736 |
| FA versus CA1/2 | −0.00040 | 0.000246 | 1,026 | −1.64 | 0.1010 |
| FA versus ERC | −0.00028 | 0.000246 | 1,026 | −1.15 | 0.2492 |
| FA versus CA3/DG | −0.00038 | 0.000246 | 1,026 | −1.55 | 0.1224 |
| FA versus PHG | −0.00051 | 0.000246 | 1,026 | −2.09 | 0.0366‡ |
| MD versus subiculum | −0.00048 | 0.000246 | 1,026 | −1.94 | 0.0530 |
| MD versus CA1/2 | −0.00066 | 0.000246 | 1,026 | −2.69 | 0.0073‡ |
| MD versus ERC | −0.00054 | 0.000246 | 1,026 | −2.20 | 0.0280‡ |
| MD versus CA3/DG | −0.00064 | 0.000246 | 1,026 | −2.59 | 0.0096‡ |
| MD versus PHG | −0.00077 | 0.000246 | 1,026 | −3.14 | 0.0017‡ |
| FA versus MD | −0.00026 | 0.000253 | 1,017 | −1.02 | 0.3093 |
Note: All structural variables were z-scored and fornix MD was additionally multiplied by −1. Uncorrected p-values are shown but
indicates effect is significant at Bonferroni-corrected p-values (<.007 for structure by age; <.0015 for pairwise comparisons),
significant at <.05 uncorrected. Pairwise comparisons for the quadratic effect are presented only for fornix FA and MD as no MTL volumes exhibited significant quadratic effects. Abbreviations: CA, cornu ammonis; FA, fractional anisotropy; PHG, parahippocampal gyrus, ERC, entorhinal cortex; MD, mean diffusivity; MTL, medial temporal lobe.
FIGURE 3.
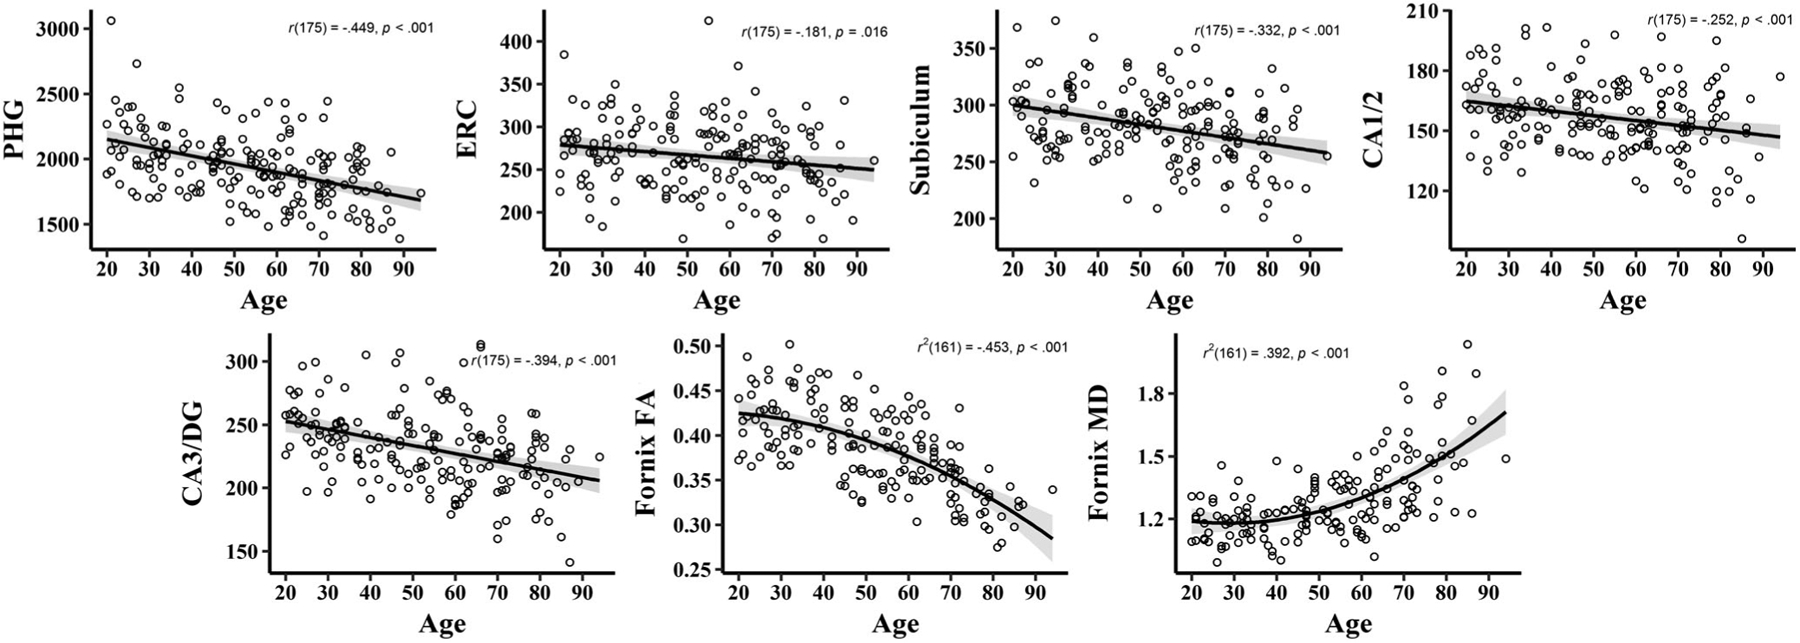
Effects of age on regional brain structure. Each subfield as well as fornix FA and MD are presented as a function of age. Fornix FA and MD exhibit significant quadratic associations with age. However, because these terms are not used in later models they are presented with light gray dashed lines to demonstrate the nonlinear effect. The zero-order Pearson correlation between age and each structural variable is shown on each graph. For volumetric panels the y-axis represents volume (mm3) adjusted for total intracranial volume. FA is a scalar value. MD is expressed as mm2/s ×1,000. ERC, entorhinal cortex, FA, fractional anisotropy, MD, mean diffusivity; PHG, parahippocampal gyrus
3.2 |. Confirmatory factor analysis for memory constructs
Before building the structural equation model with mediating pathways, we conducted a CFA with an associative and item memory construct to determine the measurement model. We used six subtests from VPA and two from MfN to build the associative memory latent construct and two subtests from CVLT to build the item memory latent construct. All memory tests administered were included and grouped a priori as either tests of associative or item memory, based on whether the test required creating associations between the to-be-learned materials. Initially, we fit the model with all indicators contributing to its respective latent construct. This resulted in poor model fit, χ2(19) = 168.47, p < .001, RMSEA = 0.211, TLI = 0.806, SRMR = 0.046, but produced several modification indices. Of these, two large modification indices (M.I. > 36) revealed that model fit would be significantly improved if either the two residuals for the MfN tests were allowed to correlate, or residuals from two VPA subtests, immediate and free recall, were allowed to correlate. Because the modification indices indicated the latent construct was not able to account for some within-test correlation, we freed both of these estimates simultaneously (see Figure 4). After this modification, the measurement model exhibited moderate to excellent fit, χ2(17) = 27.81, p = .047, RMSEA = 0.060, TLI = 0.984, SRMR = 0.020, and therefore these latent constructs were used in all subsequent mediation analyses. Standardized estimates in Figure 4 are derived from bootstrapping with 5,000 iterations and are presented with 95% CIs.
FIGURE 4.
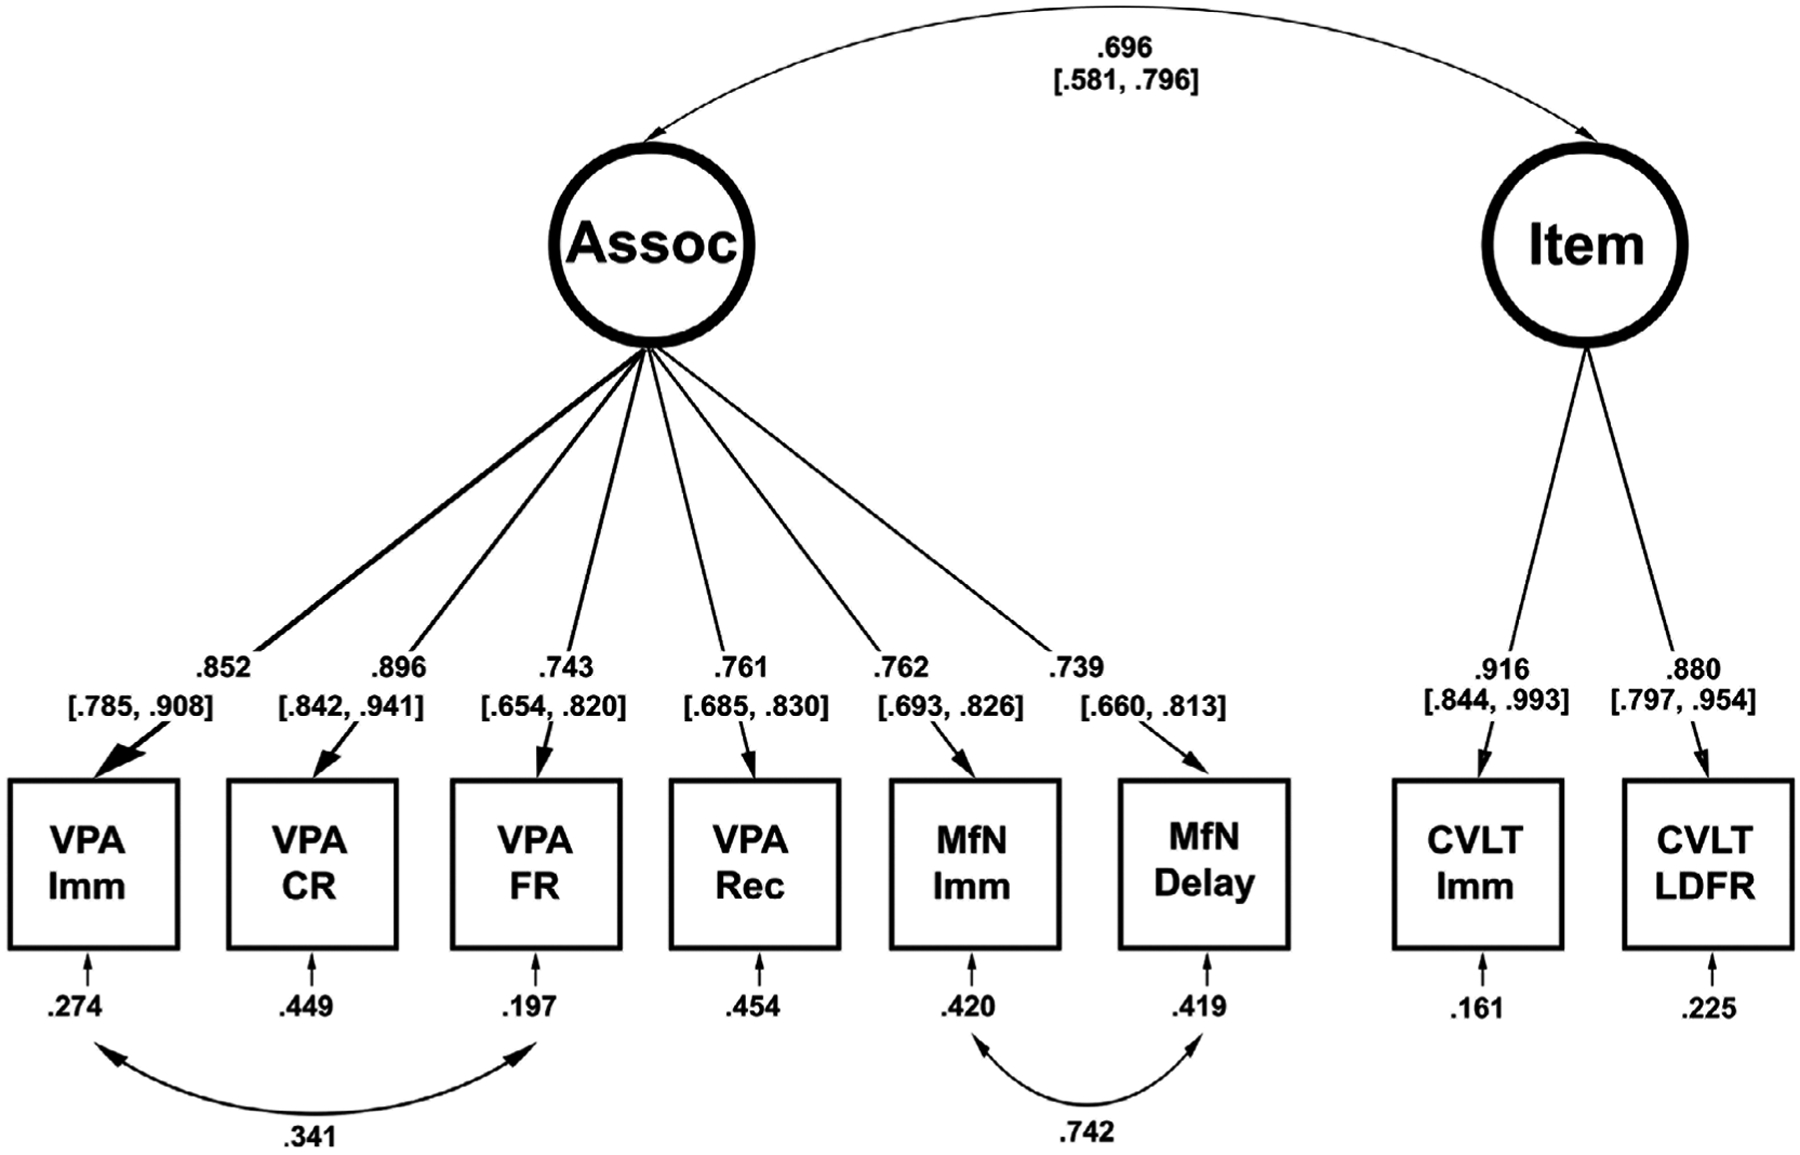
Measurement model for associative and item memory. Two latent constructs were created to represent associative and item memory. Two residual covariances were freed based on modification indices and the final model showed excellent fit for the data. Estimates shown are standardized weights derived from bootstrapping using 5,000 iterations with 95% confidence intervals in brackets. Circles represent latent variables and squares represent observed variables. CA, cornu ammonis; CR, cued recall; CVLT, California Verbal Learning Test; Del., delayed; DG, dentate gyrus; ERC, entorhinal cortex; FA, fractional anisotropy; FR, free recall; Imm., immediate; L, left; LDFR, long delay free recall; MD, mean diffusivity; MfN, memory for names; PHG, parahippocampal gyrus; R, right; Rec., recognition; Sub., subiculum; VPA, verbal paired associates
3.3 |. Structural equation models
To understand the nature of the associations among age, brain structure, and memory, and to formally assess whether brain structure mediates the relationship between age and memory, several structural equation models were fit and compared. As an overview, we first tested Model A with no structure imposed on the mediating variables. We then compared this model to ones in which we placed two types of structural constraints that mimic the pathway of neural information processing through the hippocampus. Model B forced all mediating effects through the information processing pathway, and Model C allowed the information processing pathway as well as individual age mediating effects through each structural variable. Finally, we conducted Model D with a hippocampal latent construct instead of individual subfields to assess whether total hippocampal volume allows for a more parsimonious explanation of the data. The Pearson correlation matrix among all variables is provided in Table 3. The four structural equation models are illustrated in Figure 5 with significant and nonsignificant paths included. The model fit statistics are provided and compared in Table 4. In the following paragraphs, we describe each model focusing on the indirect effects. Results are reported in text and figures as standardized estimates derived from bootstrapping using 5,000 iterations along with 95% CIs unless otherwise stated.
TABLE 3.
Correlation matrix for variables in structural equation model
| 1. | 2. | 3. | 4. | 5. | 6. | 7. | 8. | 9. | 10. | 11. | 12. | 13. | 14. | 15. | 16. | 17. | 18. | 19. | 20. | 21. | |
|---|---|---|---|---|---|---|---|---|---|---|---|---|---|---|---|---|---|---|---|---|---|
| 1. Age | 1 | ||||||||||||||||||||
| 2. CVLT Imm. | −0.402 | 1 | |||||||||||||||||||
| 3. CVLT LDFR | −0.338 | 0.806 | 1 | ||||||||||||||||||
| 4. MfN Imm. | −0.536 | 0.533 | 0.499 | 1 | |||||||||||||||||
| 5. MfN Del. | −0.58 | 0.492 | 0.442 | 0.892 | 1 | ||||||||||||||||
| 6. VPA Imm. | −0.411 | 0.588 | 0.526 | 0.649 | 0.651 | 1 | |||||||||||||||
| 7. VPA FR | −0.502 | 0.52 | 0.525 | 0.682 | 0.685 | 0.843 | 1 | ||||||||||||||
| 8. VPA Rec. | −0.436 | 0.443 | 0.47 | 0.533 | 0.554 | 0.609 | 0.698 | 1 | |||||||||||||
| 9. VPA CR | −0.522 | 0.528 | 0.484 | 0.565 | 0.574 | 0.631 | 0.66 | 0.525 | 1 | ||||||||||||
| 10. Fornix FA | −0.663 | 0.234 | 0.208 | 0.398 | 0.434 | 0.296 | 0.394 | 0.369 | 0.375 | 1 | |||||||||||
| 11. Fornix MD | 0.589 | −0.238 | −0.198 | −0.361 | −0.424 | −0.366 | −0.426 | −0.374 | −0.286 | −0.564 | 1 | ||||||||||
| 12. L DG | −0.38 | 0.154 | 0.223 | 0.191 | 0.22 | 0.167 | 0.183 | 0.22 | 0.191 | 0.242 | −0.204 | 1 | |||||||||
| 13. R DG | −0.338 | 0.128 | 0.204 | 0.142 | 0.18 | 0.195 | 0.219 | 0.207 | 0.205 | 0.205 | −0.216 | 0.663 | 1 | ||||||||
| 14. L CA1/2 | −0.202 | 0.138 | 0.148 | 0.144 | 0.144 | 0.127 | 0.143 | 0.139 | 0.114 | 0.241 | −0.209 | 0.523 | 0.408 | 1 | |||||||
| 15. R CA1/2 | −0.241 | 0.091 | 0.194 | 0.15 | 0.169 | 0.12 | 0.16 | 0.171 | 0.072 | 0.214 | −0.234 | 0.423 | 0.64 | 0.562 | 1 | ||||||
| 16. L Sub. | −0.296 | 0.105 | 0.173 | 0.219 | 0.213 | 0.184 | 0.217 | 0.284 | 0.179 | 0.246 | −0.226 | 0.509 | 0.423 | 0.441 | 0.39 | 1 | |||||
| 17. R Sub. | −0.304 | 0.088 | 0.084 | 0.179 | 0.184 | 0.222 | 0.252 | 0.267 | 0.159 | 0.172 | −0.217 | 0.43 | 0.5 | 0.323 | 0.375 | 0.626 | 1 | ||||
| 18. L ERC | −0.176 | −0.039 | 0.023 | 0.073 | 0.171 | 0.12 | 0.08 | 0.125 | 0.086 | 0.198 | −0.151 | 0.412 | 0.298 | 0.363 | 0.284 | 0.477 | 0.46 | 1 | |||
| 19. R ERC | −0.151 | −0.062 | 0.012 | 0.066 | 0.109 | 0.065 | 0.057 | 0.128 | 0.066 | 0.149 | −0.134 | 0.394 | 0.408 | 0.368 | 0.43 | 0.353 | 0.458 | 0.628 | 1 | ||
| 20. L PHG | −0.384 | 0.142 | 0.161 | 0.298 | 0.361 | 0.259 | 0.302 | 0.228 | 0.21 | 0.309 | −0.189 | 0.262 | 0.287 | 0.271 | 0.258 | 0.303 | 0.331 | 0.442 | 0.391 | 1 | |
| 21. R PHG | −0.344 | 0.267 | 0.197 | 0.307 | 0.295 | 0.27 | 0.248 | 0.192 | 0.239 | 0.323 | −0.232 | 0.24 | 0.293 | 0.207 | 0.273 | 0.246 | 0.232 | 0.254 | 0.291 | 0.317 | 1 |
Abbreviations: CVLT, California Verbal Learning Test; Imm., immediate; LDFR, long delay free recall; MfN, memory for names; Del., delayed; VPA, verbal paired associates; FR, free recall; Rec., recognition; CR, cued recall; FA, fractional anisotropy; MD, mean diffusivity; L, left; R, right; DG, dentate gyrus; CA, cornu ammonis; Sub., subiculum; ERC, entorhinal cortex; PHG, parahippocampal gyrus.
FIGURE 5.
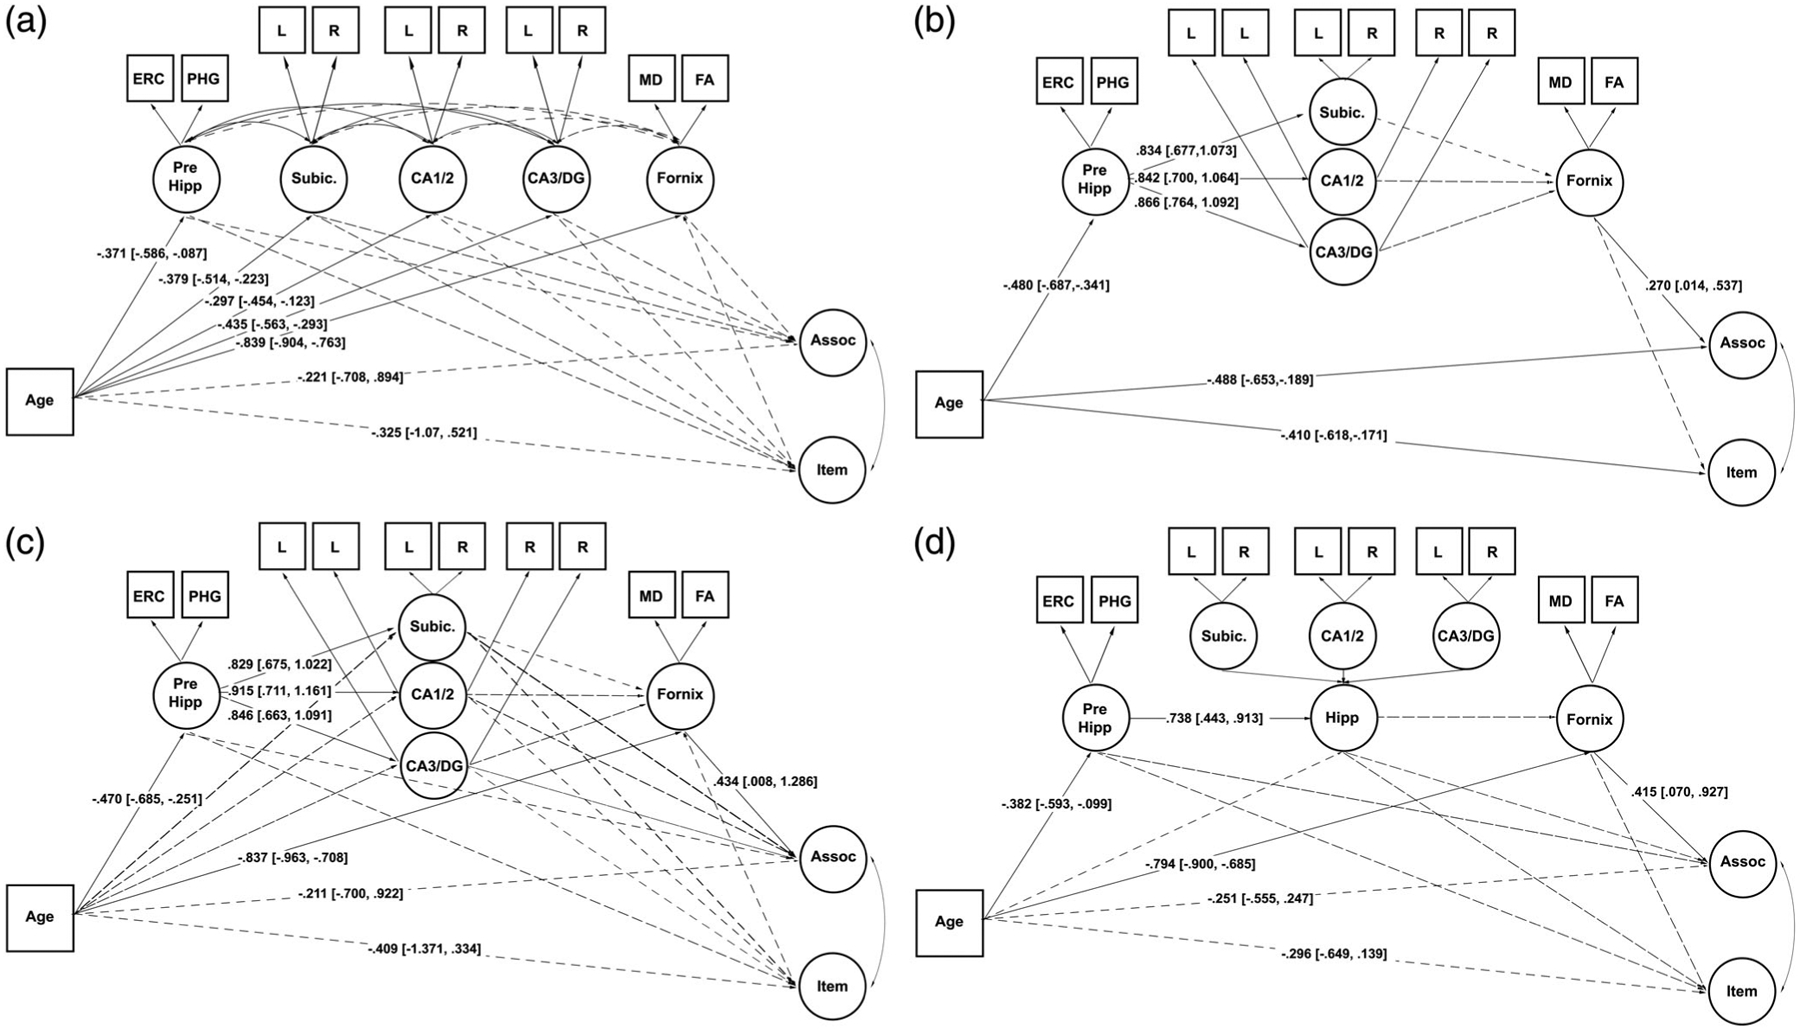
Structural equation models. Model (a) allows estimation of all paths between age and memory with no formal structural constraints on the structural variables. Model (b) forces all variance from age through the structural variables according to anatomical connections. Model (c) replicates all paths of Model (b), but allows age to have specific paths through each structure. Model (d) replicates Model (c) aside from a single latent hippocampal variable. Estimates are derived from bootstrapping with 5,000 iterations and are presented with 95% confidence intervals. Dotted lines represent nonsignificant paths. Solid lines represent significant paths. Curved lines represent estimated covariances while straight lines represent regression lines. Circles represent latent variables and squares represent observed variables. The memory construct measurement model is as shown in Figure 4 and is omitted here for figure clarity. Assoc, associative memory; ERC, entorhinal cortex; Hipp, hippocampus; item, item memory; PHG, parahippocampal gyrus; Subic, subiculum
TABLE 4.
Model fit for structural equation Models A–D
| AIC | BIC | Chi-square | RMSEA (95% CI) | TLI | SRMR | |
|---|---|---|---|---|---|---|
| Model A | 11,960.24 | 12,227.03 | X2(123) = 219.70, p < .001 | 0.067 (0.052−0.081) | 0.934 | 0.054 |
| Model B | 11,972.59 | 12,270.57 | X2(139) = 346.05, p < .001 | 0.092 (0.080−0.104) | 0.875 | 0.100 |
| Model C | 11,972.66 | 12,226.76 | X2(127) = 240.12, p < .001 | 0.071 (0.057−0.085) | 0.925 | 0.055 |
| Model D | 11,959.20 | 12,191.06 | X2(134) = 240.66, p < .001 | 0.067 (0.053−0.081) | 0.933 | 0.057 |
Note: Bold values indicate model with best model fit for each measure. Model D is the overall best-fitting model to the data. Abbreviations: RMSEA, root mean square error of approximation; SRMR, standardized root mean square residual; TLI, Tucker Lewis index.
3.3.1 |. Model A: Unconstrained mediation
Model A was specified to assess all possible paths between age and memory with no anatomical or formal structure placed on the mediating pathways (see Figure 5a). While this allows for the most flexible specification of the model and tests all possible paths, it is also the least parsimonious model requiring the greatest number of paths to be estimated. Model A reveals no significant mediation between age and associative memory by either the total indirect effect (Est. = −0.397, 95% CI [−1.527, 0.057]) or specific indirect pathways, however, there are trend effects for the total indirect effect (Est. = −0.405, 90% CI [−1.221, −0.040]) and a specific indirect effect through the fornix pathway (Est. = −0.377, 90% CI [−1.041, −0.032]). Item memory is not significantly mediated by the total indirect effect (Est. = −0.092, 95% CI [−0.926, 0.655]) nor are there significant specific indirect pathways.
3.3.2 |. Model B: Test of mediation through anatomical information processing pathway
Model B was specified such that the MTL variables were constrained following a strict anatomical pathway based on the information flow through the MTL. Thus, the model was constructed such that one path between age and memory through the parahippicompal gyrus and ERC, hippocampal subfields, and fornix, was built with no individual paths to specific anatomy. This model would be more parsimonious, however, it also makes the strong assumption that there is little specificity in the relationship between age, memory, and specific MTL structures. The results showed that the total indirect effect significantly mediated the age-associative memory relationship (Est. = −0.058, 95% CI [−0.360, −0.003]). Model B revealed no significant mediation between age and item memory.
3.3.3 |. Model C: Test of mediation through anatomical information processing pathway and individual paths
In Model C, we specified Model B with the addition of individual pathways between each latent MTL structure and age and memory. This model followed the same logic as in Model B, however, it also tested whether anatomical specificity existed in the mediating relationship present in Model B. The results indicated no significant total indirect effect between age and associative memory (Est. = −0.407, 95% CI [−1.509, 0.054], although there is a trend for this effect (Est. = −0.413, 90% CI [−1.185, −0.067]). There is a significant specific indirect effect through the fornix (Est. = −0.363, 95% CI [−1.121, −0.007]). Again, there is no mediation of the age and item memory relationship.
3.3.4 |. Model D: Test of mediation through anatomical information processing pathway with single hippocampal variable and individual paths
In Model D, we specified Model C with the exception that a single hippocampal latent variable was constructed. Given the disparate findings of both subfield and age and subfield and cognition relationships, we assessed whether subfield-specific volumes were necessary for age and memory mediation, as well as whether they were necessary for good model fit. The results from Model D indicate a significant mediation of the age and associative memory relationship through both the total indirect effect (Est. = −0.365, 95% CI [−0.813, −0.093]) and a specific indirect effect through the fornix (Est. = −0.329, 95% CI [−0.745, −0.064]). There were no significant indirect effects for item memory.
3.3.5 |. Model fit comparison
To assess which model exhibited the best fit and the most parsimonious description of the relationships between age, memory, and brain structure, we compared model fit with Chi-square difference tests implemented in MPlusAutomation (Hallquist & Wiley, 2018), and compared AIC, BIC, SRMR, TLI, and RMSEA (see Table 4). Chi-square difference tests indicated that model A exhibits comparatively better fit to the data than Models B and C (ps < .001) and exhibits better fit than Model D (χ2[11] = 20.97, p = .034). Model B fits significantly worse than all other models (ps < .001) and Models C and D fit the data equally well (χ2[7] = 0.54, p = .999). When comparing other fit indices the results are mixed. According to AIC and BIC, Model D exhibits the best fit for the data, RMSEA shows that Models A and D exhibit equivalent fit, and finally TLI and SRMR show that Model A fits the underlying data the best. Because the fit indices suggest a somewhat equivalent fit for the data between Models A and D, and because Model D is the most parsimonious explanation of the data, we conclude that the structural equation model presented in Model D exhibits the best explanation of the associations of the underlying variables. See Table 5 for total, direct, and indirect effects for Model D. This model shows that the age and associative memory relationship is significantly mediated by the total indirect effect as well as the specific indirect effect through the fornix. Interestingly, while we conclude that Model D is the preferred model, Models A–C show similar patterns of mediation, suggesting the structural variables are relatively robust in their mediation of the age and associative memory relationship.
TABLE 5.
Estimated effects from Model D
| Indirect and direct effects | Standardized estimate | 95% CI |
|---|---|---|
| Age to associative memory | ||
| Total | −0.618 | (−0.708, −0.519)* |
| Total indirect | −0.368 | (−0.838, −0.083)* |
| Specific indirect | ||
| Associative memory on hippocampus on age | −0.001 | (−0.109, 0.075) |
| Associative memory on pre-hippocampus on age | −0.015 | (−0.270, 0.172) |
| Associative memory on fornix on age | −0.330 | (−0.756, −0.055)* |
| Associative memory on hippocampus on pre-hippocampus on age | −0.002 | (−0.164, 0.178) |
| Associative memory on fornix on hippocampus on age | −0.007 | (−0.043, 0.008) |
| Associative memory on fornix on hippocampus on pre-hippocampus on age | −0.012 | (−0.067, 0.008) |
| Direct | ||
| Associative memory on age | −0.251 | (−0.555, 0.247) |
| Age to item memory | ||
| Total | −0.418 | (−0.534, −0.282)* |
| Total indirect | −0.121 | (−0.529, 0.214) |
| Specific indirect | ||
| Item memory on hippocampus on age | −0.045 | (−0.180, 0.042) |
| Item memory on pre-hippocampus on age | 0.114 | (−0.109, 0.378) |
| Item memory on fornix on age | −0.106 | (−0.497, 0.237) |
| Item memory on hippocampus on pre-hippocampus on age | −0.078 | (−0.318, 0.066) |
| Item memory on fornix on hippocampus on age | −0.002 | (−0.024, 0.008) |
| Item memory on fornix on hippocampus on pre-hippocampus on age | −0.004 | (−0.037, 0.011) |
| Direct | ||
| Item memory on age | −0.296 | (−0.649, 0.139) |
Note:
Significant as revealed by bootstrapping with 5,000 iterations and 95% confidence intervals.
3.3.6 |. Model D with quadratic age
While quadratic age effects are of interest, we limit the primary analysis and presentation to linear effects only, as our sample size does not support the number of paths needed for an additional quadratic term. However, to assess the stability of the linear effects presented in Model D in the presence of a quadratic age term, we ran Model D with age-squared regressed on all the same variables as age. Model fit indices indicated good fit for a model with quadratic age (AIC = 11,952.56; BIC = 12,200.30; χ2(147) = 257.55, p < .001; RMSEA = 0.065, 95% CI [0.052–0.078]; TLI = 0.931). Mediating effects presented in the original Model D remained unchanged with the total indirect effect (Est. = −0.461, 95% CI [−1.198, −0.085]), and the specific indirect effect (Est. = −0.424, 95% CI [−1.135, −0.042]), exhibiting the same pattern of effects. There was also a marginally significant total indirect effect (Est. = −0.126, 90% CI [−0.332, −0.015]), from quadratic age to associative memory, and a significant specific indirect effect (Est. = −0.121, 95% CI [−0.386, −0.010]), from the quadratic age to associative memory through the fornix. There were no significant effects on item memory.
4 |. DISCUSSION
Medial temporal lobe structures are thought to be critical for all forms of episodic memory (Squire et al., 2004) with an emphasis on their role in associative memory as compared to item memory (Chalfonte & Johnson, 1996), particularly in older adults (Chalfonte & Johnson, 1996; Naveh-Benjamin, 2000; Old & Naveh-Benjamin, 2008). Further, several prominent theories of MTL function suggest that the parahippocampal cortex and hippocampal subfields play complementary, but unique roles in supporting episodic memory (Rolls, 2016; Yassa & Stark, 2011), especially associative memory (Davachi, 2006; Eichenbaum et al., 2007). Relatedly, the fornix is the major efferent pathway from the hippocampus to the cortex (Duvernoy et al., 2013) and thus likely critical for reactivating retrieved memories (Damasio, 1989; Rugg et al., 2008). The current study assessed the degree to which MTL structures (e.g., volume of MTL cortical and subcortical structures and fornix microstructure) exhibited associations with age, and whether MTL structures mediated the relationship between age and associative and/or item memory.
The results indicate that in our sample, fornix MD exhibits the greatest age-related effect, while the parahippocampal cortex demonstrates the greatest age-related volume differences, where older adults showed smaller volumes. As hypothesized, the ERC exhibited the weakest relationship with age in this healthy lifespan sample. Further, all hippocampal subfields evidenced significant differences in volume across the lifespan, supporting the notion that the disparate findings in the literature are likely explained by sample specific variability. The mediation analysis resulted in three major findings. First, MTL structural variables mediate the relationship between age and associative memory, but not item memory, and this is the case in most models regardless of the pathways specified between the MTL structural variables. Second, in most models, fornix microstructure showed additional mediating specificity indicating that white matter health acts both together with other MTL structures and in isolation as a mediating factor. Third, at least in this healthy aging sample, there does not appear to be subfield specificity between age and memory mediation, and a parsimonious model that utilizes only three latent anatomical constructs (i.e., hippocampal input, hippocampus proper, and hippocampal output) is sufficient to explain the age and associative memory relationship.
Associations between age and hippocampal and parahippocampal volume are generally robust across the literature (Gorbach et al., 2017; Henson et al., 2016; Kennedy et al., 2009; Kennedy & Raz, 2015; Nyberg et al., 2012; Pelletier et al., 2013; Persson et al., 2012), however, subfield-specific age-related differences have been mixed (de Flores, La Joie, et al., 2015). The pattern of results in the current study provides evidence for the hypothesis that there are likely age-related decreases across all subfields with the ERC exhibiting the weakest relationship with age. As in prior research (Bennett et al., 2010; Bennett & Madden, 2014; Burzynska et al., 2010; Douet & Chang, 2015; Lebel et al., 2012; Sala et al., 2012; Sullivan et al., 2010), the current study showed strong associations between measures of fornix diffusion and age.
In accord with prior findings, the current results suggest that the relationship between hippocampal volume and cognition is relatively weak (Van Petten, 2004), as neither subfield-specific volume or hippocampal volume measured as a single construct revealed significant direct associtions to either associative or item memory. Similarly, while the parahippocampal gyrus (PHG) and the PHG/ERC construct tended to show somewhat stronger associations with age as compared to hippocampal subfields, no reliable direct association was found between PHG/ERC and memory in any models (for a similar result see Henson et al., 2016). Thus, while the hippocampus proper and surrounding cortex are thought to be critical structures supporting episodic memory (Rolls, 2016; Scoville & Milner, 1957; Squire et al., 2004; Yassa & Stark, 2011), in the current sample, hippocampal input and hippocampal subfield volume, do not mediate the relationship between age and memory in isolation. Notably, fornix diffusion significantly mediated the relationship between age and associative memory, a finding in line with research consistently showing associations between fornix and memory (Henson et al., 2016; Metzler-Baddeley et al., 2011; Rudebeck et al., 2009). This finding may reflect the critical role reactivation plays in successful episodic memory performance (Damasio, 1989; Rugg et al., 2008). Finally, the results indicate that the combined pathways (i.e., PHG/ERC and hippocampus and fornix) also significantly mediated the relationship between age and associative memory, suggesting a holistic measure of MTL structure is also able to capture the relationship between aging and associative memory decline. This finding is in line with the well established idea that the MTL and hippocampus are critical for successful episodic memory, but also suggests that within the healthy aging brain, there may be little specificity in individual MTL structural contributions to differences in associative memory performance across the lifespan.
Mediation of the age and associative memory, but not item memory performance, suggests that MTL structures do not mediate all forms of mnemonic processes. This result supports a large body of research suggesting item memory is comparatively less dependent on hippocampal processes as compared to associative memory and that associative memory is more sensitive to aging (Bender, Naveh-Benjamin, & Raz, 2010; Chalfonte & Johnson, 1996; Davachi, 2006; Eichenbaum et al., 2007; Naveh-Benjamin, 2000; Old & Naveh-Benjamin, 2008; Spencer & Raz, 1995). Several theories of MTL cortex function suggest that the PHG and ERC may support item memory due to the somewhat easier computational processes required (Rolls, 2016) or because these regions can support familiarity judgments (Eichenbaum et al., 2007; Yonelinas et al., 2007). While the current results suggest that MTL cortex volume and item memory are not related in a healthy lifespan sample, it is possible that this relationship may be present when utilizing tests with more specificity to item memory (although see Henson et al., 2016 for a similar result), or in older or less healthy samples (Yonelinas et al., 2007).
The lack of specificity in the hippocampal subfield findings may partly be a result of the differing number of measurements used to define item versus associative memory. We were able to capitalize on the strength of multiple measures to build an associative memory construct, however, there was only one available test to derive the measures for the item memory construct. Thus, results could differ in the context of a wider assessment of item memory (i.e., beyond CVLT) and associative memory tests. Further, while representative tests for each construct were chosen, a different pattern of results could potentially be found if measures of memory thought to be more specific to hippocampal function were used. For example, previous research using recollection and familiarity (Rudebeck et al., 2009; Yonelinas et al., 2007) or mnemonic similarity tasks (Doxey & Kirwan, 2015) indicated specificity among hippocampal subfields or subcortical/cortical regions in their relationship to memory. However, these studies were limited in either the regions utilized (e.g., hippocampus only, subfields and ERC only, etc.) or the analyses did not incorporate all regions simultaneously. Thus, while the selection of memory tests may be a limitation in the current context, similar patterns of results may be found in analyses that incorporate all regions simultaneously, regardless of the type of memory measure used.
It will also be important for future research with larger samples to assess how other brain regions, including both gray and white matter, may contribute to age-related differences in memory performance. We were limited by both our sample size and theoretical constraints to only one white matter tract and to volumetric measures of hippocampal subfields and surrounding cortex. Including additional white matter regions may reveal greater specificity between gray matter volume and white matter, as well as greater specificity between separate white matter tracts in supporting memory performance across the lifespan.
As is the case in all cross-sectional studies, we are limited in our ability to draw strong conclusions about mediation (Lindenberger, von Oertzen, Ghisletta, & Hertzog, 2011). Despite this fact, it is critical to build as complete a picture as possible of age, brain, and cognition relationships that can be tested more fully in a longitudinal study. Further, many longitudinal studies have reported similar patterns of brain–cognition aging associations (Golomb et al., 1996; Persson et al., 2006; Rodrigue & Raz, 2004), although these studies have been limited in the number of regions investigated and the types of cognitive measures included. Despite this limitation, multivariate analyses in the form of structural equation models allow for the testing of complex relationships in the context of multiple indicators and multiple outcomes. For example, in the current analysis, many predictors of item and associative memory were tested simultaneously, allowing for inferences to be made about the differences in the pattern of relationships between the two forms of memory, which would not be possible within the framework of a univariate analysis.
5 |. CONCLUSIONS
Advancing age exerts a negative effect on the structural integrity of the MTL components including the hippocampal subfields and the input and output connectivity to the rest of the cortex through parahippocampa and entorhinal cortices, and fornix. Although increased age was significantly associated with lower volume and altered fornix white matter diffusion, fornix microstructure appears to be especially sensitive to the aging process. In the current lifespan sample, hippocampal subfield volumes, surrounding cortical regions, and fornix white matter mediated the relationship between age and associative, but not item, memory. Specifically, across four specifications of a structural equation model, it was consistently observed that fornix white matter microstructure strongly mediated the relationship between age and associative memory, as did the combined influence of all MTL structures. Thus, aging of associative memory depends upon the maintained structural connectivity of the fornix output pathways, in particular, but also on the general preservation of MTL tissue spanning MTL input, hippocampal subfields, and output. These findings highlight the importance of studying entire systems, rather than individual brain regions, when assessing the impact of brain structure on cognitive aging.
ACKNOWLEDGMENTS
This study was supported in part by grants from the National Institutes of Health: R00 AG036818, R00 AG036848, and R01 AG056535. The authors would like to thank Allen Kalich for assistance with manual tracing of hippocampal subfields and Elizabeth Reese and Giuseppe Miranda for Freesurfer processing and manual edits. We also appreciate consultation from Ana Daugherty on hippocampal subfield boundary demarcation.
Funding information
National Institute on Aging, Grant/Award Numbers: R00 AG036818, R00 AG036848, R01 AG056535
REFERENCES
- Bender AR, Naveh-Benjamin M, & Raz N (2010). Associative deficit in recognition memory in a lifespan sample of healthy adults. Psychology and Aging, 25(4), 940–948. 10.1037/a0020595 [DOI] [PMC free article] [PubMed] [Google Scholar]
- Bender AR, Prindle JJ, Brandmaier AM, & Raz N (2016). White matter and memory in healthy adults: Coupled changes over two years. NeuroImage, 131, 193–204. 10.1016/j.neuroimage.2015.10.085 [DOI] [PMC free article] [PubMed] [Google Scholar]
- Bennett IJ, & Madden DJ (2014). Disconnected aging: Cerebral white matter integrity and age-related differences in cognition. Neuroscience, 276, 187–205. 10.1016/j.neuroscience.2013.11.026 [DOI] [PMC free article] [PubMed] [Google Scholar]
- Bennett IJ, Madden DJ, Vaidya CJ, Howard DV, & Howard JH (2010). Age-related differences in multiple measures of white matter integrity: A diffusion tensor imaging study of healthy aging. Human Brain Mapping, 31(3), 378–390. 10.1002/hbm.20872 [DOI] [PMC free article] [PubMed] [Google Scholar]
- Bland JM, & Altman DG (1986). Statistical methods for assessing agreement between two methods of clinical measurement. Lancet, 327, 307–310. 10.1016/S0140-6736(86)90837-8 [DOI] [PubMed] [Google Scholar]
- Bland JM, & Altman DG (1999). Measuring agreement in method comparison studies. Statistical Methods in Medical Research, 8(2), 135–160. 10.1177/096228029900800204 [DOI] [PubMed] [Google Scholar]
- Brickman AM, & Stern Y (2009). Aging and memory in humans. Academic Press. In Encyclopedia of neuroscience (pp. 175–180). [Google Scholar]
- Burzynska AZ, Preuschhof C, Bäckman L, Nyberg L, Li SC, Lindenberger U, & Heekeren HR (2010). Age-related differences in white matter microstructure: Region-specific patterns of diffusivity. NeuroImage, 49(3), 2104–2112. 10.1016/j.neuroimage.2009.09.041 [DOI] [PubMed] [Google Scholar]
- Carr VA, Bernstein JD, Favila SE, Rutt BK, Kerchner GA, & Wagner AD (2017). Individual differences in associative memory among older adults explained by hippocampal subfield structure and function. Proceedings of the National Academy of Sciences of the United States of America, 114(45), 12075–12080. 10.1073/pnas.1713308114 [DOI] [PMC free article] [PubMed] [Google Scholar]
- Chalfonte BL, & Johnson MK (1996). Feature memory and binding in young and older adults. Memory and Cognition, 24(4), 403–416. 10.3758/BF03200930 [DOI] [PubMed] [Google Scholar]
- Dale AM, Fischl B, & Sereno MI (1999). Cortical surface-based analysis: I. Segmentation and surface reconstruction. NeuroImage, 9(2), 179–194. 10.1006/nimg.1998.0395 [DOI] [PubMed] [Google Scholar]
- Damasio AR (1989). Time-locked multiregional retroactivation: A systems level-proposal for the neural substrates of recall and recognition. Cognition, 33, 25–62. 10.1016/0010-0277(89)90005-X [DOI] [PubMed] [Google Scholar]
- Daugherty AM, Bender AR, Raz N, & Ofen N (2016). Age differences in hippocampal subfield volumes from childhood to late adulthood, 228, 220–228. 10.1002/hipo.22517 [DOI] [PMC free article] [PubMed] [Google Scholar]
- Daugherty AM, Flinn R, & Ofen N (2017). NeuroImage hippocampal CA3-dentate gyrus volume uniquely linked to improvement in associative memory from childhood to adulthood. NeuroImage, 153(December 2016), 75–85. 10.1016/j.neuroimage.2017.03.047 [DOI] [PMC free article] [PubMed] [Google Scholar]
- Davachi L (2006). Item, context and relational episodic encoding in humans. Current Opinion in Neurobiology, 16(6), 693–700. 10.1016/j.conb.2006.10.012 [DOI] [PubMed] [Google Scholar]
- de Flores R, La Joie R, & Chételat G (2015). Structural imaging of hippocampal subfields in healthy aging and Alzheimer’s disease. Neuroscience, 309, 29–50. 10.1016/j.neuroscience.2015.08.033 [DOI] [PubMed] [Google Scholar]
- de Flores R, La Joie R, Landeau B, Perrotin A, Mézenge F, de La Sayette V, … Chételat G (2015). Effects of age and Alzheimer’s disease on hippocampal subfields. Human Brain Mapping, 36(2), 463–474. 10.1002/hbm.22640 [DOI] [PMC free article] [PubMed] [Google Scholar]
- Delis DC, Kramer JH, Kaplan E, & Ober BA (2000). California verbal learning test—Second edition. Adult version. Manual. San Antonio, TX: Psychological Corporation. [Google Scholar]
- Desikan RS, Ségonne F, Fischl B, Quinn BT, Dickerson BC, Blacker D, … Killiany RJ (2006). An automated labeling system for subdividing the human cerebral cortex on MRI scans into gyral based regions of interest. NeuroImage, 31(3), 968–980. 10.1016/j.neuroimage.2006.01.021 [DOI] [PubMed] [Google Scholar]
- Dickerson BC, Feczko E, Augustinack JC, Pacheco J, Morris JC, Fischl B, & Buckner RL (2009). Differential effects of aging and Alzheimer’s disease on medial temporal lobe cortical thickness and surface area. Neurobiology of Aging, 30(3), 432–440. 10.1016/j.neurobiolaging.2007.07.022 [DOI] [PMC free article] [PubMed] [Google Scholar]
- Douet V, & Chang L (2015). Fornix as an imaging marker for episodic memory deficits in healthy aging and in various neurological disorders. Frontiers in Aging Neuroscience, 7(Jan), 1–19. 10.3389/fnagi.2014.00343 [DOI] [PMC free article] [PubMed] [Google Scholar]
- Doxey CR, & Kirwan CB (2015). Structural and functional correlates of behavioral pattern separation in the hippocampus and medial temporal lobe. Hippocampus, 25(4), 524–533. 10.1002/hipo.22389 [DOI] [PubMed] [Google Scholar]
- Dubois B, Hampel H, Feldman HH, Scheltens P, Aisen P, Andrieu S, … Jack CR (2016). Preclinical Alzheimer’s disease: Definition, natural history, and diagnostic criteria. Alzheimer’s and Dementia, 12(3), 292–323. 10.1016/j.jalz.2016.02.002 [DOI] [PMC free article] [PubMed] [Google Scholar]
- Duvernoy HM, Cattin F, & Risold P-Y (2013). The human hippocampus. New York: Springer. [Google Scholar]
- Eichenbaum H, Yonelinas AP, & Ranganath C (2007). The medial temporal lobe and recognition memory. Annual Review of Neuroscience, 30 (1), 123–152. 10.1146/annurev.neuro.30.051606.094328 [DOI] [PMC free article] [PubMed] [Google Scholar]
- Ezzati A, Katz MJ, Lipton ML, Zimmerman ME, & Lipton RB (2016). Hippocampal volume and cingulum bundle fractional anisotropy are independently associated with verbal memory in older adults. Brain Imaging and Behavior, 10(3), 652–659. 10.1007/s11682-015-9452-y [DOI] [PMC free article] [PubMed] [Google Scholar]
- Fischl B, & Dale AM (2000). Measuring the thickness of the human cerebral cortex from magnetic resonance images. Proceedings of the National Academy of Sciences of the United States of America, 97(20), 11050–11055. 10.1073/pnas.200033797 [DOI] [PMC free article] [PubMed] [Google Scholar]
- Fletcher E, Raman M, Huebner P, Liu A, Mungas D, Carmichael O, & DeCarli C (2013). Loss of fornix white matter volume as a predictor of cognitive impairment in cognitively normal elderly individuals. JAMA Neurology, 70(11), 1389–1395. 10.1001/jamaneurol.2013.3263 [DOI] [PMC free article] [PubMed] [Google Scholar]
- Folstein MF, Folstein SE, & McHugh PR (1975). “Mini-mental state”. A practical method for grading the cognitive state of patients for the clinician. Journal of Psychiatric Research, 12(3), 189–198. 10.1016/0022-3956(75)90026-6 [DOI] [PubMed] [Google Scholar]
- Gazes Y, Li P, Sun E, Razlighi Q, & Tsapanou A (2018). Age specificity in fornix-to-hippocampus association. Brain Imaging and Behavior, 1 (2016), 1–9. 10.1007/s11682-018-9958-1 [DOI] [PMC free article] [PubMed] [Google Scholar]
- Golomb J, Kluger A, de Leon MJ, Ferris SH, Convit A, Mittelman MS, … George AE (1994). Hippocampal formation size in normal human aging: A correlate of delayed secondary memory performance. Learning & Memory, 1(1), 45–54. 10.1101/lm.1.1.45 [DOI] [PubMed] [Google Scholar]
- Golomb J, Kluger A, de Leon MJ, Ferris SH, Mittelman M, Cohen J, & George AE (1996). Hippocampal formation size predicts declining memory performance in normal aging. Neurology, 47(3), 810–813. [DOI] [PubMed] [Google Scholar]
- Golomb J, De Leon MJ, Kluger A, George AE, Tarshish C, & Ferris SH (1993). Hippocampal atrophy in aging memory impairment. JAMA Neurology, 50, 967–973. [DOI] [PubMed] [Google Scholar]
- Gorbach T, Pudas S, Lundquist A, Orädd G, Josefsson M, Salami A, … Nyberg L (2017). Longitudinal association between hippocampus atrophy and episodic-memory decline. Neurobiology of Aging, 51, 167–176. 10.1016/j.neurobiolaging.2016.12.002 [DOI] [PubMed] [Google Scholar]
- Hallquist MN, & Wiley JF (2018). MplusAutomation : An R package for facilitating large-scale latent variable analyses in M plus. Structural Equation Modeling: A Multidisciplinary Journal, 25(4), 621–638. 10.1080/10705511.2017.1402334 [DOI] [PMC free article] [PubMed] [Google Scholar]
- Henson RN, Campbell KL, Davis SW, Taylor JR, Emery T, Erzinclioglu S, … Villis L (2016). Multiple determinants of lifespan memory differences. Scientific Reports, 6(August), 1–14. 10.1038/srep32527 [DOI] [PMC free article] [PubMed] [Google Scholar]
- Hua K, Zhang J, Wakana S, Jiang H, Li X, Reich DS, … Mori S (2008). Tract probability maps in stereotaxic spaces: Analyses of white matter anatomy and tract-specific quantification. NeuroImage, 39(1), 336–347. 10.1016/j.neuroimage.2007.07.053 [DOI] [PMC free article] [PubMed] [Google Scholar]
- Jack CR, Bennett DA, Blennow K, Carrillo MC, Feldman HH, Frisoni GB, … Dubois B (2016). A/T/N: An unbiased descriptive classification scheme for Alzheimer disease biomarkers. Neurology, 87 (5), 539–547. 10.1212/WNL.0000000000002923 [DOI] [PMC free article] [PubMed] [Google Scholar]
- Jack CR, Knopman DS, Jagust WJ, Shaw LM, Aisen PS, Weiner MW, … Trojanowski JQ (2010). Hypothetical model of dynamic biomarkers of the Alzheimer’s pathological cascade. The Lancet Neurology, 9(1), 119–128. 10.1016/S1474-4422(09)70299-6 [DOI] [PMC free article] [PubMed] [Google Scholar]
- Kantarci K (2014). Fractional anisotropy of the fornix and hippocampal atrophy in Alzheimer’s disease. Frontiers in Aging Neuroscience, 6(Oct), 1–4. 10.3389/fnagi.2014.00316 [DOI] [PMC free article] [PubMed] [Google Scholar]
- Kennedy KM, Erickson KI, Rodrigue KM, Voss MW, Colcombe SJ, Kramer AF, … Raz N (2009). Age-related differences in regional brain volumes: A comparison of optimized voxel-based morphometry to manual volumetry. Neurobiology of Aging, 30(10), 1657–1676. 10.1016/j.neurobiolaging.2007.12.020 [DOI] [PMC free article] [PubMed] [Google Scholar]
- Kennedy KM, & Raz N (2009). Aging white matter and cognition: Differential effects of regional variations in diffusion properties on memory, executive functions, and speed. Neuropsychologia, 47(3), 916–927. 10.1016/j.neuropsychologia.2009.01.001 [DOI] [PMC free article] [PubMed] [Google Scholar]
- Kennedy KM, & Raz N (2015). Normal aging of the brain. In Brain mapping: An encyclopedic reference Elsevier. 10.1016/B978-0-12-397025-1.00068-3. [DOI] [Google Scholar]
- Lebel C, Gee M, Camicioli R, Wieler M, Martin W, & Beaulieu C (2012). Diffusion tensor imaging of white matter tract evolution over the lifespan. NeuroImage, 60(1), 340–352. 10.1016/j.neuroimage.2011.11.094 [DOI] [PubMed] [Google Scholar]
- Leemans A, & Jones DK (2009). The B-matrix must be rotated when correcting for subject motion in DTI data. Magnetic Resonance in Medicine, 61(6), 1336–1349. 10.1002/mrm.21890 [DOI] [PubMed] [Google Scholar]
- Lindenberger U, von Oertzen T, Ghisletta P, & Hertzog C (2011). Cross-sectional age variance extraction: What’s change got to do with it? Psychology and Aging, 26(1), 34–47. 10.1037/a0020525 [DOI] [PubMed] [Google Scholar]
- Lister JP, & Barnes CA (2009). Neurobiological changes in the hippocampus during normative aging. Archives of Neurology, 66(7), 829–833. 10.1001/archneurol.2009.125 [DOI] [PubMed] [Google Scholar]
- Liu Z, Wang Y, Gerig G, Gouttard S, Tao R, Fletcher T, & Styner M (2010). Quality control of diffusion weighted images. Proc. SPIE—Int. Soc. Opt. Eng 7628, 76280J–76280J–9. 10.1117/12.844748 [DOI] [PMC free article] [PubMed] [Google Scholar]
- Madden DJ, Bennett IJ, Burzynska A, Potter GG, Chen NK, & Song AW (2012). Diffusion tensor imaging of cerebral white matter integrity in cognitive aging. Biochimica et Biophysica Acta—Molecular Basis of Disease, 1822(3), 386–400. 10.1016/j.bbadis.2011.08.003 [DOI] [PMC free article] [PubMed] [Google Scholar]
- Marr D (1971). Simple memory: A theory for Archicortex. Philosophical Transactions of the Royal Society B: Biological Sciences, 262(841), 23–81. 10.1098/rstb.1971.0078 [DOI] [PubMed] [Google Scholar]
- McClelland JL, McNaughton BL, & O’Reilly RC (1995). Why there are complementary learning systems in the hippocampus and neocortex: Insights from the successes and failures of connectionist models of learning and memory. Psychological Review, 102(3), 419–457. 10.1037/0033-295X.102.3.419 [DOI] [PubMed] [Google Scholar]
- McGraw K, & Wong S (1996). Forming inferences about some intraclass correlation coefficients. Psychological Methods, 1(1), 30–46. [Google Scholar]
- Metzler-Baddeley C, Jones DK, Belaroussi B, Aggleton JP, & O’Sullivan MJ (2011). Frontotemporal connections in episodic memory and aging: A diffusion MRI tractography study. Journal of Neuroscience, 31(37), 13236–13245. 10.1523/JNEUROSCI.2317-11.2011 [DOI] [PMC free article] [PubMed] [Google Scholar]
- Mueller SG, Stables L, Du AT, Schuff N, Truran D, Cashdollar N, & Weiner MW (2007). Measurement of hippocampal subfields and age-related changes with high resolution MRI at 4 T. Neurobiology of Aging, 28(5), 719–726. 10.1016/j.neurobiolaging.2006.03.007 [DOI] [PMC free article] [PubMed] [Google Scholar]
- Mueller SG, & Weiner MW (2009). Selective effect of age, Apo e4, and Alzheimer’s disease on hippocampal subfields. Hippocampus, 19(6), 558–564. 10.1002/hipo.20614 [DOI] [PMC free article] [PubMed] [Google Scholar]
- Muthén LK, & Muthén BO (2017). Mplus user’s guide (Eigth). Los Angeles, CA: Muthén & Muthén. [Google Scholar]
- Naveh-Benjamin M (2000). Adult age differences in memory performance: Tests of an associative deficit hypothesis. Journal of Experimental Psychology: Learning, Memory, and Cognition, 26(5), 1170–1187. 10.1037//0278-7393.26.5.1170 [DOI] [PubMed] [Google Scholar]
- Nyberg L, Lövdén M, Riklund K, Lindenberger U, & Bäckman L (2012). Memory aging and brain maintenance. Trends in Cognitive Sciences, 16(5), 292–305. 10.1016/j.tics.2012.04.005 [DOI] [PubMed] [Google Scholar]
- O’Reilly RC, Bhattacharyya R, Howard MD, & Ketz N (2011). Complementary learning systems. Cognitive Science, 38(6), 1229–1248. 10.1111/j.1551-6709.2011.01214.x [DOI] [PubMed] [Google Scholar]
- Old SR, & Naveh-Benjamin M (2008). Differential effects of age on item and associative measures of memory: A meta-analysis. Psychology and Aging, 23(1), 104–118. 10.1037/0882-7974.23.1.104 [DOI] [PubMed] [Google Scholar]
- Olsen RK, Carr VA, Daugherty AM, La Joie R, Amaral RSC, Amunts K, … Wisse LEM (in press). Progress update from the hippocampal subfields group. Alzheimer’s & Dementia: Diagnosis, Assessment & Disease Monitoring, 11, 439–449. 10.1016/j.dadm.2019.04.001. [DOI] [PMC free article] [PubMed] [Google Scholar]
- Park DC, & Reuter-Lorenz P (2009). The adaptive brain: Aging and neurocognitive scaffolding. Annual Review of Psychology, 60(1), 173–196. 10.1146/annurev.psych.59.103006.093656 [DOI] [PMC free article] [PubMed] [Google Scholar]
- Pelletier A, Periot O, Dilharreguy B, Hiba B, Bordessoules M, Pérès K, … Catheline G (2013). Structural hippocampal network alterations during healthy aging: A multi-modal MRI study. Frontiers in Aging Neuroscience, 5(Dec), 1–10. 10.3389/fnagi.2013.00084 [DOI] [PMC free article] [PubMed] [Google Scholar]
- Persson J, Nyberg L, Lind J, Larsson A, Nilsson L-G, Ingvar M, & Buckner RL (2006). Structure–function correlates of cognitive decline in aging. Cerebral Cortex, 16(7), 907–915. 10.1093/cercor/bhj036 [DOI] [PubMed] [Google Scholar]
- Persson J, Pudas S, Lind J, Kauppi K, Nilsson LG, & Nyberg L (2012). Longitudinal structure-function correlates in elderly reveal MTL dysfunction with cognitive decline. Cerebral Cortex, 22(10), 2297–2304. 10.1093/cercor/bhr306 [DOI] [PubMed] [Google Scholar]
- Radloff LS (1977). A self-report depression scale for research in the general population. Applied Psychological Measurement, 1(3), 385–401. 10.1177/014662167700100306 [DOI] [Google Scholar]
- Raz N, Daugherty AM, Bender AR, Dahle CL, & Land S (2015). Volume of the hippocampal subfields in healthy adults: Differential associations with age and a pro-inflammatory genetic variant. Brain Structure and Function, 220(5), 2663–2674. 10.1007/s00429-014-0817-6 [DOI] [PMC free article] [PubMed] [Google Scholar]
- Raz N, Lindenberger U, Rodrigue KM, Kennedy KM, Head D, Williamson A, … Acker JD (2005). Regional brain changes in aging healthy adults: General trends, individual differences and modifiers. Cerebral Cortex, 15(11), 1676–1689. 10.1093/cercor/bhi044 [DOI] [PubMed] [Google Scholar]
- Raz N, Rodrigue KM, Head D, Kennedy KM, & Acker JD (2004). Differential aging of the medial temporal lobe: A study of a five-year change. Neurology, 62(3), 433–438. [DOI] [PubMed] [Google Scholar]
- Rodrigue KM, & Raz N (2004). Shrinkage of the entorhinal cortex over five years predicts memory performance in healthy adults. Journal of Neuroscience, 24(4), 956–963. 10.1523/JNEUROSCI.4166-03.2004 [DOI] [PMC free article] [PubMed] [Google Scholar]
- Rolls ET (2016). Pattern completion and pattern separation mechanisms in the hippocampus In: Jackson P, Chiba A, Berman R, Ragozzino M (eds), The neurobiological basis of memory (pp. 77–113). [Google Scholar]
- Rudebeck SR, Scholz J, Millington R, Rohenkohl G, Johansen-Berg H, & Lee ACH (2009). Fornix microstructure correlates with recollection but not familiarity memory. Journal of Neuroscience, 29(47), 14987–14992. 10.1523/JNEUROSCI.4707-09.2009 [DOI] [PMC free article] [PubMed] [Google Scholar]
- Rugg MD, Johnson JD, Park H, & Uncapher MR (2008). Encoding retrieval overlap in human episodic memory: A functional neuroimaging perspective. Progress in Brain Research, 169, 339–352. [DOI] [PubMed] [Google Scholar]
- Sala S, Agosta F, Pagani E, Copetti M, Comi G, & Filippi M (2012). Microstructural changes and atrophy in brain white matter tracts with aging. Neurobiology of Aging, 33(3), 488–498.e2. 10.1016/j.neurobiolaging.2010.04.027 [DOI] [PubMed] [Google Scholar]
- Sasson E, Doniger GM, Pasternak O, Tarrasch R, & Assaf Y (2012). Structural correlates of cognitive domains in normal aging with diffusion tensor imaging. Brain Structure and Function, 217(2), 503–515. 10.1007/s00429-011-0344-7 [DOI] [PubMed] [Google Scholar]
- Scoville WB, & Milner B (1957). Loss of recent memory after bilateral hippocampal lesions. Journal of Neurology, Neurosurgery & Psychiatry, 20(1), 11–21. 10.1136/jnnp.20.1.11 [DOI] [PMC free article] [PubMed] [Google Scholar]
- Shing YL, Rodrigue KM, Kennedy KM, Fandakova Y, Bodammer N, Werkle-Bergner M, … Raz N (2011). Hippocampal subfield volumes: Age, vascular risk, and correlation with associative memory. Frontiers in Aging Neuroscience, 3(Jan), 1–8. 10.3389/fnagi.2011.00002 [DOI] [PMC free article] [PubMed] [Google Scholar]
- Smith SM (2002). Fast robust automated brain extraction. Human Brain Mapping, 17(3), 143–155. 10.1002/hbm.10062 [DOI] [PMC free article] [PubMed] [Google Scholar]
- Smith SM, Jenkinson M, Woolrich MW, Beckmann CF, Behrens TEJ, Johansen-Berg H, … Matthews PM (2004). Advances in functional and structural MR image analysis and implementation as FSL. NeuroImage, 23(SUPPL. 1), 208–219. 10.1016/j.neuroimage.2004.07.051 [DOI] [PubMed] [Google Scholar]
- Spencer WD, & Raz N (1995). Differential effects of aging on memory for content and context: A meta-analysis. Psychology and Aging, 10(4), 527–539. 10.1037/0882-7974.10.4.527 [DOI] [PubMed] [Google Scholar]
- Squire LR, Stark CEL, & Clark RE (2004). The medial temporal lobe. Annual Review of Neuroscience, 27(1), 279–306. 10.1146/annurev.neuro.27.070203.144130 [DOI] [PubMed] [Google Scholar]
- Sullivan EV, Rohlfing T, & Pfefferbaum A (2010). Quantitative fiber tracking of lateral and interhemispheric white matter systems in normal aging: Relations to timed performance. Neurobiology of Aging, 31 (3), 464–481. 10.1016/j.neurobiolaging.2008.04.007 [DOI] [PMC free article] [PubMed] [Google Scholar]
- Tromp D, Dufour A, Lithfous S, Pebayle T, & Després O (2015). Episodic memory in normal aging and Alzheimer disease: Insights from imaging and behavioral studies. Ageing Research Reviews, 24, 232–262. 10.1016/j.arr.2015.08.006 [DOI] [PubMed] [Google Scholar]
- Van Petten C (2004). Relationship between hippocampal volume and memory ability in healthy individuals across the lifespan: Review and meta-analysis. Neuropsychologia, 42(10), 1394–1413. 10.1016/j.neuropsychologia.2004.04.006 [DOI] [PubMed] [Google Scholar]
- Wang W-C, Daselaar SM, & Cabeza R (2017). Episodic memory decline and healthy aging In Learning and memory: A comprehensive reference (2nd ed., pp. 475–497). Amsterdam: Elsevier; 10.1016/B978-0-12-809324-5.21093-6 [DOI] [Google Scholar]
- Wechsler D (2009). Wechsler memory scale (3rd ed.). San Antonio, TX:Psychological Corporation. [Google Scholar]
- Wisse LEM, Daugherty AM, Olsen RK, Berron D, Carr VA, Stark CEL, … Joie R (2017). Harmonized segmentation protocol for hippocampal and parahippocampal subregions: Why do we need one and what are the key goals? Hippocampus, 27, 3–11. 10.1002/hipo.22671 [DOI] [PMC free article] [PubMed] [Google Scholar]
- Woodcock RW, McGrew KS, & Mather N (2007). Woodcock Johnson III. Rolling Meadows, IL: Riverside. [Google Scholar]
- Yang X, Goh A, Chen S-HA, & Qiu A (2013). Evolution of hippocampal shapes across the human lifespan. Human Brain Mapping, 34(11), 3075–3085. 10.1002/hbm.22125 [DOI] [PMC free article] [PubMed] [Google Scholar]
- Yassa MA, & Stark CEL (2011). Pattern separation in the hippocampus. Trends in Neurosciences, 34(10), 515–525. 10.1016/j.tins.2011.06.006 [DOI] [PMC free article] [PubMed] [Google Scholar]
- Yeh FC, Verstynen TD, Wang Y, Fernández-Miranda JC, & Tseng WYI (2013). Deterministic diffusion fiber tracking improved by quantitative anisotropy. PLoS ONE, 8(11), 1–16. 10.1371/journal.pone.0080713 [DOI] [PMC free article] [PubMed] [Google Scholar]
- Yonelinas AP, Widaman K, Mungas D, Reed B, Weiner MW, & Chui HC (2007). Memory in the aging brain: Doubly dissociating the contribution of the hippocampus and entorhinal cortex. Hippocampus, 17(11), 1134–1140. 10.1002/hipo.20341 [DOI] [PMC free article] [PubMed] [Google Scholar]
- Yushkevich PA, Amaral RSC, Augustinack JC, Bender AR, Bernstein JD, Boccardi M, … Zeineh MM (2015). Quantitative comparison of 21 protocols for labeling hippocampal subfields and parahippocampal subregions in in vivo MRI: Towards a harmonized segmentation protocol. NeuroImage, 111, 526–541. 10.1016/j.neuroimage.2015.01.004 [DOI] [PMC free article] [PubMed] [Google Scholar]
- Yushkevich PA, Pluta JB, Wang H, Xie L, Ding SL, Gertje EC, … Wolk DA (2015). Automated volumetry and regional thickness analysis of hippocampal subfields and medial temporal cortical structures in mild cognitive impairment. Human Brain Mapping, 36(1), 258–287. 10.1002/hbm.22627 [DOI] [PMC free article] [PubMed] [Google Scholar]
- Yushkevich PA, Wang H, Pluta J, Das SR, Craige C, Avants BB, … Mueller S (2010). Nearly automatic segmentation of hippocampal subfields in in vivo focal T2-weighted MRI. NeuroImage, 53(4), 1208–1224. 10.1016/j.neuroimage.2010.06.040 [DOI] [PMC free article] [PubMed] [Google Scholar]
- Ziegler G, Dahnke R, Jäncke L, Yotter RA, May A, & Gaser C (2012). Brain structural trajectories over the adult lifespan. Human Brain Mapping, 33(10), 2377–2389. 10.1002/hbm.21374 [DOI] [PMC free article] [PubMed] [Google Scholar]