Abstract
Dysregulation of the mammalian target of rapamycin (mTOR) signaling, which is mediated by two structurally and functionally distinct complexes mTORC1 and mTORC2, has been implicated in several neurological disorders1-3. Individuals carrying loss-of-function mutations in the phosphatase and tensin homolog (PTEN) gene, a negative regulator of mTOR signaling, are prone to developing macrocephaly, autism spectrum disorder (ASD), seizures and intellectual disability2,4,5. It is generally believed that the neurological symptoms associated with loss of PTEN and other mTORopathies (e.g., mutations in the tuberous sclerosis genes TSC1 or TSC2) are due to hyperactivation of mTORC1-mediated protein synthesis1,2,4,6,7. Using molecular genetics, we unexpectedly found that genetic deletion of mTORC2 (but not mTORC1) activity prolonged lifespan, suppressed seizures, rescued ASD-like behaviors and long-term memory, and normalized metabolic changes in the brain of mice lacking Pten. In a more therapeutically oriented approach, we found that administration of an antisense oligonucleotide (ASO) targeting mTORC2’s defining component Rictor specifically inhibits mTORC2 activity and reverses the behavioral and neurophysiological abnormalities in adolescent Pten-deficient mice. Collectively, our findings indicate that mTORC2 is the major driver underlying the neuropathophysiology associated with Pten-deficiency, and its therapeutic reduction could represent a promising and broadly effective translational therapy for neurological disorders where mTOR signaling is dysregulated.
Keywords: Autism spectrum disorder, memory, social behavior, mTOR complexes, protein synthesis, epilepsy
Main
The mammalian target of rapamycin (mTOR, now defined as the mechanistic target of rapamycin) is a highly conserved signaling hub integrating a variety of synaptic inputs in the brain3,8. mTOR forms two distinct protein complexes, known as mTOR complex 1 (mTORC1) and 2 (mTORC2)9,10 (Fig. 1a). mTORC1 is defined by the adaptor protein raptor (regulatory-associated protein of mTOR) and is rapamycin-sensitive. In contrast, mTORC2, which was more recently discovered, contains rictor11 (rapamycin-insensitive companion of mTOR)9,10 and is insensitive to acute rapamycin treatment.
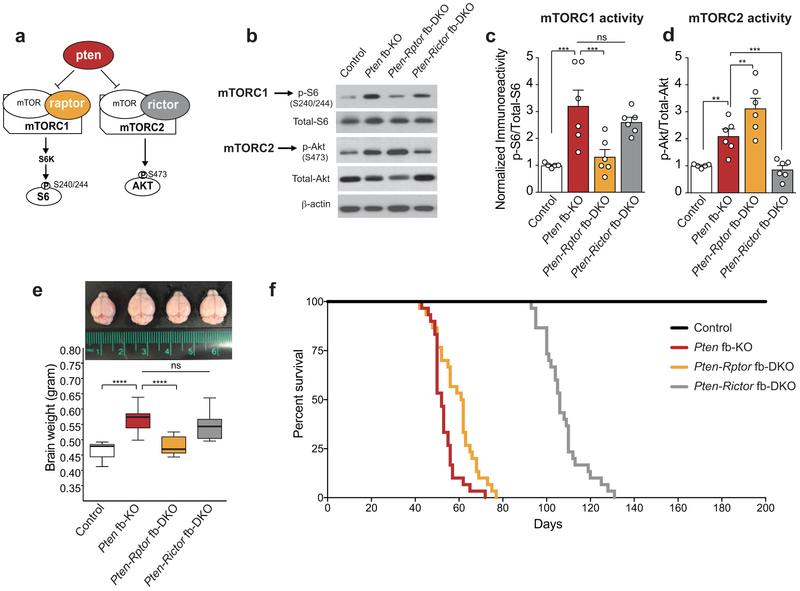
Figure 1. Genetic inhibition of mTORC1 (but not mTORC2) reverses increase in brain size, while genetic inhibition of mTORC2 (but not mTORC1) prolongs survival in Pten fb-KO mice.
(a) Schematic of mTORC1 and mTORC2 signaling pathways. (b-d) Representative western blots (b) and quantification (c-d) show increased mTORC1 (p-S6 at S240/244) and mTORC2 activity (p-Akt at S473) in hippocampus of Pten fb-KO mice compared to control mice [control (n = 5), Pten fb-KO (n = 6); p-S6: t = 4.36, P = 0.0003, p-Akt: t = 3.08, P = 0.0062]. The increased mTORC1 activity in the hippocampus of Pten fb-KO mice was reduced in Pten-Rptor fb-DKO mice (n = 6, Pten-fb-KO vs. Pten-Rptor fb-DKO, t = 4.41, P =0.0003), but not in Pten-Rictor fb-DKO mice (n = 6, Pten-fb-KO vs. Pten-Rictor fb-DKO, t = 1.05, P = 0.3050). By contrast, the increased mTORC2 activity in Pten fb-KO mice was reduced in Pten-Rictor fb-DKO mice (Pten-fb-KO vs. Pten-Rictor fb-DKO, t = 4.41, P = 0.0003), but not in Pten-Rptor fb-DKO mice (Pten-fb-KO vs. Pten-Rptor fb-DKO, t = 3.11, P =0.0058). Statistics were based on onw-way ANOVA (two-tailed) followed by uncorrected Fisher’s LSD. Data are presented as mean ± SEM (e) Compared to control mice, Pten fb-KO mice exhibit macrocephaly [control (n = 11) vs. Pten fb-KO (n = 9), t = 6.42, P < 0.0001], which was rescued in Pten-Rptor fb-DKO mice (n = 8, Pten fb-KO vs. Pten-Rptor fb-DKO, t = 5.23, P < 0.0001; control vs. Pten-Rptor fb-DKO, t = 0.74, P = 0.4631), but not in Pten-Rictor fb-DKO mice (n = 11, Pten fb-KO vs. Pten-Rictor fb-DKO, t = 1.35, P = 0.1834). The box plot presents the median, 25th percentile, 75th percentile, minimum, and maximum values of the group. . Statistics are based on one-way ANOVA followed by uncorrected Fisher’s LSD method (two-tailed) for pairwise comparisons. (f) Survival curves show that lifespan in Pten-Rictor fb-DKO mice is significantly increased compared to Pten fb-KO mice and Pten-Rptor fb-DKO mice (n = 30 per group, two-sided Log-Rank test, P < 0.0001). n.s., not significant.
mTORC1 is a central regulator of protein synthesis in the brain12,13. In monogenic mTORopathies, including those associated with loss-of-function mutations in PTEN, mTORC1 activity is up-regulated1-4,8,14. Given that rapamycin-mediated inhibition of mTORC1 activity has been shown to improve the behavioral and neurophysiological abnormalities in Pten-deficient mice15-17, the current view in the field posits that excessive protein synthesis caused by hyperactivation of mTORC1 is the leading cause of epilepsy and autism-like phenotypes in mTORopathies1,2,4,6,7,14. However, in the brain of individuals with PTEN-deficiency and mice lacking Pten, mTORC2 activity is also up-regulated4,15,17. More importantly, while originally thought to inhibit only mTORC1, chronic rapamycin treatment, which reverses phenotypes associated with Pten-deficiency15-17, also suppresses mTORC2 activity in Pten-deficient mice15,17. Thus, it is not clear whether hyperactivation of mTORC1 or mTORC2 leads to behavioral and neurophysiological abnormalities associated with PTEN-deficiency.
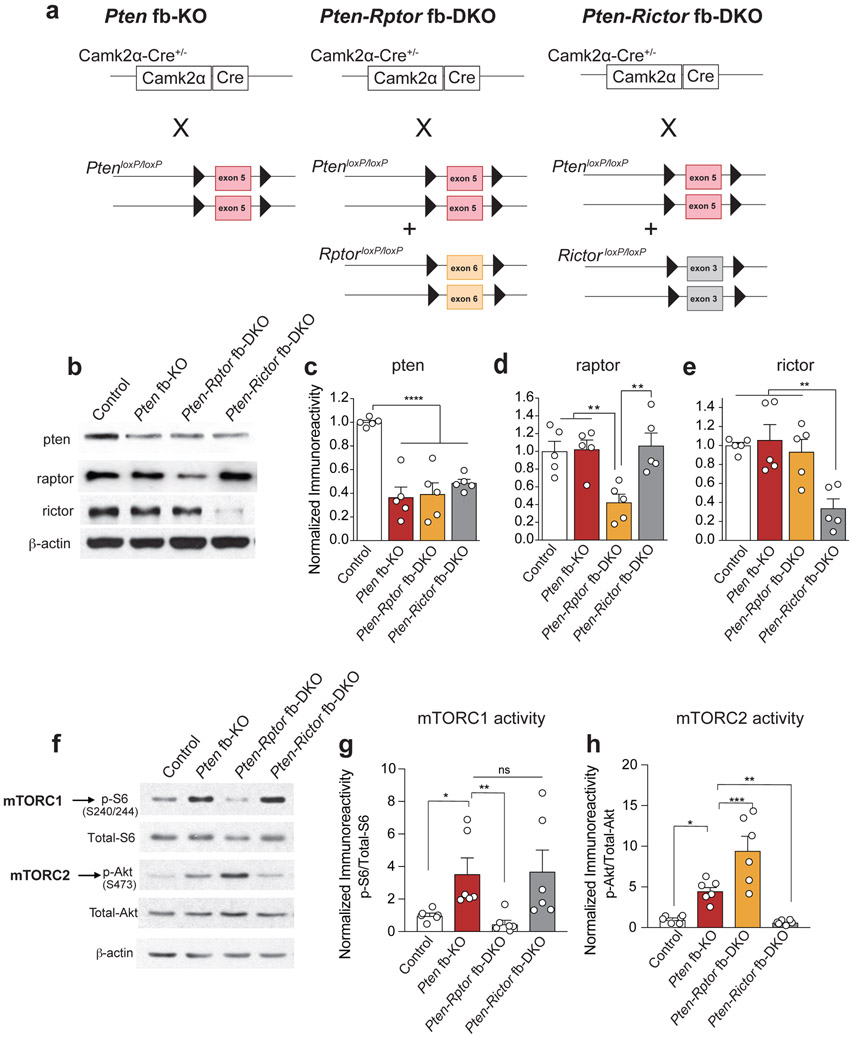
We used molecular genetics to investigate the selective involvement of mTORC1 or mTORC2 and their functional relevance in the neural pathophysiology associated with the loss of Pten. Briefly, we conditionally deleted Pten (Pten fb-KO), Pten and Rptor (encoding raptor a defining component of mTORC1; Pten-Rptor fb-DKO mice) or Pten and Rictor (encoding rictor, a defining component of mTORC2; Pten-Rictor fb-DKO mice) in the murine forebrain using the Cre-lox system (Extended Data Fig. 1a-e and Methods). As expected, in the hippocampus (Fig. 1b-d) and cortex (Extended Data Fig. 1f-h) of Pten fb-KO mice, the activity of both mTORC1 (as determined by the phosphorylation of its downstream target the protein S6 at Ser 240/244) and mTORC2 (as determined by the phosphorylation of its downstream target Akt at Ser 473) was increased. Genetic deletion of Rptor in Pten deficient mice (Pten-Rptor fb-DKO mice) selectively reduced mTORC1 (but not mTORC2) activity (Fig. 1b-d, Extended Data Fig. 1f-h). By contrast, genetic deletion of Rictor in Pten-deficient mice (Pten-Rictor fb-DKO) only reduced mTORC2 (but not mTORC1) activity (Fig. 1b-d, Extended Data Fig. 1f-h). Thus, conditional deletion of Rptor or Rictor selectively suppresses mTORC1 or mTORC2 activity, respectively, in the forebrain of Pten fb-KO mice.
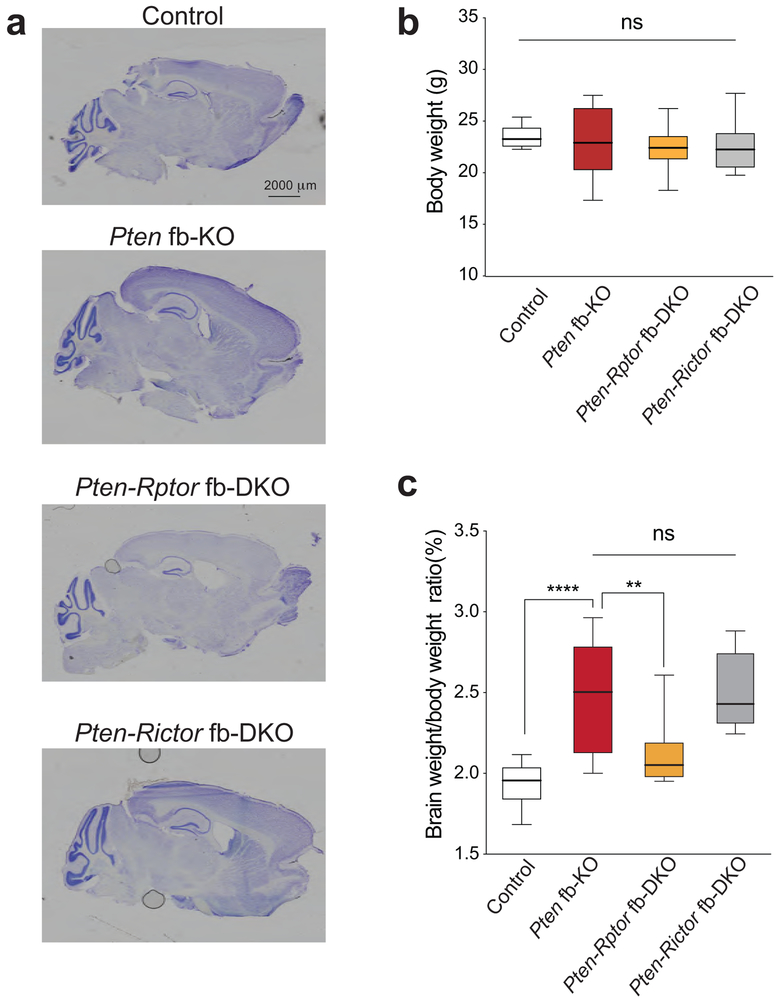
A significant percentage of children with ASD, including those carrying mutations in PTEN, exhibit brain enlargement, which becomes noticeable a few months after birth18-20. However, little is known about the molecular mechanism underlying macrocephaly in ASD21,22 and whether the same mechanism regulating brain size also controls other symptoms associated with ASD. To dissect the functional role of each mTOR complex in brain overgrowth in Pten-deficient mice, we measured the weight of the brain in Pten fb-KO mice with either reduced mTORC1 or mTORC2 activity. As previously reported23, Pten fb-KO mice exhibited increased brain size compared to control littermates (Fig. 1e and Extended Data Fig. 2). In agreement with the known role of mTORC1 as a central regulator of growth through controlling protein synthesis9,10, we found that genetic suppression of mTORC1 (but not mTORC2) reduced brain size in Pten fb-KO mice (Fig. 1e and Extended Data Fig. 2). Thus, hyperactivation of mTORC1, but not mTORC2, accounts for the macrocephaly phenotype in Pten fb-KO mice.
Deletion of Pten in mice is known to cause premature death24,25. Kaplan-Meier curves revealed a dramatic decrease in survival in mice lacking Pten in forebrain neurons (Fig. 1f). Strikingly, Pten-Rictor fb-DKO mice, but not Pten-Rptor fb-DKO mice, lived significantly longer than Pten fb-KO mice (Fig. 1f). Thus, suppression of mTORC2, but not mTORC1, signaling increases survival in Pten fb-KO mice.
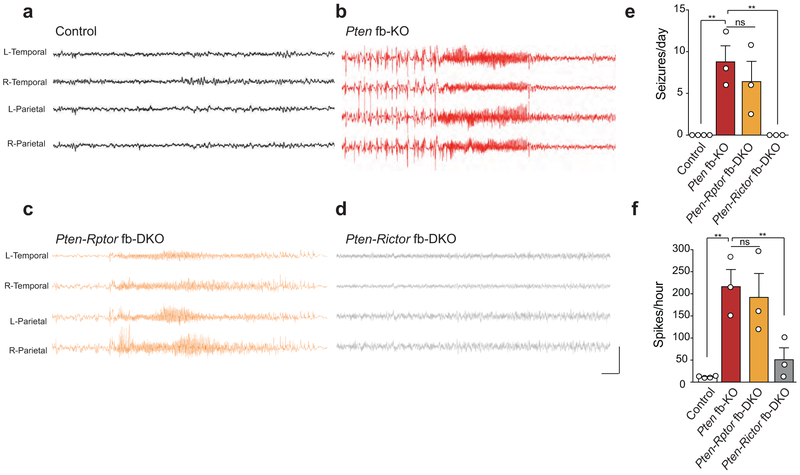
The activity of the mTOR pathway is altered in several models of epilepsy26,27 and a significant number of individuals with ASD also suffer from seizures28. Therefore, we next analyzed spontaneous seizures and electroencephalographic (EEG) activity in control, Pten fb-KO, Pten-Rictor fb-DKO, and Pten-Rptor fb-DKO mice. While Pten fb-KO mice show abnormal interictal spikes, EEG waveforms, and tonic-clonic seizures (Fig. 2b, 2e-f), surprisingly, we found that the epilepsy phenotype was suppressed in Pten-Rictor fb-DKO mice (Fig. 2d, 2e-f), but not in Pten-Rptor fb-DKO mice (Fig. 2c, 2e-f). Thus, inhibition of mTORC2, but not mTORC1, suppresses seizure frequency and abnormal network hyperexcitability in Pten-deficient mice.
Figure 2. Genetic inhibition of mTORC2 prevents the development of seizures in Pten fb-KO mice.
(a-d) Representative EEG traces from control mice (a), Pten fb-KO mice (b), Pten-Rptor fb-DKO mice (c) and Pten-Rictor fb-DKO (d). (e) Compared to control mice, Pten fb-KO and Pten-Rptor fb-DKO mice exhibit frequent generalized seizures [seizures per day; control (n = 4) vs. Pten fb-KO (n = 3): t = 4.62, P = 0.0013; control vs. Pten-Rptor fb-DKO (n = 3): t = 3.38, P = 0.0082]. By contrast, seizures were fully suppressed in Pten-Rictor fb-DKO mice (Pten fb-KO vs. Pten-Rictor fb-DKO: n = 3 per group, t = 4.32, P = 0.0019). (f) Compared to control mice, Pten fb-KO and Pten-Rptor fb-DKO mice exhibit increased interictal spikes [spikes per hour; control (n = 4) vs. Pten fb-KO (n = 3): t = 4.63, P = 0.0012; control vs. Pten-Rptor fb-DKO (n = 4): t = 4.01, P = 0.0027). In contrast, the increased interictal spikes are suppressed in Pten-Rictor fb-DKO mice (spikes per hour; Pten fb-KO vs. Pten-Rictor fb-DKO: n = 3 per group, t = 3.50, P = 0.0067). Calibration: 3 sec and 1500 μV. Data are mean ± SEM. Statistics are based on one-way ANOVA followed by uncorrected two-sided Fisher’s LSD method for pairwise comparisons. n.s., not significant.
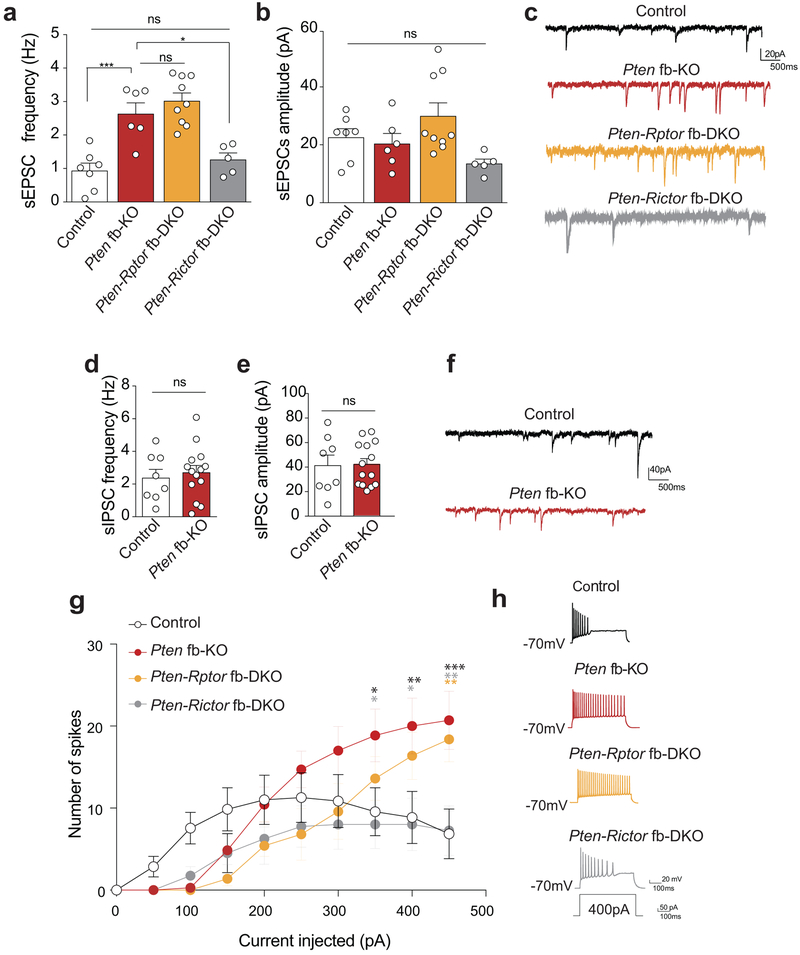
Given the epileptiform activity in the brain of Pten fb-KO mice, we next examined excitatory synaptic transmission in hippocampal slices in whole-cell recordings from CA1 neurons. We found that the frequency (but not the amplitude) of spontaneous excitatory postsynaptic currents (sEPSCs) was increased in Pten fb-KO mice (Extended Data Fig. 3a-c). Interestingly, only inhibition of mTORC2 (Pten-Rictor fb-DKO mice), but not mTORC1 (Pten-Rptor fb-DKO), corrected the changes in synaptic transmission in Pten-deficient mice (Extended Data Fig. 3a-c). In addition, we found that, upon equivalent step injection of currents, CA1 neurons from Pten fb-KO mice showed increased runaway excitability, a phenotype that was only ameliorated when mTORC2, but not mTORC1 signaling, was genetically suppressed (Extended Data Fig. 3g-h). Of note, spontaneous inhibitory postsynaptic currents (sIPSCs) were not altered in Pten fb-KO mice (Extended Data Fig. 3d-f). Thus, the abnormal neuronal excitability in Pten fb-KO mice is reversed when mTORC2, but not mTORC1, activity is normalized.
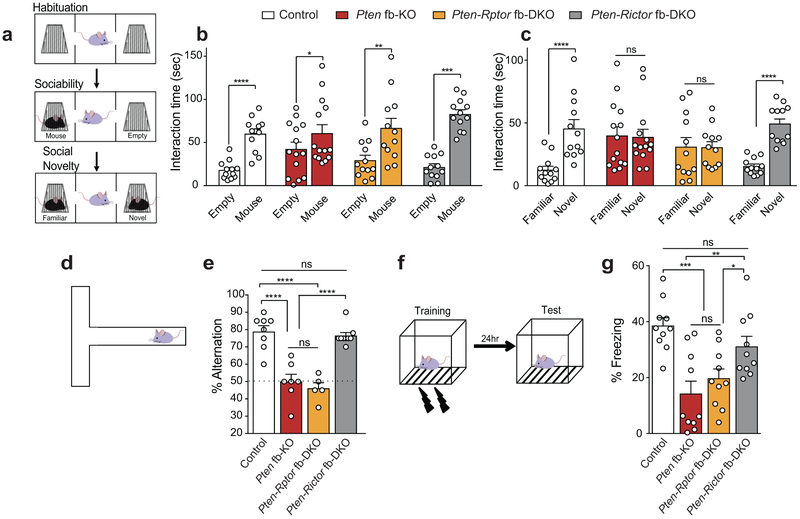
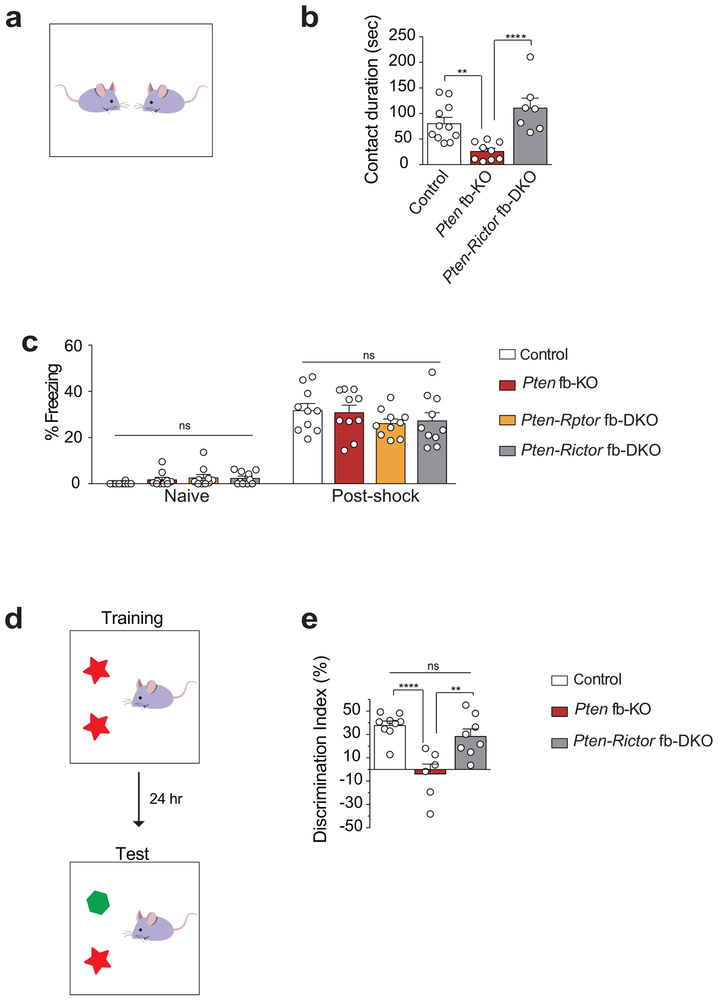
Social deficits are a salient feature of ASD28 and PTEN is mutated in ASD patients2,4,5. Thus, we next studied social behaviors using the three-chamber sociability and social novelty tests (Fig. 3a). In the sociability task, we compared the time a mouse spends interacting with either an empty wire cup (Empty) or a wire cup containing a mouse (Mouse); whereas in the social novelty test, we measured the time a mouse spends interacting with a familiar or a stranger (novel) mouse. Similar to other mouse models of ASD29,30, we found that Pten fb-KO mice showed normal sociability (Fig. 3b). However, preference for social novelty was impaired in Pten fb-KO mice, as determined by their lack of preference for interaction with a stranger versus a familiar mouse, in the social novelty test (Fig. 3c). Since it has been postulated that hyperactivation of mTORC1 leads to ASD-like symptoms2, we expected that genetic inhibition of mTORC1 would rescue the social deficits observed in Pten fb-KO mice. To our surprise, we found that only inhibition of mTORC2 (in Pten-Rictor fb-DKO mice), but not mTORC1 (in Pten-Rptor fb-DKO mice), reversed the deficits in social novelty in Pten fb-KO mice (Fig. 3c). Accordingly, direct social interaction, which was also impaired in Pten fb-KO mice, was rescued in Pten-Rictor fb-DKO mice (Extended Data Fig. 4a-b).
Figure 3. Genetic inhibition of mTORC2 prevents the behavioral abnormalities in Pten fb-KO mice.
(a) Schematic of the three-chamber social interaction task. (b) In the sociability test, like control mice, Pten fb-KO mice spent more time interacting with a mouse than with an empty wire cup [mouse vs. empty cup interaction time, control (n = 12), t11 = 6.60, P < 0.0001; Pten fb-KO (n = 14), t13 = 2.22, P = 0.0446; Pten-Rptor fb-DKO (n = 12), t11 = 3.74, P = 0.0033; Pten-Rictor fb-DKO (n = 12), t11 = 5.71, P = 0.0001). (c) In the social novelty test, Pten fb-KO mice showed no preference interacting with a novel vs. a familiar mouse (t13 = 0.29, P = 0.7736) compared to control mice (t11 = 9.87, P < 0.0001). Unlike genetic inhibition of mTORC1 (Pten-Rptor fb-DKO, t11 = 0.99, P = 0.3411), genetic inhibition of mTORC2 reversed the deficits in social novelty in Pten-deficient mice (Pten fb-KO vs. Pten-Rictor fb-DKO, t11 = 6.36, P < 0.0001). Statistics are based on paired t-test. Data are mean ± SEM. (d) Schematic of the T-maze spontaneous alteration task. (e) Compared to controls (n = 8, 78.7 ± 3.5 %), both Pten fb-KO mice (n = 7, 50.0 ± 4.2 %, control vs. Pten fb-KO, t = 6.38, P < 0.0001) and Pten-Rptor fb-DKO mice (n = 5, 46.0 ± 3.3%, control vs. Pten-Rptor fb-DKO, t = 6.59, P < 0.0001) showed impaired spontaneous alternation, which was not significantly different from chance level. By contrast, Pten-Rictor fb-DKO mice showed normal spontaneous alteration (n = 9, 76.4 ± 1.83 %, vs. control t = 0.54, P = 0.5959; Pten fb-KO mice vs. Pten-Rictor fb-DKO mice, t = 6.02, P < 0.0001). (f) Schematic of the contextual fear conditioning test paradigm. (g) Compared to control, both Pten fb-KO mice and Pten-Rptor fb-DKO mice show impaired long-term fear memory (n = 10 per group, control vs. Pten fb-KO, t = 4.72, P < 0.0001; control vs. Pten-Rptor fb-DKO, t = 3.65, P = 0.0008). By contrast, long-term fear memory is greatly improved in Pten-Rictor fb-DKO mice (n = 10, Pten fb-KO vs. Pten-Rictor fb-DKO, t = 3.27, P = 0.0024; control vs. Pten-Rictor fb-DKO, t = 1.44, P = 0.1569 Statistics are based on one-way ANOVA comparison followed by uncorrected two-sided Fisher’s LSD method for pairwise comparisons. n.s., not significant.
Another trait commonly observed in ASD individuals is behavioral inflexibility31,32. To assess behavioral inflexibility in mice, we measured the willingness of mice to explore a new environment in the T-maze (Fig. 3d). While exploring the maze, control mice typically alternated between the two arms. By contrast, Pten fb-KO mice tended to repeatedly explore the same arm of the maze, indicating impaired behavioral flexibility (Fig. 3e). Interestingly, Pten-Rictor fb-DKO mice, but not Pten-Rptor fb-DKO mice, showed normal behavioral flexibility (Fig. 3e).
Finally, given that dysregulation of mTOR signaling is associated with cognitive dysfunction, a subset of ASD individuals also suffer from intellectual disability2-5 and mTOR complexes are implicated in long-term memory storage33,34, we assessed Pavlovian long-term fear memory in our mouse model. In this task, we paired a context (conditioned stimulus, CS) with a foot shock (unconditioned stimulus, US). Twenty-four hours later, mice were exposed to the CS and their freezing response (% of freezing) was measured as an index of the strength of their long-term memory (Fig. 3f). While Pten fb-KO mice showed normal freezing responses during training (Extended Data Fig. 4c), they exhibited a dramatic reduction in freezing behavior 24 hours post-training, indicating impaired long-term fear memory (Fig. 3g). Importantly, the deficits in long-term memory in Pten fb-KO mice were reversed upon genetic deletion of Rictor, but not Rptor (Fig. 3g). To support these findings, we also assessed long-term object recognition memory. In this task, mice need to differentiate between a familiar and a novel object (Extended Data Fig. 4d). While control mice preferentially explore a novel object, Pten fb-KO mice failed to differentiate the objects, indicating that their long-term memory was impaired (Extended Data Fig. 4e). Similar to the deficits in long-term fear memory, those observed in object recognition memory were rescued by genetic reduction of mTORC2 in Pten-Rictor fb-DKO mice (Extended Data Fig. 4e). Collectively, our findings establish that inhibition of mTORC2, but not mTORC1, activity rescues the behavioral endophenotypes associated with ASD in Pten fb-KO mice.
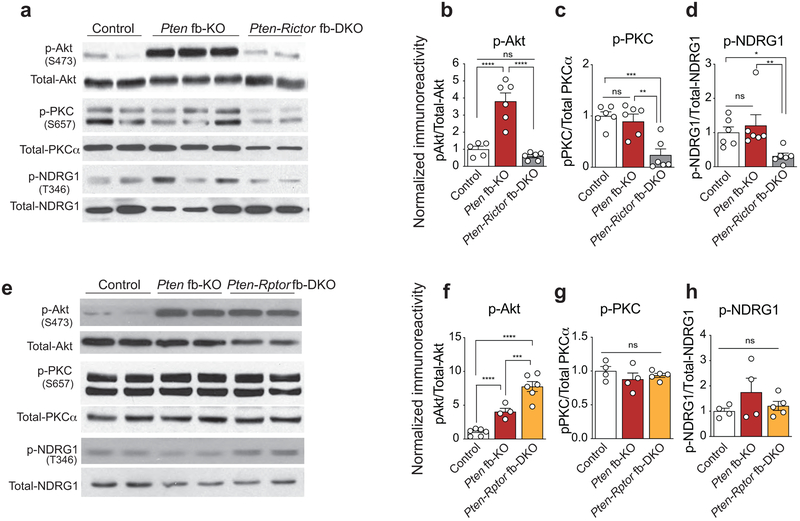
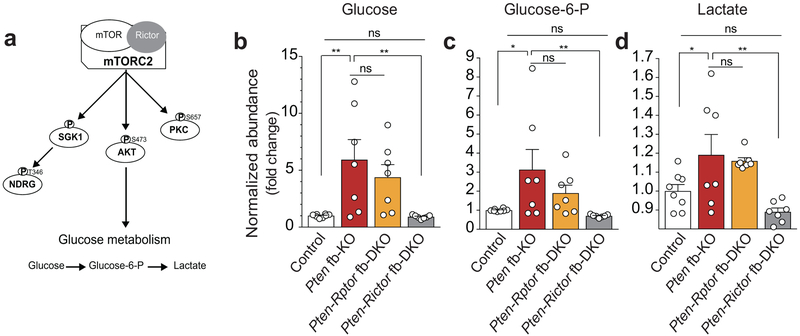
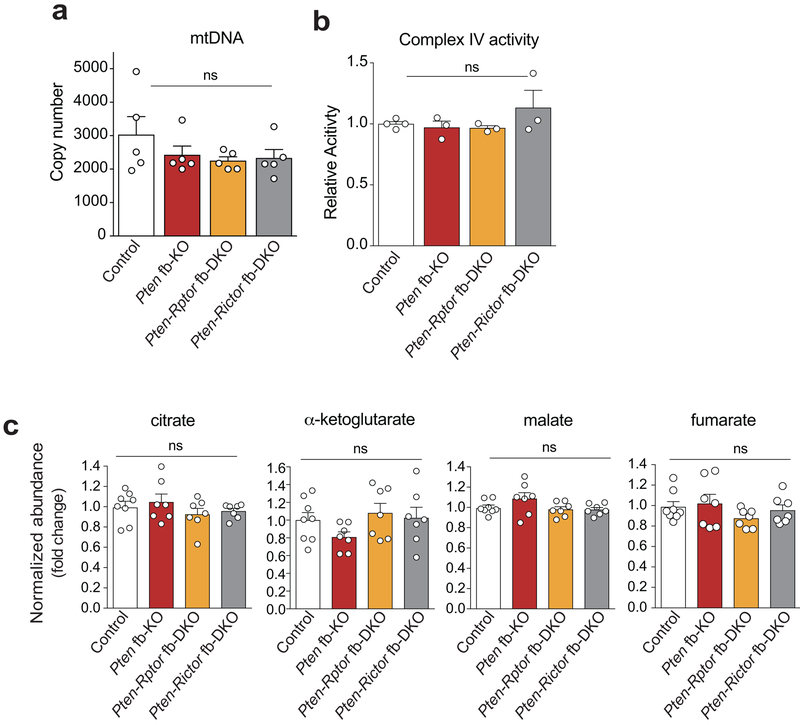
Currently, three major downstream targets of mTORC2 have been identified: Akt, the glucocorticoid-inducible kinase SGK1, and PKCα9,10 . A comparison of the activation of these downstream targets revealed a selective increase in phosphorylation of Akt-Ser473 in the hippocampus of Pten fb-KO mice (Extended Data Fig. 5a-d), which was reversed only by genetic deletion of mTORC2 (Fig. 1b-d and Extended Data Fig. 5a-b, 5e-f). To identify mTORC2-dependent molecular changes that contribute to the pathophysiology associated with the loss of Pten, we performed an unbiased quantitative metabolomics analysis. Interestingly, in the brain of Pten fb-KO mice, we found an increase in metabolites associated with glycolysis (Extended Data Fig. 6). Consistent with the idea that PTEN regulates glycolysis through Akt35-39, we found that inhibition of mTORC2, but not mTORC1, restored the changes in glucose metabolism associated with the loss of Pten (Extended Data Fig. 6b-d). We did not observe major changes in mitochondrial biogenesis, electron transport chain complex enzyme activity, or the level of TCA (tricarboxylic acid) cycle intermediates (Extended Data Fig. 7). Hence, increased mTORC2, but not mTORC1, activity leads to changes in neuronal metabolism associated with glycolysis in Pten-deficient mice.
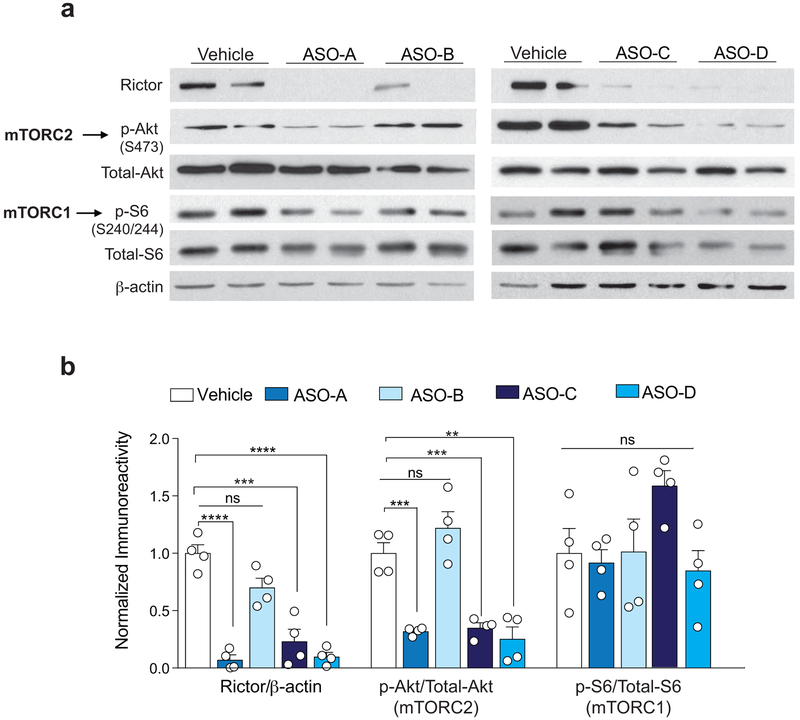
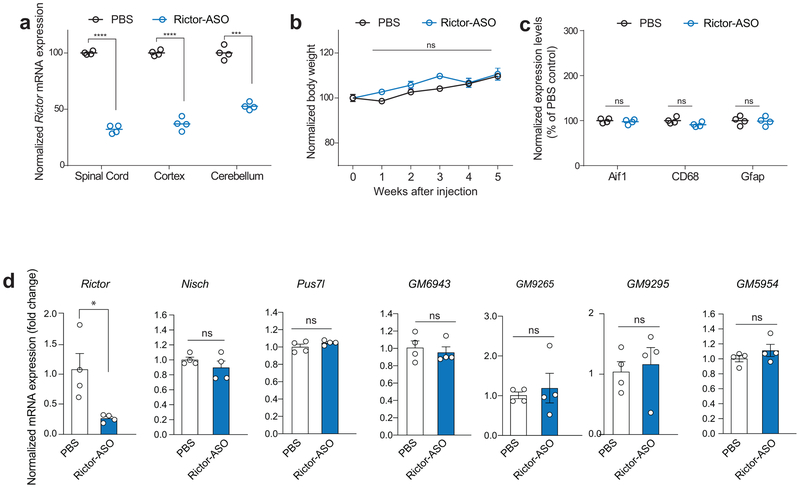
Because the remarkable improvement of the pathophysiology associated with the loss of Pten by genetic reduction of mTORC2 and the fact that there are no specific inhibitors of mTORC2, we sought to generate a new therapeutic option to treat the disease. To this end, we developed short, synthetic, single-stranded antisense oligonucleotides (ASOs) to target rictor, the obligatory component of mTORC2. ASOs inhibit the expression of target genes by forming a hybrid with the targeted RNA sequence that becomes a substrate for RNase H and results in target mRNA degradation40. When we first tested the efficacy and selectivity of several ASOs in primary cortical neurons, we found that ASO-A (Rictor-ASO) reduced rictor protein levels and inhibited mTORC2 activity, without affecting mTORC1 activity (Extended Data Fig. 8). Moreover, a single intracerebroventricular (ICV) injection of Rictor-ASO effectively reduced Rictor mRNA levels in the brain and the spinal cord, was well-tolerated and did not trigger inflammation, as determined by changes in gene expression of microglia markers (Extended Data Fig. 9a-c). The Rictor-ASO was specifically designed to bind with 100% complementarity to the mouse Rictor transcript, and there are no other mRNAs in the mouse transcriptome that binds with full complementary (with zero mismatch) to Rictor-ASO. While Rictor-ASO is highly unlikely to have significant activity toward target sequences with more than 1 mismatch41-43, we identified 6 potential off-target mRNAs by searching for sequences with either 2 mismatches, or with 17 bases aligned in a row and 3 mismatches [Nisch (Entrez ID: 64652), Pus7l (Entrez ID: 78895), Gm6943 (Entrez ID: 629055), Gm9265 (Entrez ID: 668605), Gm9295 (Entrez ID: 100862348), and Gm5954 (Entrez ID: 105245406)] using the Bowtie algorithm44. It should be noted that the expression level of these 6 genes is very low in the adult mouse CNS [(Cental Nervous System) with an RPKM (Reads Per Kilobase of transcript, per Million mapped reads) value less than 0.5]. More importantly, treatment with Rictor-ASO selectively reduces Rictor mRNA levels in the brain, but had no effect on the expression of the potential off-target mRNAs (Extended Data Fig. 9d). Thus, Rictor-ASO is specific and only targets Rictor mRNA.
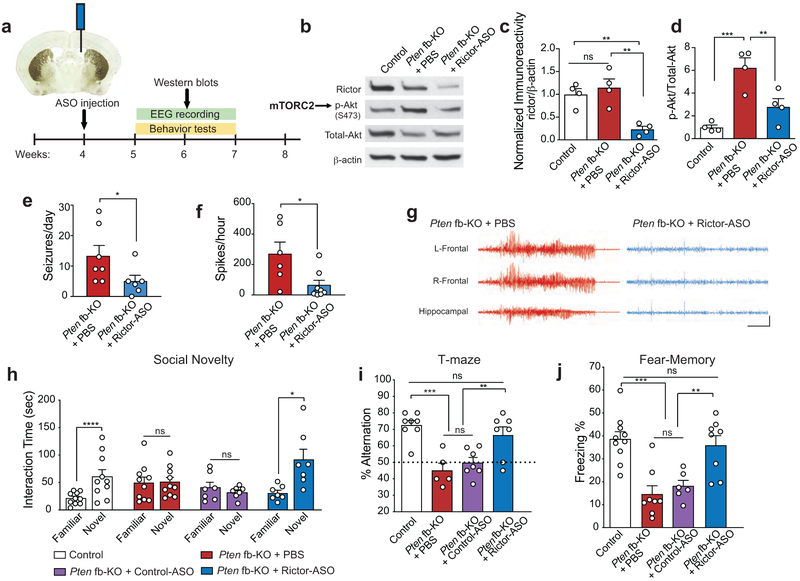
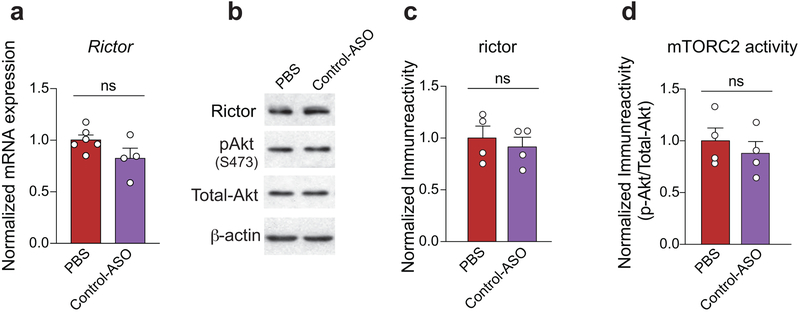
Remarkably, like genetic inhibition of mTORC2, a single ICV-injection of Rictor-ASO into Pten-fb KO mice (Fig. 4a) not only decreased rictor protein levels and mTORC2 activity (Fig. 4b-d), but also improved the epilepsy phenotype in these mice (Fig. 4e-g). Moreover, treatment with Rictor-ASO fully rescued the ASD-like behaviors in Pten fb-KO mice, including their deficits in social novelty and behavioral inflexibility (Fig. 4h-i). Finally, Rictor-ASO-mediated reduction of mTORC2 activity also ameliorated the deficits in long-term memory in Pten-deficient mice (Fig. 4j). To further support the notion that the effect of Rictor-ASO is specific, we found that, unlike Rictor-ASO, treatment with a Control-ASO, failed to a) reduce Rictor mRNA and protein levels (Extended Data Fig. 10a-c), b) inhibit mTORC2 activity (Extended Data Fig. 10d), and c) improve behavior in Pten-fb KO mice (Fig. 4h-k). In conclusion, our results show that selective inhibition of mTORC2 activity using ASO treatment effectively reverses the neurophysiological and behavioral abnormalities in Pten fb-KO mice.
Figure 4. Injection of antisense oligonucleotide targeting mTORC2 component Rictor improved seizures, memory and ASD-like behaviors in Pten fb-KO mice.
(a) Schematic of Rictor antisense oligonucleotide (Rictor-ASO) treatment and experimental design. Representative western blots (b) and quantification (c-d) show that intracerebroventricular (ICV) injection of Rictor-ASO reduced both rictor protein levels (c, n = 4 per group, Pten fb-KO + PBS vs. Pten fb-KO + Rictor-ASO, t = 4.77, P = 0.0010) and mTORC2 activity (d, n = 4 per group, Pten fb-KO + PBS vs. Pten fb-KO + Rictor-ASO, t = 3.71, P = 0.0048) in the hippocampus of Pten fb-KO mice. Statistics are based on one-way ANOVA comparison followed by uncorrected two-sided Fisher’s LSD method for pairwise comparisons. (e-f) Rictor-ASO injection attenuated EEG seizures [e, seizures per day: Pten fb-KO + PBS (n = 7), vs. Pten fb-KO + Rictor-ASO (n = 6), t = 2.18, P = 0.0314] and the increased interictal spikes [f, spikes/hour: Pten fb-KO + PBS (n = 6) vs. Pten fb-KO + Rictor-ASO (n = 8), t = 2.41, P = 0.048] in Pten fb-KO mice. (g) Representative EEG traces in Rictor-ASO-injected Pten fb-KO mice. Calibration: 5 sec and 500 μV. Statistics are based on one-way ANOVA comparison followed by uncorrected two-sided Fisher’s LSD method for pairwise comparisons. (h) Treatment with Rictor-ASO rescued the deficits in social novelty in Pten fb-KO mice [control (n = 10), t9 = 6.98, P < 0.0001; Pten fb-KO + PBS (n = 10), t9 = 0.83, P = 0.4301; Pten fb-KO + Control-ASO (n = 7), t6 = 0.41, P = 0.6936; Pten fb-KO + Rictor-ASO, n = 7, t6 = 3.46, P = 0.0135). Statistics are based on paired t-test. (i-j) Treatment with Rictor-ASO improves spontaneous alteration in the T-maze [i, Control (n = 8), 72.5 ± 2.84 %; Pten fb-KO + PBS (n = 5), 45.0 ± 4.47 %; Pten fb-KO + Control-ASO (n = 6), 49.73 ± 3.23 %; Pten fb-KO + Rictor-ASO (n = 7), 66.43 ± 5.80 %, control vs. Pten fb-KO + PBS, t = 4.75, P < 0.0001; Pten fb-KO + PBS vs. Pten fb-KO + Rictor-ASO, t = 3.60, P = 0.0015; Pten fb-KO + Control-ASO vs. Pten fb-KO + Rictor-ASO, t = 3.08, P = 0.0053; Pten fb-KO + PBS vs. Pten fb-KO + Control-ASO, t = 0.79, P = 0.435, control vs. Pten fb-KO + Rictor-ASO, t = 1.16, P = 0.26] and long-term contextual fear memory in Pten fb-KO mice [j, Control (n = 10) vs. Pten fb-KO + PBS (n = 8), t = 4.98, P < 0.0001; Pten fb-KO + PBS vs. Pten fb-KO + Rictor-ASO (n = 8), t = 4.18, P = 0.0003; Pten fb-KO + Control-ASO (n = 6) vs. Pten fb-KO + Rictor-ASO, t = 3.23, P = 0.0032; Pten fb-KO + PBS vs. Pten fb-KO + Control-ASO, t = 0.65, P = 0.5233; control vs. Pten fb-KO + Rictor-ASO, t = 0.57, P = 0.5729). Statistics are based on one-way ANOVA comparison followed by uncorrected two-sided Fisher’s LSD method for pairwise comparisons. Data are presented as mean ± SEM.
Most of the studies on brain mTORopathies and potential therapeutic options have focused on mTORC1 and protein synthesis control1,2,6. Our study reveals that hyperactivation of mTORC1 only regulates brain size in Pten-deficient mice, but not the other core endophenotypes associated with ASD and epilepsy (Fig. 1–3). Thus, the effect of mTORC1 on brain size and the other behavioral core symptoms in Pten fb-KO mice can be mechanistically uncoupled. Unexpectedly, using two independent approaches (molecular genetics and ASO), we found that reduction of mTORC2 rescues the behavioral and neurophysiological abnormalities in Pten-deficient mice (Fig. 2–4). Given the crosstalk between mTORC1 and mTORC2 complexes9,10, future research should address whether the concomitant genetic deletion of both complexes synergistically promotes survival in Pten-deficient mice. In addition, it would be interesting to determine whether mTORC2 is also the main mTOR complex in other neurological disorders where mTOR signaling is dysregulated, including epilepsy, TSC, Fragile X syndrome, RASopathies, and even Alzheimer’s disease. Finally, our findings hold the hope that Rictor-ASO-mediated reduction of mTORC2 activity may emerge as a promising therapeutic strategy to combat a wide range of neurological disorders in which mTOR signaling is dysfunctional.
Methods
Mouse husbandry.
All experiments were conducted on 5–7 week old male and female mice from the C57Bl/6 background. PtenloxP/loxP mice45 and RictorloxP/loxP mice46 were previously described. RptorloxP/loxP mice were purchased from the Jackson Laboratory (Stock# 013188). Double floxed mice were generated by crossing PtenloxP/loxP with either RptorloxP/loxP or RictorloxP/loxP. To generate forebrain specific knockout mice (fb-KO), PtenloxP/loxP mice, Pten-Rptor loxP/loxP mice or Pten-Rictor loxP/loxP were crossed with mice expressing Cre recombinase under the control of the α subunit of the calcium/calmodulin-dependent protein kinase II (Camk2α) promoter to then produce Pten fb-KO, Pten-Rptor fb-DKO and Pten-Rictor fb-DKO mice, respectively. Mice were weaned at the third postnatal week, genotyped by Transetyx using real-time PCR and kept on a 12h/12h light/dark cycle (lights on at 7:00 am) and had access to food and water ad libitum. Animal care and experimental procedures were approved by the institutional animal care and use committee (IACUC) at Baylor College of Medicine, according to NIH Guidelines.
Electroencephalographic (EEG) Recordings.
EEG recordings were performed as previously described47. Briefly, mice were anesthetized with Avertin (1.25% tribromoethanol/amyl alcohol solution, 0.02ml/g, i.p. injection). Teflon-coated silver wire electrodes were implanted bilaterally into the subdural space over frontal and parietal cortices. After a 72 hr post-surgical recovery period, freely moving mice were recorded for 24 hr per day. Digitized videoEEG data were obtained daily for 2 weeks from mice at 5–7 weeks of age. All EEG data (interictal spikes and seizure frequency) were interpreted by analysts with expertise in epilepsy who were blinded to genotype. Recordings were visually inspected in their entirety. Electrographic seizure activity was verified by inspection of the concurrent video with documentation of motor seizure episodic behavior consisting of arrest, clonic limb movements, tonic posture, and tonic elevation of the tail (Straub tail).
Electrophysiology.
The experimenter was blind to the genotype. Briefly, animals were decapitated after being anaesthetized with isoflurane (Henry Schein Animal Health, Dublin, OH, USA). The brain was rapidly removed from the skull and fixed on the vibroslicer stage (VT 1000S, Leica Microsystems, Buffalo Grove, IL) with cyanoacrylate glue. Acute 300 μm-thick slices were cut in the horizontal plane in ice cold cutting-solution containing 87 mM NaCl, 25 mM NaHCO3, 25 mM glucose, 75 mM sucrose, 2.5 mM KCl, 1.25 mM NaH2PO4, 0.5 mM CaCl2 and 7 mM MgCl2 (equilibrated with 95% O2–5% CO2 gas mixture, pH 7.3–7.5). Slices were incubated for 20 min at 32°C and then stored at room temperature in a holding bath containing oxygenated standard ACSF (125 mM NaCl, 25 mM NaHCO3, 25 mM glucose, 2.5 mM KCl, 1.25 mM NaH2PO4, 2 mM CaCl2, and 1 mM MgCl2, equilibrated with 95% O2-5% CO2) for at least 20 min, before being transferred to a recording chamber mounted on the stage of an upright microscope (Examiner D1, Carl Zeiss, Oberkochen, Germany). The slices were perfused with oxygenated ACSF (2 ml/min) and maintained at 32°C with a Peltier feedback device (TC-324B, Warner Instruments). Spontaneous excitatory post synaptic currents (sEPSCs) were recorded in the presence of the GABAA receptor antagonist Picrotoxin (100 μm; Sigma-Aldrich, USA). Whole-cell recordings were performed using conventional patch-clamp techniques and CA1 neurons were visually identified by infrared differential interference contrast video microscopy on the stage of the upright microscope.
Patch pipettes were pulled from borosilicate glass capillaries (World Precision Instruments, Inc., Sarasota, FL) and filled with a solution containing (in mM) 110 K-gluconate, 10 KCI, 10 HEPES, 10 Na2-phosphocreatine, 2 Mg3-ATP, and 0.2 Na3-GTP; pH was adjusted to 7.2 and osmolarity to 290 mOsm using a vapor pressure osmometer (Vapro5600, ELITechGroup Wescor, South Logan, Utah, USA). When filled with the internal solution, patch pipettes had a resistance of 3–5 mΩ before seal formation. Spontaneous inhibitory post synaptic currents (sIPSCs) were recorded in the presence of 2 mM kynurenic acid (Sigma-Aldrich, USA). In this case, the internal solution composition was identical, except that potassium gluconate was replaced by KCl. Recordings were performed with a Multiclamp 700B (Molecular Devices), low-pass filtered at 2 Hz and sampled at 20 kHz with a Digidata 1440A interface, and analyzed off-line with pClamp10 software (Molecular Devices, San Jose, CA). CA1 pyramidal cells were clamped at −70 mV and spontaneous currents were recorded with a background activity protocol. The stability of whole-cell recordings can be influenced by changes in series resistance (Rs). To ensure that Rs remained stable during recordings, passive electrode-cell parameters were monitored throughout the experiments by analyzing passive current relaxations induced by 10 mV hyperpolarizing steps from a holding potential of −70 mV applied before and after spontaneous current recording. Variation in Rs >20% led to the rejection of the experimental data. All spontaneous currents were digitally filtered at 1.5 kHz and analyzed off-line. Automated sEPSC and sIPSC analysis was performed with Clampfit software. A further visual inspection of detected signals allowed us to reject noise artifacts. A period of 5 min was used to evaluate sEPSC and sIPSC frequency and mean sEPSC and sIPSC amplitude. Intrinsic excitability of CA1 pyramidal neurons was recorded in current-clamp configuration. Current steps were injected (500 ms) and the average action potentials (APs) number over the entire current pulse was used to construct input-output curve.
Behavior Tests.
Male and female 5–6 week-old mice were used for behavior experiments. Similar numbers of male and female mice for each genotype were included. No differences were found between males and females for the tested behaviors (data not shown). To control for odor cues, apparatuses were thoroughly cleaned with ethanol, dried, and ventilated between testing of individual mice. All behavior experiments used littermates as controls and were carried out and analyzed with the experimenter blinded to genotype.
Three-Chamber Sociability and Social Novelty.
Tests were performed as previously described48,49. Sex and age matched control stranger mice were habituated to a cylindrical wire cup for 30 min once a day for 2 days prior to testing. On the testing day, the experimental mice were allowed to freely explore a 60 × 40 × 23 cm Plexiglas arena divided into three equally sized, interconnected chambers (left, neutral, right) for 10 min (habituation). Immediately after habituation, a stranger mouse was placed in the wire cup and introduced to the test mouse. Another empty cup was placed at the opposite end of the chamber and the test mouse was allowed to interact either with the empty wire cup or stranger mouse for 10 min (sociability). Time spent interacting (sniffing, crawling upon) with either the empty cup or the stranger mouse contained in the other cup as well as time spent in each chamber was recorded using the AnyMaze software, by independent observers. Empty cup placement in the left or right chamber during the sociability period was counterbalanced between trials. Finally, for the social novelty session, a second stranger mouse was introduced into the previously empty wire cup while the first mouse remained in the chamber as the familiar mouse for this session. Time spent in each chamber as well as time spent interacting with either mouse was recorded by independent observers using the automated AnyMaze software.
Reciprocal Social Interaction.
The procedure was adapted from a previously described protocol48. Experimental mice were paired with age and sex matched control stranger mice. Prior to the test, all mice were isolated in home cages for 1 hour. An experimental mouse and a paired stranger mouse were placed in a 25 × 25 × 25 cm Plexiglas arena with a single layer of corncob bedding together for 10 min. Social interaction behavior including close following, touching, nose-to-nose sniffing, nose-to-anus sniffing, and/or crawling over/under each other were scored by the investigator and calculated as total time spent in contact.
T-maze alternation task.
The spontaneous alternation task was conducted as previously described50. The apparatus was a black wooden T-maze with 25 cm high walls and each arm was 30 cm long and 9 cm wide. A removable central partition was used during the sample phase but not the test phase of each trial. Guillotine doors were positioned at the entrance to each goal arm. At the beginning of the sample phase, both doors were raised, and the mouse was placed at the end of the start arm facing away from the goal arms. Each mouse was allowed to make a free choice between the two goal arms; after its tail had cleared the door of the chosen arm, the door was closed, and the mouse was allowed to explore the arm for 30 sec. The mouse was then returned to the end of the start arm, with the central partition removed and both guillotine doors raised, signaling the beginning of the test phase. Again, the mouse was allowed to make a free choice between the two goal arms. This sequence (trial) was repeated 20 times. Trials that were not completed within 120s were terminated and disregarded during analysis. Correct alteration between trials was expressed as % alternation = (number of correct alternation)/20 × 100%.
Contextual Fear Conditioning.
Experiments were performed as previously described46,47,51, 52. Briefly, mice were habituated to the conditioning chamber for 20 min daily for two days. On the training day, mice were place in the chamber for 2 min (Naïve) and then received two foot shocks (0.7 mA, 2 sec, 90 sec apart). The mice were then left in the chamber for another 1 min (post-shock) before being returned to their home cages. Twenty-four hours later, mice were put back into the chamber for 5 min. Real-time video was recorded and analyzed using FreezeView as we previously described46,47,51, 52..
Novel Object Recognition.
Novel object recognition was performed as we previously described53 with small modifications. Briefly, mice were habituated to a black Plexiglas rectangular chamber (31 × 24 cm, height 27 cm) for 20 min under dim ambient light for 3 days before testing. One the first day, test mice were allowed to explore two identical objects in the testing chamber for 10 min and then returned to the home cage. On the second day (24 hours), test mice were again placed in the testing chamber and presented with one object used on the previous day (familiar object) and a novel object for 10 min. The novel object has the same height and volume, but different shape and appearance. Exploration of the objects was defined as sniffing of the objects (with nose contact or head directed to the object) within at 2 cm radius of the objects. Discrimination Index (DI) was computed as (Novel Object Exploration Time – Familiar Object Exploration Time/Total Exploration Time) X 100.
Western Blotting.
Western blotting was performed as we previously described46,51,53, 54. The hippocampus and cortex from control and knockout mice were isolated from 5–7 week-old mice. Tissue was homogenized in cold lysis buffer [200 mM HEPES, 50 mM NaCl, 10% Glycerol, 1% Triton X-100, 1 mM EDTA, 50 mM NaF, 2 mM Na3VO4, 25 mM β-glycerophosphate, and EDTA-free complete ULTRA tablets (Roche, Indianapolis, IN)], and centrifuged at 13,000 × g for 10 min. The supernatants were collected and resolved on SDS–PAGE (6–10%) and transferred onto nitrocellulose membranes (Pall, Port Washington, NY).
Antibodies.
Antibodies against pten (1:2000 #9188), raptor (1:1000 #2280), Rictor (1:1000 #2114), p-S6 (1:2000, Ser240/244 #5364), p-Akt (Ser473, 1:1000, #9271), total S6 (1:1000 #2217), total Akt (1:1000 #9272), p-PKC (Ser657, 1:2000, #9371) total PKCα (1:1000 #2056), p-NDRG1 (1:1000, Thr346, #3217), total NDRG1 (1:1000 #9408) were purchased from Cell Signaling and Technology Laboratories (Danvers, MA) and β-actin (1:5000 #1501) from Millipore (Temecula, CA). Further information about antibodies is in the Reporting Summary linked to this article.
Non-targeted metabolomics analysis.
Cortex samples from 5–7 weeks old mice were freshly dissected and snap frozen at −80°C until processed. Sample preparation and analysis were done by Metabolon, Inc. (Durham, North Carolina, USA). Briefly, samples were prepared using the automated MicroLab STAR® system from Hamilton Company. Samples were placed briefly on a TurboVap® (Zymark) to remove the organic solvent. The samples were stored overnight under nitrogen before preparation for analysis. The resulting fractions were analyzed by two separate reverse phase (RP)/UPLC-MS/MS methods with positive ion mode electrospray ionization (ESI), RP/UPLC-MS/MS with negative ion mode ESI, and HILIC/UPLC-MS/MS with negative ion mode ESI. All methods utilized a Waters ACQUITY ultra-performance liquid chromatography (UPLC) and a Thermo Scientific Q-Exactive high resolution/accurate mass spectrometer interfaced with a heated electrospray ionization (HESI-II) source and Orbitrap mass analyzer operated at 35,000 mass resolution. Raw data were extracted, peak-identified and QC processed using Metabolon’s hardware and software. Compounds were identified by comparison to library of purified standards or recurrent unknown entities. The raw data counts were used for analysis. All the data points were normalized to the control group and expressed as fold changes and the statistics are based on normalized values.
Electron transport chain (ETC) analysis.
ETC enzyme activity was determined as previously described55,56. After sonication, protein concentration was determined by Bradford assay and ETC complexes and citrate synthase (CS) activity were measured using a Tecan Infinite M200 microplate plate reader. The enzyme activity data were normalized to the protein concentration.
Mitochondrial DNA copy (mtDNA) number.
mtDNA copy number was quantified as previously described57. Briefly, a SYBR Green-based qPCR assay with primers specific to tRNA region of mtDNA and β2-microglobulin region of nuclear DNA was used for the quantification of mtDNA.
Antisense Oligonucleotide (ASO) Synthesis.
ASOs consist of 20 chemically modified nucleotides, five 2’ -O-methoxyethyl-modified nucleotides at each end separated by ten DNA nucleotides in the center. The backbone of the ASOs consists of a mixture of modifications from 5- to 3-: 1-PS (Phosphorothioate), 4-PO (phosphodiester), 10-PS, 2-PO and 2-PS. Rictor-ASO (GTTCACCCTATACATTACCA) targeting mouse Rictor mRNA and a Control-ASO (CCTATAGGACTATCCAGGAA) were developed and synthesized by Ionis Pharmaceutical as previously described58. The algorithm Bowtie59 was used to determine potential off-targets for the Rictor-ASO and confirmed that Rictor-ASO binds with 100% complementarity (zero mismatch) to the mouse Rictor transcript and does not bind to any other mRNA with full complementary in the mouse transcriptome.
Intracerebroventricular (ICV) ASO Injection.
Surgical site was sterilized with betadine and 70% alcohol. Buprenorphine 1mg/kg was administered subcutaneously 1 hour before surgery for pain control. Mice were anaesthetized with 3% isoflurane for 10 min before placing on a computer-guided stereotaxic instrument (Kopf instruments) fully integrated with the Franklin and Paxinos35 mouse brain atlas through a control panel. Anesthesia was continuously delivered (2% isoflurane) throughout the surgery. A midline incision was cut on the skull skin and a small hole was drilled through the skull above the right lateral ventricle. Rictor ASO (500 μg) was diluted in PBS and then ICV-delivered (10 μl) using a Hamilton syringe and glass needles. Control mice received either control-ASO (500 μg) or the same volume (10 μl) of PBS. The coordinates used for ICV injection were: Anterior-Posterior= - 0.2 mm, Medial-Lateral = 1 mm, Dorsal-Ventral = - 3 mm. The needle was left for 2 min on the site of injection. The incision was manually closed with sutures. Mice were maintained on a 39 °C isothermal pad while anaesthetized and during recovery.
qRT-PCR.
Total RNA was extracted from freshly dissected tissue using RNeasy Plus Universal Mini Kit (Qiagen). 2μg total RNA was used for reverse transcription (Superscript VILO cDNA synthesis kit, Invitrogen). qRT-PCR was performed using PowerUp SYBR Green Master Mix (Thermo Fisher Scientific) according to the manufacturer’s protocol. mRNA levels of target genes were normalized to GAPDH RNA and data are presented as fold-change relative to control levels. Primer set sequences are listed in Supplementary Table 1.
Statistical analyses.
No statistical methods were used to pre-determine sample sizes, but our sample sizes are selected based on previous studies published in the field (see Life Science Reporting Summary for references). Animals in the same litter were randomly assigned to different treatment groups in various experiments. No animals or data points were excluded from the analysis. Normality testing and F-tests of homogeneity of variances were performed before choosing statistical tests. Statistics are based on the two-sided Student’s t-test or Mann-Whitney Rank Sum test for two-group comparisons (for data sets that were not normally distributed). One-way ANOVA followed uncorrected Fisher’s Least Significant Difference method for pairwise comparisons analysis was performed for multiple comparisons, unless otherwise indicated. P < 0.05 was considered significant (*P < 0.05, **P < 0.01, ***P < 0.001, ****P < 0.0001). Further information about the statistical analyses is in the Reporting Summary linked to this article.
Reporting Summary:
Further information on research design is available in the Nature Research Reporting Summary linked to this article.
Data Availability Statement
The data supporting the findings of this study are available in the paper or supplementary information. Full uncropped blots are available as Source data. Any other raw data that supports the findings of this study is available from the corresponding author upon reasonable request. The request of Rictor-ASO will be promptly reviewed by Ionis Pharmaceuticals to verify that the request is subject to any intellectual property confidential obligations. If not, the ASO will be available upon completion of a standard Material Transfer Agreement with Ionis Pharmaceuticals.
Supplementary Material
Extended Data
Extended Data Fig. 1. Selective inhibition of mTORC1 or mTORC2 activity in Pten fb-KO mice.
(a) Schematics of generation of forebrain neuron specific Pten-deficient (Pten fb-KO) and double knockout mice (Pten-Rptor fb-DKO and Pten-Rictor fb-DKO). (b-e) Representative western blot (b) and quantification show reduced pten levels in Pten fb-KO mice (c, n = 5, t = 5.22, P < 0.0001), Pten-Rptor fb-DKO (c, n = 5, t = 5.34, P < 0.0001) and Pten-Rictor fb-DKO (c, n = 5, t = 4.50, P = 0.0004) and reduced raptor (d, n = 5 per group , vs. control t = 3.52, P = 0.0028) or rictor (e, n = 5, t = 3.83, P = 0.0015) levels in the hippocampus of Pten-Rptor fb-DKO mice or Pten-Rictor fb-DKO mice, respectively. Representative western blot (f) and quantification (g-h) show increased mTORC1 (g, p-S6 at S240/244) and mTORC2 activity (h, p-Akt at S473) in cortex of Pten fb-KO mice (n = 6 per group, p-S6: t = 2.32, P = 0.03, p-Akt: t = 2.81, P = 0.0111). The increased mTORC1 activity in the cortex of Pten fb-KO mice was reduced in Pten-Rptor fb-DKO mice (n = 6, vs. Pten fb-KO, t = 2.87, P = 0.0091), but not in Pten-Rictor fb-DKO mice (n = 6, vs. Pten fb-KO, t = 0.13, P = 0.8958). By contrast, the increased mTORC2 activity in the cortex of Pten fb-KO mice was reduced in Pten-Rictor fb-DKO mice (t = 3.02, P = 0.0066), but not in Pten-Rptor fb-DKO mice (t = 3.92, P = 0.0009). Data are mean ± SEM. Statistics were based on one-way ANOVA followed by uncorrected two-sided Fisher’s LSD method for pairwise comparisons. n.s., not significant.
Extended Data Fig. 2. Genetic inhibition of mTORC1 (but not mTORC2) reverses the increased brain/body weight ratio in Pten fb-KO mice.
(a) Crystal violet staining of mid-sagittal brain sections from control, Pten fb-KO mice, Pten-Rptor fb-DKO and Pten-Rictor fb-DKO mice (3 mice per group were used for the experiment). (b) Body weight of control (n = 11), Pten fb-KO (n = 9), Pten-Rictor fb-DKO mice (n = 13) and Pten-Rptor fb-DKO (n = 9) was similar (F3,38 = 0.93; P = 0.443). (c) Brain weight relative to body weight in control (n = 11, 0.94 ± 0.04%), Pten fb-KO (n = 9, 2.45 ± 0.34%, vs. control, t = 5.13, P < 0.0001), Pten-Rptor fb-DKO (n = 8, 2.12 ± 0.08%, vs. Pten fb-KO, t = 3.145, P = 0.0034) and Pten-Rictor fb-DKO mice (n = 11, 2.52 ± 0.07%, vs.Pten fb-KO, t = 0.21, P = 0.7810). Box graphs are presented as median, 25th percentile, 75th percentile, minimum, and maximum of the group. Statistics were based on one-way ANOVA followed by uncorrected two-sided Fisher’s LSD method for pairwise comparisons or paired t-test. n.s., not significant.
Extended Data Fig. 3. Genetic inhibition of mTORC2 (but not mTORC1) reverses the increased excitatory synaptic transmission in Pten fb-KO mice.
(a-c) Summary data (a-b) and sample traces (c) show increased frequency (a, Control n = 7, Pten fb-KO n = 6, t = 4.62, P < 0.0001), but not amplitude (b, Control n = 7, Pten fb-KO n = 6, t = 0.47, P = 0.641) of spontaneous excitatory postsynaptic currents (sEPSCs) in CA1 neurons from Pten fb-KO mice compared to control littermates. Unlike in Pten-Rptor fb-DKO mice (n = 9; a, c, Control vs. Pten-Rptor fb-DKO: t = 6.26, P <0.0001), in Pten-Rictor fb-DKO mice (n = 5), sEPSC frequency is restored to control values (a, c, Control vs. Pten-Rictor fb-DKO: t = 0.86, P = 0.99). Data are mean ± SEM. Statistics are based on one-way ANOVA followed by uncorrected two-sided Fisher’s LSD method for pairwise comparisons. (d-f) Summary data (d-e) and sample traces (f) show similar frequency (d, Control n = 8, Pten fb-KO n =14, t = 0.47, P = 0.636) and amplitude (e, Control n = 8, Pten fb-KO n =14, t = 0.09, P = 0.925) of spontaneous inhibitory postsynaptic currents (sIPSCs) in CA1 neurons from control and Pten fb-KO mice. atatistics were based two-sided Student’s t-test Data are mean ± SEM. (g) Input-output curves in CA1 pyramidal neurons show that Pten fb-KO mice and Pten-Rptor fb-DKO mice fired more action potentials (APs) than control littermates at 350pA or higher current injection (n = 7 per group, control vs. Pten fb-KO, 350pA: t = 2.76, P = 0.020; 400 pA: t = 3.23, P = 0.0041; 450 pA: t = 4.13, P = 0.0002). By contrast, the increased excitability in Pten fb-KO mice is reduced in Pten-Rictor fb-DKO mice (n = 7 per group, Pten fb-KO vs. Pten-Rictor fb-DKO, 350 pA: t = 2.76, P = 0.020; 400 pA: t = 3.05, P = 0.010; 450 pA: t = 3.42, P = 0.002. Data are mean ± SEM. Statistics were based on two-way ANOVA followed by Bonferroni’s two-sided multiple comparison test. (h) Representative response elicited in CA1 pyramidal neurons (at −70 mV) upon injection of 400 pA for 500 ms.
Extended Data Fig. 4. Genetic inhibition of mTORC2 rescues the deficits in reciprocal social interaction and long-term object recognition memory in Pten fb-KO mice.
(a) Schematic of the reciprocal social interaction task. (b) Compared to controls (n = 11), Pten fb-KO mice (n = 9) show decreased social interaction (t = 3.42, P = 0.0023). The deficits in reciprocal social interaction are restored in Pten-Rictor fb-DKO mice (n = 7, vs. Pten fb-KO mice, t = 4.69, P < 0.0001). (c) Normal freezing responses in Pten fb-KO mice during training. All groups show similar freezing responses either before (naïve: control, n = 15 vs. Pten fb-KO, n = 12, t = 0.13, P = 0.8948; control vs. Pten-Rptor fb-DKO, n = 12, t = 0.32, P = 0.7941; control vs. Pten-Rictor fb-DKO, n = 12, t = 0.04, P = 0.9668) or immediately after training (post-shock: control vs. Pten fb-KO, t = 0.66, P = 0.5904; control vs. Pten-Rptor fb-DKO, t = 1.46, P = 0.1492; control vs. Pten-Rictor fb-DKO, t = 1.23, P = 0.2238). (d) Schematic of the object recognition task. (e) Pten fb-KO mice showed impaired long-term object recognition memory [control (n = 9), Pten fb-KO (n = 6), t = 4.89, P < 0.0001), which was rescued in Pten-Rictor fb DKO mice [Pten-Rictor fb DKO mice (n = 8) vs. Pten fb-KO mice, t = 3.71, P = 0.0014; Pten-Rictor fb DKO mice vs. control, t = 1.18, P = 0.2518]. Data are mean ± SEM. Statistics were based on two-way ANOVA followed by uncorrected two-sided Fisher’s LSD method for pairwise comparisons. n.s., not significant.
Extended Data Fig. 5. Selective increase in p-Akt in Pten fb-KO mice is reduced by genetic inhibition of mTORC2.
Representative western blots (a) and quantifications (b-d) show that compared to control mice, p-Akt at Ser473 (but not p-PKC or p-NDRG1) is the only mTORC2 downstream target whose activity is upregulated in the brain of Pten fb-KO mice [control vs. Pten fb-KO (n = 5-6 per group), p-Akt (b): t = 6.11, P < 0.0001, p-PKC (c): t = 0.64, P = 0.5291, p-NDRG1 (d): t = 0.69, P = 0.4983). As expected, genetic deletion of mTORC2 reduced the activity of all three mTORC2 targets (p-Akt, p-PKC and p-NDRG1) in the brain of Pten-Rictor fb-DKO (n = 6, vs. control p-Akt (b): t = 0.89, P = 0.3903, p-PKC (c): t = 4.56, P = 0.0004, p-NDRG1 (d): t = 2.31, P = 0.0359; vs. Pten fb-KO, p-Akt: t = 7.33, P < 0.0001, p-PKC: t = 3.91, P = 0.0014, p-NDRG1: t = 2.99, P = 0.0090). Compared to Pten fb-KO mice, genetic deletion of mTORC1 in Pten-Rptor fb-DKO did not decrease p-Akt (e-f:,Pten fb-KO (n = 4) vs. Pten-Rptor fb-DKO (n = 6), t = 4.59, P = 0.0005; control (n = 5) vs. Pten-Rptor fb-DKO, t = 9.31, P < 0.0001), p-PKC (e,g:,Pten fb-KO (n = 4) vs. Pten-Rptor fb-DKO (n = 5), t = 0.65, P = 0.5332; control (n = 4) vs. Pten-Rptor fb-DKO, t = 0.73, P = 0.4820) or p-NDRG1 (e,h: Pten fb-KO (n = 4) vs. Pten-Rptor fb-DKO (n = 5), t = 1.19, P = 0.2581; control (n = 4) vs. Pten-Rptor fb-DKO, t = 0.46, P = 0.6527). Data are mean ± SEM. Statistics were based on one-way ANOVA followed by uncorrected two-sided Fisher’s LSD method for pairwise comparisons. n.s., not significant.
Extended Data Fig. 6. Genetic inhibition of mTORC2 rescues the changes in glucose metabolism in the brain of Pten fb-KO mice.
(a) Schematic of mTORC2 regulation of glucose metabolism through the phosphorylation of Akt. (b-d) Metabolomic study revealed an increase in glycolysis metabolites in Pten fb-KO mice, which is normalized when mTORC2, but not mTORC1, is inhibited. The level of glucose (b), glucose-6-phosphate (c) and lactate (d) were increased in the cortex of Pten fb-KO mice (control (n = 8) vs. Pten fb-KO (n = 7): glucose, t = 3.51, P = 0.0017; glucose-6-phosphate, t = 2.77, P = 0.0103; lactate, t = 2.41, P = 0.024). The changes in glucose metabolism are reversed in Pten-Rictor fb-DKO mice (n = 7, vs. control: glucose, t = 0.067, P = 0.9469; glucose-6-phosphate, t = 0.39, P = 0.7009; lactate t = 1.39, P = 0.1771), but not in Pten-Rptor fb-DKO mice [Pten-Rictor fb-KO mice (n = 7) vs. Pten-Rptor fb-DKO (n = 7): glucose, t = 1.07, P = 0.2962; glucose-6-phosphate, t = 1.55, P = 0.1355; lactate t = 0.39, P = 0.6993). Data are mean ± SEM. Statistics were based on one-way ANOVA followed by uncorrected two-sided Fisher’s LSD method for pairwise comparisons. n.s., not significant.
Extended Data Fig. 7. No major changes in mitochondria number, electron transport chain function or the abundance of TCA cycle metabolites in the brain of Pten fb-KO mice.
(a-b) No differences in mitochondria DNA copy number (a, n = 5 per group, F3,16 = 0.21, P = 0.1229) or ETC enzyme activity [b, control (n = 4) Pten fb-KO (n = 3), Pten-Rptor fb-KO (n = 3), Pten-Rictor fb-KO (n = 3), F3,9 = 0.16, P = 0.3782) were observed between the cortexes of control and Pten-deficient mice. (c) The abundance of TCA cycle metabolites did not dramatically change in the brain of Pten fb-KO mice [control (n = 8) vs. Pten fb-KO (n = 7): citrate, t = 0.60, P = 0.5512; alpha-ketoglutarate, t = 1.45, P = 0.1545; malate, t = 1.79, P = 0.0858, fumarate, t = 0.3983, P = 0.69. Control vs. Pten-Rptor fb-DKO (n = 7): citrate, t = 0.95, P = 0.3522; alpha-ketoglutarate, t = 0.62, P = 0.5404; malate, t = 0.41, P = 0.6833; fumarate, t = 1.37, P = 0.1816. control vs. Pten-Rictor fb-DKO n = 7, citrate, t = 0.5512, P = 0.5864; alpha-ketoglutarate, t = 0.2, P = 0.8455; malate, t = 0.43, P = 0.6687, fumarate, t = 0.39, P = 0.6973]. Data are mean ± SEM. Statistics were based on one-way ANOVA followed by uncorrected two-sided Fisher’s LSD method for pairwise comparisons. n.s., not significant.
Extended Data Fig. 8. ASO-A (Rictor-ASO) reduces mTORC2 (but not mTORC1) activity in cortical neurons in culture.
(a-b) Cortical neurons were treated for 72 hours with different ASOs (10 μM) designed to target Rictor mRNA. Representative western blots (a) and quantification (b) show that ASO-A strongly reduces both rictor protein level (n = 4 per group, t6 = 10.94, P = 0.0001) and mTORC2 activity (t6 = 7.25, P = 0.0010), but had no effect on mTORC1 activity (t6 = 0.33, P = 0.9846). Data are mean ± SEM. Values were compared relative to the vehicle treated group and statistics were based on two-sided t-test comparisons. n.s., not significant.
Extended Data Fig. 9. Rictor-ASO selectively reduces Rictor mRNA levels in vivo and is safe.
Control mice were injected with Rictor-ASO and monitored for 5 weeks after injection. (a) Rictor-ASO reduced Rictor mRNA levels in spinal cord (n = 4 per group, t6 = 40.76, P < 0.0001), cortex (n = 4 per group, t6 = 16.77, P < 0.0001) and cerebellum (n = 4 per group, t6 = 11.44, P < 0.001). (b) Rictor-ASO-injected mice showed normal weight gain several weeks post-injection (F5,30 = 2,10, P = 0.0875). (c) mRNA expression of gliosis marker (Gfap) and microglia inflammatory markers (Aif1, CD68) were normal in the brain of Rictor-ASO injected mice (Aif1: n = 4 per group, t6 = 0.60, P = 0.544; CD68: n = 4 per group, t6 = 2.12, P = 0.783; Gfap: n = 4 per group, t6 = 0.17, P = 0.8673). Circles represent number of animals per condition. (d) Control mice were injected with Rictor-ASO and the hippocampus was isolated 2 weeks post-injection. Rictor-ASO selectively reduces Rictor mRNA levels, but did not change the expression of Nisch, Plus7, GM6943, GM9265, GM9295 and GM5954 (n = 4 per group, PBS vs. Rictor-ASO: Rictor: t6 = 3.06, P = 0.0223; Nisch: t6 = 1.11, P = 0.3094; Pus7l: t6 = 1.40, P = 0.2106; GM6943: t6 = 0.54, P = 0.6061, GM9265: t6 = 0.48, P = 0.6513; GM9295: t6 = 0.39, P = 0.71; GM5954: t6 = 1.19, P = 0.2763). Data are mean ± SEM. n represents one biological independent mouse. Statistics were based on two-sided t-test comparisons. n.s., not significant.
Extended Data Fig. 10. A control ASO (Control-ASO) failed to reduce Rictor mRNA levels and inhibit mTORC2 activity.
(a) Treatment with Control-ASO did not reduce Rictor mRNA [PBS (n = 6) vs. Control-ASO (n = 4), t8 = 1.88, P = 0.0968]. Representative western blot image (b) and quantification of (c-d) show that Control-ASO did not decrease rictor protein levels (n = 4 per group, PBS vs. control-ASO t6 = 0.57, P = 0.5864) or mTORC2 activity (n = 4 per group, PBS vs. control-ASO, t6 = 0.71, P = 0.5018). Data are mean ± SEM. Statistics were based on two-sided t-test comparisons. n.s., not significant.
Acknowledgements
We thank A. Placzek and members of the Costa-Mattioli’ laboratory for comments on the manuscript. This work was supported by funds to M. C.-M. (NIMH 096816, Department of Defense AR120254, and Sammons Enterprises), J.N. (NINDS NS29709) and J.C. (NS085171).
Footnotes
Competing Interest Statement
P.J.-N. and F.R are employed by Ionis Pharmaceutical, a company that develops ASO therapies. The authors declare no competing financial interest.
References
- 1.Ehninger D & Silva AJ Rapamycin for treating Tuberous sclerosis and Autism spectrum disorders. Trends in molecular medicine 17, 78–87 (2011). [DOI] [PMC free article] [PubMed] [Google Scholar]
- 2.Winden KD, Ebrahimi-Fakhari D & Sahin M Abnormal mTOR Activation in Autism. Annual review of neuroscience (2018). [DOI] [PubMed] [Google Scholar]
- 3.Costa-Mattioli M & Monteggia LM mTOR complexes in neurodevelopmental and neuropsychiatric disorders. Nature neuroscience 16, 1537–1543 (2013). [DOI] [PubMed] [Google Scholar]
- 4.Zhou J & Parada LF PTEN signaling in autism spectrum disorders. Current opinion in neurobiology (2012). [DOI] [PubMed] [Google Scholar]
- 5.Knafo S & Esteban JA PTEN: Local and Global Modulation of Neuronal Function in Health and Disease. Trends in neurosciences 40, 83–91 (2017). [DOI] [PubMed] [Google Scholar]
- 6.Kelleher RJ 3rd & Bear MF The autistic neuron: troubled translation? Cell 135, 401–406 (2008). [DOI] [PubMed] [Google Scholar]
- 7.Hoeffer CA & Klann E mTOR signaling: at the crossroads of plasticity, memory and disease. Trends in neurosciences 33, 67–75 (2010). [DOI] [PMC free article] [PubMed] [Google Scholar]
- 8.Lipton JO & Sahin M The neurology of mTOR. Neuron 84, 275–291 (2014). [DOI] [PMC free article] [PubMed] [Google Scholar]
- 9.Wullschleger S, Loewith R & Hall MN TOR signaling in growth and metabolism. Cell 124, 471–484 (2006). [DOI] [PubMed] [Google Scholar]
- 10.Saxton RA & Sabatini DM mTOR Signaling in Growth, Metabolism, and Disease. Cell 169, 361–371 (2017). [DOI] [PubMed] [Google Scholar]
- 11.Sarbassov DD, et al. Rictor, a novel binding partner of mTOR, defines a rapamycin-insensitive and raptor-independent pathway that regulates the cytoskeleton. Current biology : CB 14, 1296–1302 (2004). [DOI] [PubMed] [Google Scholar]
- 12.Hay N & Sonenberg N Upstream and downstream of mTOR. Genes & development 18, 1926–1945 (2004). [DOI] [PubMed] [Google Scholar]
- 13.Buffington SA, Huang W & Costa-Mattioli M Translational control in synaptic plasticity and cognitive dysfunction. Annual review of neuroscience 37, 17–38 (2014). [DOI] [PMC free article] [PubMed] [Google Scholar]
- 14.Crino PB The mTOR signalling cascade: paving new roads to cure neurological disease. Nature reviews. Neurology 12, 379–392 (2016). [DOI] [PubMed] [Google Scholar]
- 15.Zhou J, et al. Pharmacological inhibition of mTORC1 suppresses anatomical, cellular, and behavioral abnormalities in neural-specific Pten knock-out mice. The Journal of neuroscience : the official journal of the Society for Neuroscience 29, 1773–1783 (2009). [DOI] [PMC free article] [PubMed] [Google Scholar]
- 16.Ljungberg MC, Sunnen CN, Lugo JN, Anderson AE & D’Arcangelo G Rapamycin suppresses seizures and neuronal hypertrophy in a mouse model of cortical dysplasia. Disease models & mechanisms 2, 389–398 (2009). [DOI] [PMC free article] [PubMed] [Google Scholar]
- 17.Nguyen LH, et al. mTOR inhibition suppresses established epilepsy in a mouse model of cortical dysplasia. Epilepsia 56, 636–646 (2015). [DOI] [PMC free article] [PubMed] [Google Scholar]
- 18.Hobert JA, Embacher R, Mester JL, Frazier TW 2nd, & Eng C Biochemical screening and PTEN mutation analysis in individuals with autism spectrum disorders and macrocephaly. Eur J Hum Genet 22, 273–276 (2014). [DOI] [PMC free article] [PubMed] [Google Scholar]
- 19.Tilot AK, et al. Neural transcriptome of constitutional Pten dysfunction in mice and its relevance to human idiopathic autism spectrum disorder. Molecular psychiatry 21, 118–125 (2016). [DOI] [PMC free article] [PubMed] [Google Scholar]
- 20.McBride KL, et al. Confirmation study of PTEN mutations among individuals with autism or developmental delays/mental retardation and macrocephaly. Autism research : official journal of the International Society for Autism Research 3, 137–141 (2010). [DOI] [PubMed] [Google Scholar]
- 21.Hu WF, Chahrour MH & Walsh CA The diverse genetic landscape of neurodevelopmental disorders. Annual review of genomics and human genetics 15, 195–213 (2014). [DOI] [PMC free article] [PubMed] [Google Scholar]
- 22.Mirzaa GM & Poduri A Megalencephaly and hemimegalencephaly: breakthroughs in molecular etiology. American journal of medical genetics. Part C, Seminars in medical genetics 166C, 156–172 (2014). [DOI] [PubMed] [Google Scholar]
- 23.Kwon CH, et al. Pten regulates neuronal arborization and social interaction in mice. Neuron 50, 377–388 (2006). [DOI] [PMC free article] [PubMed] [Google Scholar]
- 24.Backman SA, et al. Deletion of Pten in mouse brain causes seizures, ataxia and defects in soma size resembling Lhermitte-Duclos disease. Nature genetics 29, 396–403 (2001). [DOI] [PubMed] [Google Scholar]
- 25.Kwon CH, et al. Pten regulates neuronal soma size: a mouse model of Lhermitte-Duclos disease. Nature genetics 29, 404–411 (2001). [DOI] [PubMed] [Google Scholar]
- 26.Ostendorf AP & Wong M mTOR inhibition in epilepsy: rationale and clinical perspectives. CNS drugs 29, 91–99 (2015). [DOI] [PMC free article] [PubMed] [Google Scholar]
- 27.Noebels JL Single-Gene Determinants of Epilepsy Comorbidity. Cold Spring Harbor perspectives in medicine 5(2015). [DOI] [PMC free article] [PubMed] [Google Scholar]
- 28.Fombonne E The epidemiology of autism: a review. Psychological medicine 29, 769–786 (1999). [DOI] [PubMed] [Google Scholar]
- 29.Kazdoba TM, et al. Translational Mouse Models of Autism: Advancing Toward Pharmacological Therapeutics. Curr Top Behav Neurosci 28, 1–52 (2016). [DOI] [PMC free article] [PubMed] [Google Scholar]
- 30.Jiang YH & Ehlers MD Modeling autism by SHANK gene mutations in mice. Neuron 78, 8–27 (2013). [DOI] [PMC free article] [PubMed] [Google Scholar]
- 31.American Psychiatric Association. & American Psychiatric Association. DSM-5 Task Force Diagnostic and statistical manual of mental disorders : DSM-5, (American Psychiatric Association, Washington, D.C., 2013). [Google Scholar]
- 32.Lopez BR, Lincoln AJ, Ozonoff S & Lai Z Examining the relationship between executive functions and restricted, repetitive symptoms of Autistic Disorder. J Autism Dev Disord 35, 445–460 (2005). [DOI] [PubMed] [Google Scholar]
- 33.Stoica L, et al. Selective pharmacogenetic inhibition of mammalian target of Rapamycin complex I (mTORC1) blocks long-term synaptic plasticity and memory storage. Proceedings of the National Academy of Sciences of the United States of America 108, 3791–3796 (2011). [DOI] [PMC free article] [PubMed] [Google Scholar]
- 34.Huang W, et al. mTORC2 controls actin polymerization required for consolidation of long-term memory. Nature neuroscience 16, 441–448 (2013). [DOI] [PMC free article] [PubMed] [Google Scholar]
- 35.Garcia-Cao I, et al. Systemic elevation of PTEN induces a tumor-suppressive metabolic state. Cell 149, 49–62 (2012). [DOI] [PMC free article] [PubMed] [Google Scholar]
- 36.Hagiwara A, et al. Hepatic mTORC2 activates glycolysis and lipogenesis through Akt, glucokinase, and SREBP1c. Cell metabolism 15, 725–738 (2012). [DOI] [PubMed] [Google Scholar]
- 37.Masui K, et al. mTOR complex 2 controls glycolytic metabolism in glioblastoma through FoxO acetylation and upregulation of c-Myc. Cell metabolism 18, 726–739 (2013). [DOI] [PMC free article] [PubMed] [Google Scholar]
- 38.Panasyuk G, et al. PPARgamma contributes to PKM2 and HK2 expression in fatty liver. Nat Commun 3, 672 (2012). [DOI] [PMC free article] [PubMed] [Google Scholar]
- 39.Robey RB & Hay N Is Akt the “Warburg kinase”?-Akt-energy metabolism interactions and oncogenesis. Seminars in cancer biology 19, 25–31 (2009). [DOI] [PMC free article] [PubMed] [Google Scholar]
- 40.Rinaldi C & Wood MJA Antisense oligonucleotides: the next frontier for treatment of neurological disorders. Nat Rev Neurol 14, 9–21 (2018). [DOI] [PubMed] [Google Scholar]
- 41.Vickers TA, et al. Efficient reduction of target RNAs by small interfering RNA and RNase H-dependent antisense agents. A comparative analysis. The Journal of biological chemistry 278, 7108–7118 (2003). [DOI] [PubMed] [Google Scholar]
- 42.Cioffi CL, et al. Selective inhibition of A-Raf and C-Raf mRNA expression by antisense oligodeoxynucleotides in rat vascular smooth muscle cells: role of A-Raf and C-Raf in serum-induced proliferation. Molecular pharmacology 51, 383–389 (1997). [PubMed] [Google Scholar]
- 43.Zhang H, et al. Reduction of liver Fas expression by an antisense oligonucleotide protects mice from fulminant hepatitis. Nature biotechnology 18, 862–867 (2000). [DOI] [PubMed] [Google Scholar]
- 44.Langmead B, Trapnell C, Pop M & Salzberg SL Ultrafast and memory-efficient alignment of short DNA sequences to the human genome. Genome biology 10, R25 (2009). [DOI] [PMC free article] [PubMed] [Google Scholar]
Methods-only References
- 45.Kwon CH, et al. Pten regulates neuronal soma size: a mouse model of Lhermitte-Duclos disease. Nature genetics 29, 404–411 (2001). [DOI] [PubMed] [Google Scholar]
- 46.Huang W, et al. mTORC2 controls actin polymerization required for consolidation of long-term memory. Nature neuroscience 16, 441–448 (2013). [DOI] [PMC free article] [PubMed] [Google Scholar]
- 47.Zhu PJ, et al. Suppression of PKR promotes network excitability and enhanced cognition by interferon-gamma-mediated disinhibition. Cell 147, 1384–1396 (2011). [DOI] [PMC free article] [PubMed] [Google Scholar]
- 48.Buffington SA, et al. Microbial Reconstitution Reverses Maternal Diet-Induced Social and Synaptic Deficits in Offspring. Cell 165, 1762–1775 (2016). [DOI] [PMC free article] [PubMed] [Google Scholar]
- 49.Silverman JL, Yang M, Lord C & Crawley JN Behavioural phenotyping assays for mouse models of autism. Nature reviews. Neuroscience 11, 490–502 (2010). [DOI] [PMC free article] [PubMed] [Google Scholar]
- 50.Deacon RM & Rawlins JN T-maze alternation in the rodent. Nat Protoc 1, 7–12 (2006). [DOI] [PubMed] [Google Scholar]
- 51.Stoica L, et al. Selective pharmacogenetic inhibition of mammalian target of Rapamycin complex I (mTORC1) blocks long-term synaptic plasticity and memory storage. Proceedings of the National Academy of Sciences of the United States of America 108, 3791–3796 (2011). [DOI] [PMC free article] [PubMed] [Google Scholar]
- 52.Johnson JL, Huang W, Roman G & Costa-Mattioli M TORC2: a novel target for treating age-associated memory impairment. Scientific reports 5, 15193 (2015). [DOI] [PMC free article] [PubMed] [Google Scholar]
- 53.Zhu PJ, Chen CJ, Mays J, Stoica L & Costa-Mattioli M mTORC2, but not mTORC1, is required for hippocampal mGluR-LTD and associated behaviors. Nature neuroscience 21, 799–802 (2018). [DOI] [PMC free article] [PubMed] [Google Scholar]
- 54.Huang W, et al. Translational control by eIF2alpha phosphorylation regulates vulnerability to the synaptic and behavioral effects of cocaine. eLife 5(2016). [DOI] [PMC free article] [PubMed] [Google Scholar]
- 55.Ma Y, Bai RK, Trieu R & Wong LJ Mitochondrial dysfunction in human breast cancer cells and their transmitochondrial cybrids. Biochimica et biophysica acta 1797, 29–37 (2010). [DOI] [PMC free article] [PubMed] [Google Scholar]
- 56.Frazier AE & Thorburn DR Biochemical analyses of the electron transport chain complexes by spectrophotometry. Methods Mol Biol 837, 49–62 (2012). [DOI] [PubMed] [Google Scholar]
- 57.Venegas V & Halberg MC Measurement of mitochondrial DNA copy number. Methods Mol Biol 837, 327–335 (2012). [DOI] [PubMed] [Google Scholar]
- 58.Swayze EE, et al. Antisense oligonucleotides containing locked nucleic acid improve potency but cause significant hepatotoxicity in animals. Nucleic acids research 35, 687–700 (2007). [DOI] [PMC free article] [PubMed] [Google Scholar]
- 59.Langmead B, Trapnell C, Pop M & Salzberg SL Ultrafast and memory-efficient alignment of short DNA sequences to the human genome. Genome biology 10, R25 (2009). [DOI] [PMC free article] [PubMed] [Google Scholar]
Associated Data
This section collects any data citations, data availability statements, or supplementary materials included in this article.
Supplementary Materials
Data Availability Statement
The data supporting the findings of this study are available in the paper or supplementary information. Full uncropped blots are available as Source data. Any other raw data that supports the findings of this study is available from the corresponding author upon reasonable request. The request of Rictor-ASO will be promptly reviewed by Ionis Pharmaceuticals to verify that the request is subject to any intellectual property confidential obligations. If not, the ASO will be available upon completion of a standard Material Transfer Agreement with Ionis Pharmaceuticals.


