

Abstract
Human obesity has become a global health epidemic, with few safe and effective pharmacological therapies currently available. The systemic loss of ovarian estradiol (E2) in women following menopause greatly increases the risk of obesity and metabolic dysfunction, revealing the critical role of E2 in this setting. The salutary effects of E2 are traditionally attributed to the classical estrogen receptors ERα and ERβ, with the contribution of the G protein-coupled estrogen receptor (GPER) still largely unknown. Here we used ovariectomy- and diet-induced obesity (DIO) mouse models to evaluate the preclinical activity of GPER-selective small molecule agonist G-1 (also called Tespria) against obesity and metabolic dysfunction. G-1 treatment of ovariectomized female mice (a model of post-menopausal obesity) reduced body weight and improved glucose homeostasis without changes in food intake, fuel source usage, or locomotor activity. G-1-treated female mice also exhibited increased energy expenditure, lower body fat content, and reduced fasting cholesterol, glucose, insulin, and inflammatory markers, but did not display feminizing effects on the uterus (imbibition) or beneficial effects on bone health. G-1 treatment of DIO male mice did not elicit weight loss but prevented further weight gain and improved glucose tolerance, indicating that G-1 improved glucose homeostasis independently of its anti-obesity effects. However, in ovariectomized DIO female mice, G-1 continued to elicit weight loss, reflecting possible sex differences in the mechanisms of G-1 action. In conclusion, this work demonstrates that GPER-selective agonism is a viable therapeutic approach against obesity, diabetes, and associated metabolic abnormalities in multiple preclinical male and female models.
One-sentence summary:
Targeting the G protein-coupled estrogen receptor GPER with a highly selective agonist ameliorates obesity and diabetes in mice.
INTRODUCTION
Diet, lifestyle, and environmental factors have contributed to the global obesity epidemic (1, 2). Currently in the United States, about two-thirds of the population is overweight (BMI > 25 kg/m2) and ~40% are obese (BMI > 30 kg/m2), proportions that have increased up to 3-fold in the last ~30 years (3). With obesity comes an increased risk of metabolic syndrome (namely, diabetes, arterial hypertension, stroke, cardiovascular disease) and cancer. To date, few treatments have been successful in counteracting or reversing obesity, with most acting through the central nervous system to regulate satiety or satiation through appetite suppression (1). Of the US Food & Drug Administration (FDA)-approved weight loss drugs, several have been withdrawn due to unexpected toxicity (for example, fenfluramine and sibutramine) or have undesirable side effects such as steatorrhea in the case of lipase inhibitors (for example, orlistat) (4). Approaches employing vascular targeting of adipose tissue such as adipotide have shown promise (5, 6) but remain investigational. Glucagon-like peptide-1 (GLP-1) receptor agonists (for example, liraglutide and semaglutide), originally designed to treat diabetes (7), have recently shown efficacy in obesity, although not without side effects (8). Unfortunately, “effective” marketed drugs only result in sustained weight loss of typically ~5%, even with patients adhering to strict diets, due in part to adaptive thermogenesis or metabolic adaptation (9). Thus, it is imperative to identify targets, pathways, and drug classes to treat obesity and its associated complications (10).
The main female estrogen 17β-estradiol (E2) exerts sexually dimorphic protective effects on metabolism and cardiovascular physiology through diverse molecular and cellular pathways (11), preventing visceral obesity, hyperlipidemia, insulin resistance, inflammation and hypertension in pre-menopausal women compared to age-matched men (12–14). Thus, postmenopausal women exhibit an increased susceptibility to weight gain and associated metabolic dysfunction due to the loss of estrogenic protection, which can be ameliorated by E2 supplementation (14). The metabolic effects of E2 have been largely attributed to the nuclear estrogen receptors α and β (ERα and ERβ) that conventionally function as ligand-activated transcription factors (15), although rapid signaling in response to E2 has become recognized as critical to overall estrogenic activities (16–18). Based on both genetic and pharmacological approaches, an accumulating body of evidence reveals that the G protein-coupled estrogen receptor (GPER, previously known as GPR30) plays an important role in the actions of E2 and specifically the regulation of metabolism, as well as cardiovascular function and cancer (19–24).
Our previous studies have shown that male GPER knockout (KO) mice recapitulate many aspects of metabolic syndrome, including obesity, increased gonadal fat pad mass, dyslipidemia, insulin resistance, glucose intolerance, and inflammation (25). GPER KO mice exhibit a sexual temporal dimorphism, in which male GPER KO mice gain weight earlier than female GPER KO mice, although both male and female GPER KO mice show marked reductions in energy expenditure and expression of thermogenic genes in brown fat (26). Furthermore, female (but not male) GPER KO mice were less sensitive to the anorectic effects of leptin and cholecystokinin compared to isogenic wild-type (WT) mice, and E2 supplementation of ovariectomized (OVX) GPER KO mice did not reduce body weight (26). Together, these findings provide strong evidence that E2 may regulate body weight and metabolism, at least in part, via known and perhaps as yet unknown GPER-mediated mechanisms.
In this study, we report the metabolic effects and therapeutic benefits of selective GPER activation in vivo. We employed both OVX female mice, as a model of postmenopausal E2 loss, and diet-induced obesity (DIO) in male and OVX female mice, all of which exhibit weight gain and metabolic dysfunction. As E2 binds non-selectively to all three receptors (ERα, ERβ and GPER), we selectively activated GPER by employing its only known highly selective small molecule (MW 412.3 Da) agonist, G-1 (hereafter termed G-1) (27–32). Our results demonstrate that GPER activation by G-1 may represent a translational approach by a lead prototype agent in the treatment of human obesity and aspects of metabolic syndrome, particularly diabetes, in postmenopausal women as well as in men.
RESULTS
GPER activation reduces obesity resulting from estrogen deficiency
Previous studies from our group (25, 33, 34) and other investigators (35) have shown that GPER deficiency in mice results in obesity with concomitant disturbances in glucose and lipid homeostasis, although one report has found the opposite (36). Thus, we sought to determine whether activation of GPER in E2-deficient mice can alleviate obesity and symptoms of metabolic dysfunction in this setting. To address this possibility, we utilized an OVX mouse model in which bilateral surgical removal of the ovaries, resulting in the marked loss of endogenous E2, leads to multiple aspects of metabolic dysfunction, similar to that in either surgically or naturally (age-related) postmenopausal women. In our study, female mice were OVX at 10 weeks of age (mean body weight 22.5 ± 1.6 g) and allowed to feed ad libitum on normal chow (NC) for an additional 12 weeks. At this point, the difference between the mean body weights of ovary-intact and OVX cohorts of mice was 5.3 g (29.2 ± 0.8 vs. 34.5 ± 2.8 g respectively, p<0.01), an increase of about 18% body weight in the OVX cohort (Fig. 1A). Furthermore, the OVX mice also displayed impaired glucose homeostasis as revealed by elevated baseline blood glucose and impaired glucose and insulin tolerance (fig. S1). Subsequently, OVX mice were randomized into two cohorts treated with either the GPER-selective agonist G-1 or vehicle for an additional 6 weeks and compared to an age-matched cohort of ovary-intact mice.
Fig. 1. Selective activation of GPER in OVX mice attenuates obesity.

Body weight in OVX mice after treatment with GPER agonist G-1 compared to vehicle (Veh) controls and ovary-intact mice (A) over time and (B) at termination of the study. Images of representative mice are shown in (B). The weight of the perigonadal (C) and perirenal (D) fat pads, circulating cholesterol (E) and uterine wet weight (F) were determined at termination of the study. A, n=5 (Intact) −14 (OVX+Veh, OVX+G-1); B, n=13; C, D, F, n=7: E, n=6). A, two-way ANOVA; *P < 0.05, **P < 0.01, ***P < 0.001 for vehicle treatment vs. ovary intact controls, respectively; #P < 0.05 for G-1 treatment vs. vehicle treatment. B-F, one-way ANOVA with Bonferroni post-hoc test.
During the 6-week G-1 treatment period, body weights were measured weekly. Whereas ovary-intact mice demonstrated a slight increase in weight from 29.2 ± 0.8 g to 30.7 ± 0.4 g (p=ns), vehicle-treated OVX mice did not exhibit any detectable changes in weight (Fig. 1A). In contrast, G-1 treatment of OVX mice led to a progressive loss of body weight, first detectable at 2 weeks of treatment (vehicle, 35.1 ± 0.7 g vs. G-1, 32.9 ± 0.6 g, p< 0.05). From that point forward, G-1-treated mice continued to lose weight, such that by 4 weeks of treatment, their weights were similar to those of ovary-intact animals (intact, 30.4 ± 0.7 vs. G-1 treatment, 31.8 ± 0.7, p=0.25), similar to that observed at termination of the experiment when mice were euthanized (Fig. 1B).
At the end of the treatment period, dissection of perigonadal (Fig. 1C) and perirenal (Fig. 1D) fat pads revealed that G-1 reduced the wet weights of both fat pads in OVX mice. As obesity results in dyslipidemia, we also analyzed fasting circulating plasma lipids, which revealed that ovariectomy increased total cholesterol in mice and that G-1 treatment markedly reduced cholesterol in OVX mice to concentrations of ovary-intact control mice (Fig. 1E). Triglycerides, however, were not statistically different between any treatment cohorts (ovary intact, 63.1 ± 3.8 mg/dL; OVX + vehicle, 62.8 ± 4.4 mg/dL; OVX + G-1, 60.8 ± 5.6 mg/dL). Because E2 treatment is known to promote uterotrophic actions such as imbibition (an increase in wet weight) in OVX mice, uterine wet weights were also determined. As expected, ovariectomy resulted in a substantial decrease in uterine wet weight; however, G-1 treatment had no effect on uterine wet weight when compared to vehicle-treated OVX mice (Fig. 1F), extending our previous observations that acute G-1 treatment does not promote the classical feminizing reproductive effects resulting from E2 treatment (28).
Analysis of body composition as determined by dual–energy X-ray absorptiometry (DEXA) and magnetic resonance imaging (MRI) confirmed a marked increase in body fat upon ovariectomy, with G-1 treatment substantially reducing overall fat in OVX mice (Fig. 2). DEXA scans revealed lower body fat content (Fig. 2A and B) and body fat percentage (Fig. 2C) in G-1-treated OVX mice without any changes in lean mass (Fig. 2D), bone mineral density (Fig. 2E) or bone mineral content (Fig. 2F) in comparison to vehicle-treated OVX mice. However, ovary-intact mice had higher bone mineral density and bone mineral content as compared to either vehicle- or G-1-treated OVX cohorts, indicating that G-1 is not effective, thereby differing from E2 (37), in preventing bone loss (Fig. 2E and F). Furthermore, quantitation of fat-water MRI images revealed that while OVX increases overall abdominal (Fig. 2G and H) and subcutaneous fat (Fig. 2I and J), G-1 treatment led to a loss of fat in both fat depots to amounts near to those of ovary-intact mice.
Fig. 2. Treatment with GPER-selective agonist G-1 reduces fat content in OVX mice.

(A) Representative DEXA scans, (B) overall body fat content, (C) body fat percentage, (D) lean mass, (E) bone mineral density and (F) bone mineral content in vehicle- and G-1-treated OVX mice compared to ovary-intact animals. Representative anatomical MRI images of the (G) coronal and (I) axial view in different mouse cohorts with quantification of (H) total (from coronal view) and (J) subcutaneous (from axial view) fat content. B-F, n=6; H and J, n=4. All tests one-way ANOVA with Bonferroni post-hoc test.
OVX mice exhibit increased energy expenditure after G-1 treatment
Lower body weight and decreased fat accumulation as observed with G-1 treatment could have resulted from either reduced caloric intake or increased energy expenditure, which itself may be the result of either enhanced basal metabolic rate or locomotion. To differentiate between these possibilities, mice were placed in metabolic cages to measure food intake, energy expenditure (measured as VO2) and respiratory exchange ratio [RER, the ratio of carbon dioxide production (VCO2) divided by oxygen consumption (VO2)]. RER provides an estimate of the fuel source used for energy production based on the difference in the amount of oxygen required for glucose versus fatty acid oxidation. An RER value of ~0.7 indicates that fat is the predominant fuel source, with a value of ~0.85 suggesting a mix of fat and carbohydrates, and an RER value of ~1 or above indicating carbohydrate as the predominant fuel source (38). Compared to ovary-intact mice, vehicle-treated OVX mice showed a marked reduction in energy expenditure, RER, and locomotor activity during both the light and dark cycles, with no detectable effects on food intake (Fig. 3A–F). However, G-1-treated ovariectomized mice displayed increased energy expenditure in both light as well as dark cycles compared to vehicle-treated mice (Fig. 3A and C) but the RER did not change (ranging between 0.75 to 0.85), suggesting a mix of carbohydrates and fat as the energy source. In contrast, the RER for ovary-intact mice during dark cycle was close to 1, indicating carbohydrate as the primary energy source (Fig 3B). Furthermore, G-1 had no effect on food intake (Fig. 3D) or locomotor activity (Fig. 3 E and F) in ovariectomized mice compared to vehicle controls. Taken together, these results demonstrate that G-1 treatment increases energy expenditure by using fat as one of the main energy sources, in the absence of effects on food intake or locomotor activity.
Fig. 3. GPER activation in OVX mice increases energy expenditure.

(A) Energy expenditure over time (VO2, mL/hr), (B) respiratory exchange ratio over time (VCO2/VO2), (C) oxygen consumption (VO2, total, light and dark phases), (D) food intake and (E) locomotor activity over time and (F) total, light and dark phases, in vehicle- and G-1-treated OVX mice compared to the ovary-intact control animals. A-C, n=6 (Intact) −8 (OVX+Veh, OVX+G-1); D-F, n=4-7. All tests one-way ANOVA with Bonferroni post-hoc test.
Adipose tissue remodeling in OVX mice following G-1 treatment
The attenuation of obesity and enhanced energy expenditure (Fig. 3) following G-1 treatment in OVX mice suggests that the GPER agonist exerts these beneficial effects in part through modulation of adipose tissue. Adipose tissue undergoes marked metabolic and functional changes during obesity, including an increase in the size of adipocytes, hypoxia, inflammation, and changes in glucose and lipid metabolism (39, 40). OVX mice treated with vehicle alone exhibited an increase in the size of both the overall fat pad as well as individual adipocytes (Fig. 1C, Fig. 4A and B). In addition to reducing the overall weight and size of the perigonadal fat pad, G-1 treatment also reduced the size of individual adipocytes relative to vehicle-treated OVX mice (Fig. 4A and B), indicating enhanced metabolism in adipose tissue.
Fig. 4. Adipose tissue remodeling in OVX mice treated with GPER-selective agonist G-1.
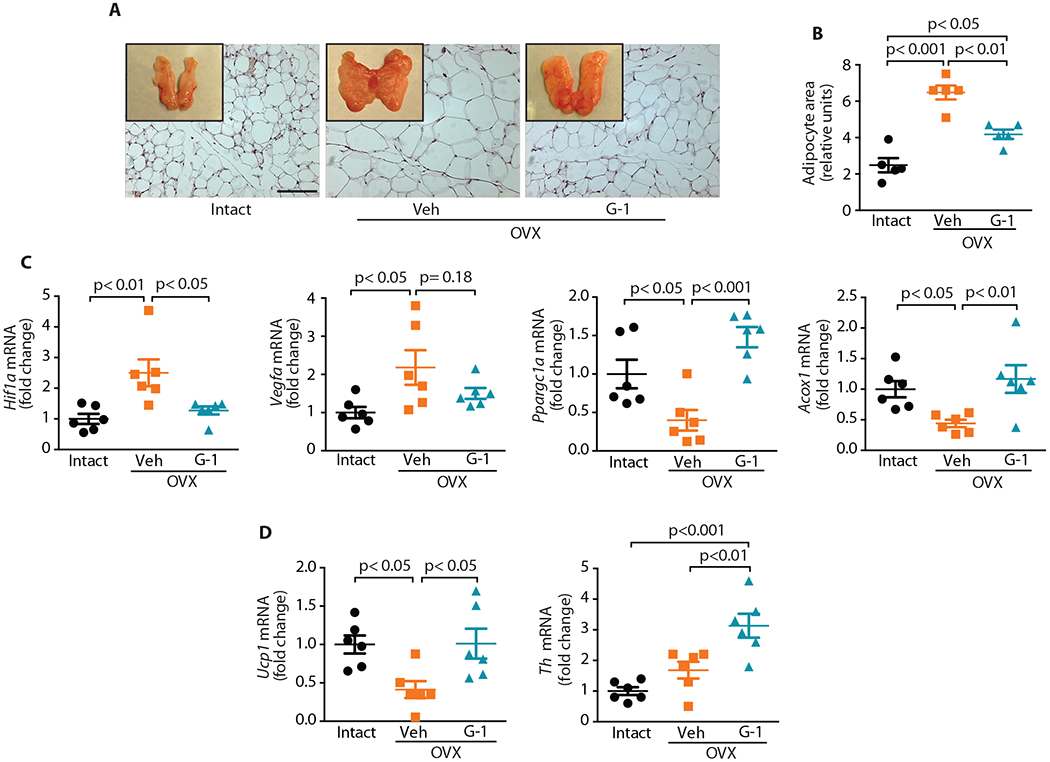
(A) Perigonadal fat pads (whole mount and H&E stained sections; scale bar, 100 μm) and (B) mean adipocyte area as quantified after H&E staining in (A) (n=5). (C) Gene expression analyses in perigonadal WAT for genes involved in angiogenesis (Hif1a and Vegfa) and mitochondrial biogenesis (Ppargc1a) and fatty acid oxidation (Acox1) (n=6). (D) Gene expression analyses in BAT for genes involved in thermogenesis (Ucp1) and sympathetic innervation (Th) (n=6). All tests one-way ANOVA with Bonferroni post-hoc test.
Obesity leads to adipose tissue expansion by modulating the expression of key genes involved in hypoxia and angiogenesis (39, 41). We therefore investigated whether G-1 treatment modulates the expression of genes involved in multiple aspects of adipose function. Gene expression of peroxisome proliferator-activated receptor-gamma coactivator 1α (Ppargc1a, a regulator of cellular energy metabolism), peroxisomal acyl-coenzyme A oxidase (Acox1, which catalyzes fatty acid beta-oxidation), hypoxia-inducible factor 1-alpha (Hif1a) and vascular endothelial growth factor (Vegfa), the latter two being important mediators of angiogenesis and tissue expansion, was analyzed by RT-qPCR (39, 41). OVX increased the expression of angiogenic genes (Hif1a and Vegfa) with a concomitant decrease in the expression of genes involved in oxidative metabolism (Ppargc1a and Acox1) in the perigonadal fat pad, whereas G-1 generally normalized these altered gene expression patterns (Fig. 4C). We also analyzed the BAT gene expression of uncoupling protein (Ucp1), which is implicated in conferring the thermogenic ability of BAT (42). OVX substantially reduced Ucp1 expression, with G-1 treatment restoring its expression (Fig. 4D). BAT thermogenesis is also regulated by the central nervous system through innervation in BAT. To test whether G-1 might be acting on BAT through indirect mechanisms, we quantified the gene expression of tyrosine hydroxylase (Th), the rate-limiting enzyme in norepinephrine synthesis and thus a marker for sympathetic innervation. Th expression was higher in the BAT from OVX mice treated with G-1 compared to either ovary-intact mice or vehicle-treated OVX mice (Fig. 4D). Together, these results suggest that activation of GPER to increase thermogenesis in BAT, which increases energy expenditure and ultimately enhances WAT catabolism, decreasing body weight, is a central mechanism to our observations.
Upregulation of mitochondrial gene expression and increased cellular respiration with G-1 treatment
Because we observed an increase in whole-body energy expenditure in mice after G-1 treatment, we examined mitochondrial gene expression in metabolically important tissues that utilize or dissipate energy, such as BAT and skeletal muscle. Our results demonstrate an increase in the expression of mitochondrial genes including Ppargc1a and its downstream targets acetyl co-A carboxylase (Acaca), nuclear respiratory factor (Nrf1) and transcriptional factor A mitochondrial (Tfam) in BAT upon G-1 treatment of OVX mice (Fig. 5A). These mitochondrial genes regulate oxidative metabolism and maintain glucose and lipid homeostasis and energy balance. Similarly, gene expression of Acaca, Nrf1, Tfam and Acox1 was also upregulated in the skeletal muscle of G-1-treated mice (Fig. 5B). Upregulation of these mitochondrial genes in BAT and skeletal muscle suggests increased fuel utilization, in particular through β-oxidation.
Fig. 5. G-1 treatment increases mitochondrial gene expression and cellular respiration.

Expression of the mitochondrial genes Ppargc1a, Acaca, Nrf1, Tfam and Acox1 in (A) BAT and (B) skeletal muscle following vehicle or G-1 treatment of OVX mice (n=5–6). (C) Oxygen consumption rate (OCR) of brown preadipocytes under basal conditions (0-16 min) following GPER stimulation for 24 h with 100 nM G-1. * P< 0.001 for G-1-treated cells vs. vehicle control. (D) Basal OCR, maximal OCR, spare respiratory capacity and OCR for ATP production in G-1-treated cells vs. control cells. The results shown in (C) and (D) are representative of three independent experiments with 4 replicates for each condition per experiment as indicated. (A and B) one-way ANOVA with Bonferroni post-hoc test, (C) two-way ANOVA, (D) Mann-Whitney U test.
To test further whether G-1 leads to increased cellular metabolism, we quantified respiration in brown preadipocytes in vitro. Stimulation of GPER with G-1 for 24 h resulted in a higher basal oxygen consumption rate (OCR) and increased maximal cellular respiration in response to the mitochondrial uncoupling agent carbonyl cyanide-4-(trifluoromethoxy)phenylhydrazone (FCCP) (Fig. 5C). Oxygen consumption in response to oligomycin, which inhibits ATP synthesis, and rotenone/antimycin A, which block all electron transport, was similar in both the groups. Based on these results, basal and maximal respiration, spare respiratory capacity and respiration towards ATP production were all increased upon treatment with G-1 (Fig. 5D), revealing that GPER stimulation enhanced mitochondrial function in brown preadipocytes in vitro, consistent with the observed increases in BAT gene expression and increased energy expenditure observed in vivo. Together, these results suggest that activation of GPER enhances adipose tissue metabolism and energy expenditure, which together lead to weight loss.
GPER agonism alleviates inflammation in OVX mice
Increased body weight and dyslipidemia lead to systemic inflammation and dysregulation of metabolic homeostasis. Because OVX mice exhibited increased obesity and higher circulating lipids, we next assessed the systemic concentrations of inflammatory cytokines (TNFα, MCP1 and IL6) in plasma as well as gene expression of multiple markers of inflammation (Tnf: TNFα; Ccl2: MCP1; and Adgre1: F4/80) in perigonadal adipose tissue, liver, and skeletal muscle. Our results revealed that OVX led to increased circulating TNFα, MCP1 and IL6, which were reduced upon G-1 treatment (Fig. 6A). Furthermore, the OVX-induced increase in mRNA expression of inflammatory markers was diminished by G-1 to varying extents in perigonadal adipose (Fig. 6B), liver (Fig. 6C), and skeletal muscle (Fig. 6D). These results reveal that G-1 reverses the inflammatory pathophysiological phenotype in OVX mice, likely contributing to the normalization of metabolic dysfunction in multiple tissues.
Fig. 6. GPER agonism attenuates inflammation resulting from OVX.
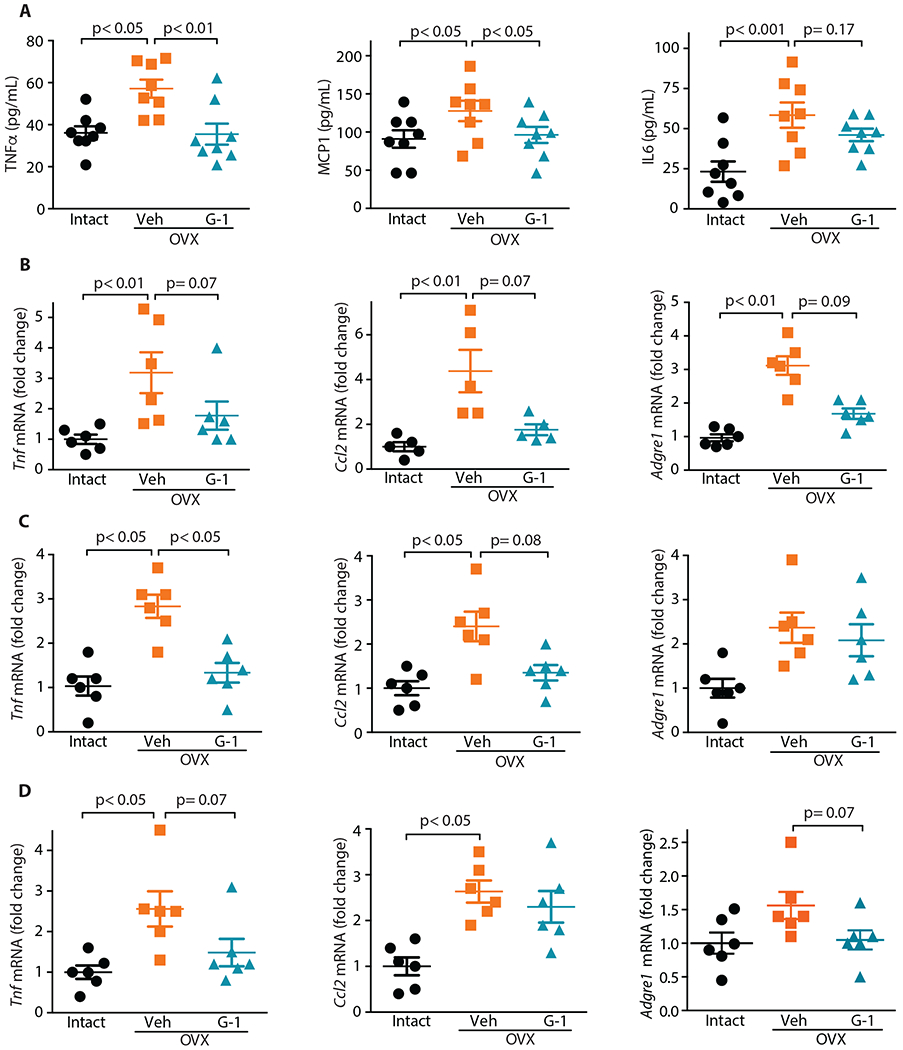
(A) Systemic concentrations of inflammatory cytokines (n=8). Gene expression of inflammatory markers in (B) perigonadal WAT, (C) liver and (D) skeletal muscle (n=5-6). All tests one-way ANOVA with Bonferroni post-hoc test.
GPER activation in OVX mice improves glucose homeostasis and metabolic hormone profiles
Increased obesity resulting from OVX leads to metabolic dysfunction due to multiple factors including ectopic lipid accumulation and inflammation, which in turn lead to insulin resistance and reduced glucose tolerance. Because treatment of OVX mice with G-1 reduced obesity, we sought to determine whether G-1 treatment also improves glucose homeostasis. To this end, we performed glucose tolerance tests (GTTs, to assess glucose clearance from blood) and quantified fasting glucose and insulin as measures of glucose homeostasis in vivo. Compared to ovary-intact control mice, OVX led to delayed glucose clearance in the vehicle-treated mice (Fig. 7A and B), similar to the baseline values prior to treatment (fig. S1). With G-1 treatment, OVX mice exhibited a marked improvement in glucose clearance (Fig. 7A and B). In addition, whereas OVX also increased fasting blood glucose and insulin concentrations, resulting in an elevated homeostatic model assessment of insulin resistance (HOMA-IR) index, G-1 treatment led to a decrease in fasting glucose and insulin concentrations (Fig. 7 C–D) with a concomitant decrease in the HOMA-IR index (Fig. 7E).
Fig. 7. GPER-selective agonist G-1 improves glucose homeostasis in OVX mice and modulates systemic concentrations of metabolic hormones.

(A, B) Tolerance to glucose (glucose tolerance test, GTT), fasting plasma (C) glucose and (D) insulin, and (E) HOMA-IR in vehicle- and G-1-treated OVX mice compared to ovary-intact mice. For GTT, area under the curve for each individual mouse in A was plotted in B. (F) Concentrations of plasma leptin, insulin, pancreatic polypeptide (PP), C-peptide 2, and glucagon in the fed state. A-E, n=6; F, n=6-8. All tests one-way ANOVA with Bonferroni post-hoc test.
Body weight and metabolic regulation are driven by a complex interplay between multiple hormones that participate in key metabolic functions, including satiety and satiation, insulin sensitivity, and glucose and lipid homeostasis (43, 44). OVX led to increased plasma resistin, leptin, insulin, PP, C-peptide 2, and glucagon as hallmarks of obesity and metabolic dysfunction, with G-1 treatment decreasing all except glucagon (Fig. 7F). Neither OVX nor G-1 had effects on ghrelin, PYY, GIP, amylin, or GLP-1 (fig. S2). These results demonstrate that G-1 has the capacity to regulate multiple aspects of metabolism by modulating glucose homeostasis and several metabolic hormones.
G-1 reduces weight gain and improves glucose homeostasis in DIO mice
To determine whether G-1 might also be effective in DIO models, we first fed male mice a HFD for 12 weeks to induce obesity (Fig. 8A), glucose intolerance, and insulin resistance (fig. S3) and subsequently treated mice for 8 weeks with G-1. Notably, compared to G-1-treated OVX female mice that lost weight over time (Fig. 1A), G-1 treatment in male mice prevented further weight gain, with control (vehicle-treated) male mice continuing to gain weight over the course of treatment (Fig. 8A). At the end of the 8-week treatment period, compared to vehicle-treated mice, G-1-treated male mice exhibited reduced plasma cholesterol (Fig. 8B) and increased energy expenditure (Fig. 8C) to levels similar to those observed in male mice fed NC. Unexpectedly, although G-1-treated male mice did not exhibit any overall weight loss over the 8-week treatment period, fasting glucose (Fig. 8D) and insulin (Fig. 8E), HOMA-IR (Fig. 8F), and glucose tolerance (Fig. 8G and H) were all markedly improved. Thus, whereas improved glucose homeostasis in G-1-treated OVX female mice correlated with weight loss, in obese male mice, the improved glucose homeostasis occurred in the absence of overall weight loss. Since diet often contributes to obesity and diabetes in post-menopausal women, we further extended our observations with OVX female mice by adding a HFD to determine whether G-1 could alleviate the combined deleterious effects of estrogen deprivation and HFD. Under these conditions, G-1 treatment significantly decreased body weight and improved glucose homeostasis in OVX/HFD mice (fig. S4). Thus, our studies provide strong evidence that G-1 exerts anti-obesity and anti-diabetic effects across multiple preclinical models of obesity and diabetes in both males and females.
Fig. 8. Activation of GPER by G-1 exerts anti-obesity and anti-diabetic effects in male DIO mice.

(A) Body weights (n=14), (B) plasma cholesterol concentrations (n=6), (C) energy expenditure (n=4), fasting (D) glucose (n=6) and (E) insulin (n=6) concentrations, (F) HOMA-IR (n=6) and (G, H) glucose tolerance (n=8) in DIO male mice treated with vehicle or G-1 compared in male mice fed normal chow (NC). For (D) and (H), area under the curve was determined for each individual mouse in (C) and (G), respectively. All tests one-way ANOVA with Bonferroni post-hoc test.
DISCUSSION
In the present study, we employed various models of obesity and diabetes to determine the impact of selective GPER agonism on multiple aspects of metabolism, including body weight regulation and obesity, bone, glucose and lipid homeostasis, and hormone/cytokine regulation. We and others have shown that GPER deficiency results in phenotypic abnormalities similar to those observed in mice lacking ERα with regard to metabolism, including obesity, dyslipidemia, insulin resistance, glucose intolerance, and inflammation (19, 25, 26, 35, 45–47). These observations suggest a potential overlap or synergy in the metabolic functions carried out by both receptors. Our central objective was to determine whether selective GPER activation would effectively treat obesity and its associated pathologies in E2-deficient female mice as well as in DIO in male and E2-deficient female mice. Our results establish an unrecognized role for the GPER agonist G-1 (a first-in-class prototype drug candidate) in counteracting obesity and metabolic dysfunction resulting from E2 deficiency and DIO both alone and in combination.
Under our experimental conditions, G-1 reduced body weight in OVX mice due to fat loss as opposed to changes in lean mass. Consistent with a critical role of E2 acting on GPER in the regulation of body weight and obesity, OVX GPER KO mice, unlike their OVX WT counterparts, showed no reductions in body weight upon E2 treatment (26). However, the male mice in our DIO experimental paradigm differed from E2-deficient female mice in their response to G-1, lacking further weight gain (which continued in the control male cohort), but with no weight loss as observed in our OVX NC female model. These findings are similar to and consistent with a report in which male mice fed a HFD and treated with E2 ceased gaining weight over time relative to the control diet, whereas the control DIO mice continued to gain weight (48).
GPER deficiency leads to increased circulating lipids (25), consistent with our current findings that G-1-mediated activation of GPER lowers total plasma cholesterol. Similar to GPER deficiency in mice, individuals in a cohort of Northern European descent carrying a hypofunctional P16L genetic variant of GPER display increased plasma low-density lipoprotein (LDL) cholesterol (49), suggesting potential translational relevance for patients. Our observations that selective GPER agonism not only reverses obesity, but also improves plasma lipid profiles demonstrates a potentially important additional therapeutic benefit of G-1 administration.
Maintenance of stable body weight depends on the balance between energy intake and expenditure. Possible mechanisms promoting energy expenditure include a higher metabolic rate and increased respiratory uncoupling (50). In this study, GPER activation by G-1 specifically reversed the decrease in energy expenditure due to either OVX or HFD. This result is consistent with findings where GPER deficiency resulted in reduced energy expenditure in both male and female mice (26). Our investigation of a molecular basis of the increased energy expenditure in an OVX mouse model revealed that expression of Ucp1, and to a lesser extent Ppargc1a (which upregulates Ucp1 expression) was increased in BAT from G-1-treated female mice. Further, our observation of increased Th expression with G-1 treatment suggests that G-1 may also exert centrally mediated thermogenic effects in BAT via activation of the sympathetic nervous system (51). Consistent with our observations, BAT from GPER-deficient mice exhibited decreased expression of two thermogenic genes, Ucp1 and Adrb3 (β3-adrenergic receptor) (26). These collective observations reveal that GPER is a relevant mediator of energy balance in vivo.
Adipose tissue is a central regulator of energy balance and metabolic homeostasis, with the loss of E2 leading to visceral adipose tissue accumulation and dysregulation (52, 53). Our results show that G-1 reduced the size of individual adipocytes from WAT, which is known to correlate with increased insulin sensitivity (54). Increased adipocyte size can lead to a hypoxic environment, inflammation, and mitochondrial dysfunction (39). Thus, reduced adipocyte size may diminish hypoxia and inflammation. Indeed, our results support this hypothesis, as G-1 reduced WAT expression of hypoxia-responsive genes, suggesting that GPER stimulation mitigates hypoxia in WAT. Hypoxia is strongly correlated with increases in circulating leptin and resistin concentrations, along with reduced expression of PGC1α (41). Our results establish that G-1 exerts effects similar to those of E2, upregulating genes involved in mitochondrial biogenesis to promote fat oxidation in WAT and counteract obesity (55). We also observed a reduction in circulating concentrations of leptin and resistin upon G-1 treatment, which may contribute to the overall increase in energy expenditure (56, 57) and improved glucose homeostasis (58). These data are in agreement with reports in which postmenopausal women treated with E2 had lower serum leptin (59). Adipose tissue in post-menopausal women exhibits reduced fatty acid oxidation, which may contribute to changes in total and regional body fat (60), whereas supplementation of E2 in OVX mice fed a HFD increases lipid oxidation and lipid utilization, thereby reducing obesity (61). Together, these results suggest that GPER activation by G-1 leads to reprogramming of WAT, enhancing fatty acid oxidation and alleviating hypoxia.
Estrogen deprivation results in mitochondrial dysfunction and altered lipid substrate use, with E2 supplementation reversing this effect (62). In the current study, G-1 treatment upregulated the expression of mRNA for multiple mitochondrial and fatty acid oxidation proteins (Ppargc1a, Acaca, Nrf1, Tfam, Acox1). In addition to WAT, other metabolically active tissues, such as BAT and skeletal muscle, also exhibited increased expression of these genes, which may further contribute to the increased energy expenditure and consumption of fuels. Furthermore, in vitro assays revealed that G-1 treatment enhanced both basal mitochondrial function as well as spare respiratory capacity, which reflects the vitality and survival capacity of cells (63). We did not observe an increase in proton leak in vitro as might be predicted from the increased expression of Ucp1 in vivo, suggesting that the changes in Ucp1 expression either require prolonged G-1 exposure or are not cell-autonomous. As G-1 also improves exercise capacity in OVX mice through the upregulation of heat-shock proteins (64), G-1 preserves the function of metabolically critical tissues.
Rodents and primates, including humans, with increased body weight exhibit low-grade chronic inflammation in their WAT and other tissues due in part to ectopic fat deposition (65). Epidemiological data suggest that E2 has a protective role against chronic inflammatory diseases (66) as post-menopausal women exhibit increases in pro-inflammatory cytokines, an effect mimicked in mice upon OVX (67). In the current study, G-1 treatment led to reduced plasma concentrations and expression of circulating and tissue inflammatory cytokines, consistent with previous studies in which loss of GPER results in increased systemic pro-inflammatory cytokines TNFα, MCP1, IL6, IL1β and SAA3 (25, 26). A role for E2 and specifically GPER in the regulation of pro-inflammatory cytokines in adipocytes is suggested by studies employing differentiated 3T3-L1 cells, where E2 treatment reduced pro-inflammatory gene expression, even following ERα knockdown, indicating an alternative pathway for E2 action, presumably via GPER (68). Direct evidence for the anti-inflammatory actions of G-1 comes from studies of experimental autoimmune encephalomyelitis as a model of multiple sclerosis, in which G-1 reduced the severity of disease through reductions in pro-inflammatory activity (69). In other studies, G-1 promoted a regulatory T cell phenotype in pro-inflammatory Th17 cells through the induction of Foxp3 and IL-10 (70, 71). Thus, our results clearly show that GPER activation by G-1 contributes to the maintenance of an anti-inflammatory phenotype in vivo, which likely contributes to an improved metabolic phenotype.
Weight gain and obesity largely drive the increased prevalence of metabolic syndrome in postmenopausal women (and OVX mice) as well as in men. In mice and primates, including humans, the effects of hormone replacement therapy following menopause or E2 deficiency, leading to reduced visceral obesity and lower fasting serum glucose and insulin, clearly indicate a protective role for E2 (11). Our results indicate that activation of GPER in OVX mice improves glucose tolerance with lower fasting glucose and insulin, and consequently a lower HOMA-IR, suggesting an improvement in peripheral insulin action to maintain glucose homeostasis. Furthermore, in our current study, male mice treated with G-1 also exhibited improved glucose tolerance with reduced insulin resistance in the absence of any weight loss. This result suggests a direct role for G-1 in modulating glucose homeostasis, consistent with previous reports, where both female and male mice fed a HFD displayed marked improvements in glucose homeostasis following E2 treatment (48, 72). GPER may improve glucose homeostasis in OVX mice through both direct effects on insulin producing pancreatic β cells or via actions on peripheral or central tissues (73). Based on our current results and published reports on the effects of GPER deficiency (25, 26, 33), we propose that the anti-obesity and anti-diabetic effects of G-1 in vivo involve both direct and indirect effects on multiple metabolic tissues such as WAT, BAT, skeletal muscle, pancreas, and liver to reduce obesity and improve glucose homeostasis.
Despite its extensive effects on metabolism, E2 is most widely appreciated as a potent regulator of reproductive tissues and bone health. E2 supplementation in OVX mice or following menopause in clinical studies restores bone health by maintaining, or reversing decreases in, bone mineral content and density (74, 75). However, unlike the established effects of E2 (37), in the current study G-1 treatment did not yield any changes in bone mineral content or density. Furthermore, whereas E2 treatment of OVX mice leads to a rapid uterine imbibition response (the classic measure of “estrogenicity”), G-1 supplementation had no effect on uterine wet weight, as we have previously shown in both acute and chronic treatments (28, 76). Our results demonstrate that, although it restores normal body weight and metabolic function in E2-deficient mice, G-1 lacks the feminizing effects and bone mineral-preserving capacity of E2.
Limitations of this study include the use of mice to model human obesity and diabetes. In addition, given the complexity and inter-relatedness of body weight regulation and glucose homeostasis involving multiple organ systems (including pancreas, liver, adipose and muscle), ascertaining the primary direct vs. secondary indirect effects of G-1, particularly in the OVX models where weight loss occurred in conjunction with improvements in glucose homeostasis, is challenging. Finally, the efficacy and consequences (for example, potential toxicity) of long-term G-1 treatment, as would be required in humans to ameliorate obesity or diabetes, is currently unknown and requires further pre-clinical and clinical studies.
In summary, this is the first study to demonstrate the beneficial metabolic effects of a GPER-selective agonist in vivo in both female and male mice. We show that G-1 exerts potent anti-obesity and anti-diabetic effects specifically through the stimulation of energy expenditure in the absence of effects on food intake or locomotor activity. Our results could lead to therapeutic approaches against obesity as well as its associated metabolic consequences such as diabetes, not only in postmenopausal women but also in men. We conclude that G-1 is a bona fide first-in-class candidate prototype drug for potential translation into clinical applications. Future translational studies in men and women will ultimately establish the value of G-1 in obese and diabetic patients.
MATERIALS AND METHODS
Study Design
The objective of this study was to determine the therapeutic potential of the GPER-selective agonist G-1 in preclinial mouse models of obesity and diabetes, including ovariectomy and high fat diet. Appropriate surgery, diet, and drug controls were included in the study. To reveal the mechanisms of G-1-mediated effects on metabolism, studies were performed on tissues or plasma obtained from various mouse cohorts. Power analyses were not used to calculate sample sizes; samples were not excluded, and investigators were not blinded during experiments. Prior to treatment, mice were weighed and assigned to treatment groups to ensure similar average initial body weights. Approximately 12-14 mice were included in each treatment group and body weights were monitored weekly throughout the treatment period. Mice were randomly selected for assessment of glucose homeostasis, body composition analysis and metabolic parameters. At the end of the treatment period, in each treatment group, 6 of the mice were fasted prior to sacrifice with the remaining mice euthanized in a fed state. Plasma obtained from fasted mice was used for quantification of lipids, glucose and insulin, whereas metabolic hormones and cytokines were assessed in plasma obtained from fed mice. Histology and gene expression studies were performed in tissues obtained from fed mice. Typically, 4-8 mice (or derived samples such as plasma and tissue mRNA) were evaluated per condition. For in vitro metabolic studies, three independent experiments (with four replicates each) were performed and representative results from one experiment are shown.
Animals, drug treatment, and tissue collection
C57BL/6 mice were obtained from Harlan Laboratories and GPER-deficient mice were a gift from Dr. Jan S. Rosenbaum (Proctor & Gamble) and subsequently backcrossed for 10 generations onto C57BL/6 mice. Animals were housed at the Animal Resource Facility at the University of New Mexico Health Sciences Center. Animals were maintained under a controlled temperature of 22–23°C with a 12-hour light, 12-hour dark cycle and fed a soy protein-free chow (defined as normal chow [NC]; 2920X, Envigo Corp.) ad libitum. All procedures were carried out in accordance with the National Institutes of Health (NIH) Guide for the Humane Care and Use of Laboratory Animals and approved by the University of New Mexico Institutional Animal Care and Use Committee (IACUC) as described (25). Female C57Bl/6 mice were OVX at 10 weeks of age. Twelve weeks after OVX, animals were given sc injections of either vehicle [0.1% bovine serum albumin (BSA) and 0.01% Tween 20 in 0.9% NaCl] or G-1 (200 μg) 3 days per week (Mon-Wed-Fri) for 6 weeks. G-1, synthesized as described (77), was recrystallized from ethanol to obtain a diastereomerically pure, racemic mixture of syn-enantiomers. The identity of individual compound batches was verified by comparison of Nuclear Magnetic Resonance (NMR) spectroscopy spectra to published values of 1H NMR (400 MHz) δ and 13C NMR (125 MHz) δ (77). Compound purity was demonstrated by high field 1H NMR and quantitative analytical HPLC chromatography to be >99%. For injections, a G-1 stock was prepared in ethanol and subsequently diluted into vehicle. For each treated animal, 200 μg G-1 in 10 μL ethanol (or ethanol alone as control) was diluted 10-fold in vehicle to a final volume of 100 μL. For the male DIO model, 6-week-old mice were switched to a HFD (TD.09766, Envigo Corp.) for 12 weeks prior to beginning treatment. Male mice received either vehicle or G-1 sc as above, 5 days per week (Mon-Fri) for 8 weeks based on dose-finding experiments (figs S5 and S6). A cohort of male mice fed NC served as an additional control. We further combined the effects of ovariectomy and a HFD in a female model of post-menopausal DIO, in which mice were ovariectomized and switched to HFD at approximately 6 weeks of age, with ovary-intact mice as controls. After 12 weeks on the HFD, mice received either vehicle or G-1 sc as above, 5 days per week (Mon-Fri) for 8 weeks. At the end of treatment period, animals were euthanized, blood and tissues were collected, and perigonadal and perirenal fat depots were carefully dissected and weighed. Perigonadal white adipose tissue (WAT), suprascapular brown adipose tissue (BAT), skeletal muscle (gastrocnemius), and liver were collected and frozen for further analysis.
Body weight, food intake, locomotor activity, and energy expenditure
Following the initiation of G-1 treatments, mice were weighed every week. For determination of food intake and energy expenditure, mice were placed in metabolic cages and allowed to adjust for 24 hours before obtaining data. All measurements were obtained by using a computer-controlled indirect calorimetry system (Promethion, Sable Systems). Food consumption, oxygen consumption (VO2) and carbon dioxide production (VCO2) were measured. Respiratory exchange ratio (RER) was derived as the ratio of VCO2 to VO2, indicating the primary fuel source used, whereas oxygen (O2) consumption served as a measure of energy expenditure. Home cage locomotor activity was measured in mice to assess activity in a non-aversive environment. Horizontal activity was automatically measured and recorded by photocell beam breaks using the PAS-Homecage system (San Diego Instruments). Prior to data collection, mice were acclimatized in the chambers for 24 hours, after which data were collected for a subsequent 48 hours, including two complete light cycles (14 h) and two complete dark cycles (10 h). The animals had ad libitum access to the respective rodent chow and water during the study.
Body composition analysis
Changes in body composition were determined by performing DEXA and MRI scans on live animals from all mouse cohorts 2-4 days prior to euthanizing mice. DEXA scans were performed to determine bone mineral density, bone mineral content, body fat content, body fat percentage and lean mass using a dedicated densitometer (Lunar PIXImus II, Lunar Corporation, GE Medical Systems). This system employs a cone beam X-ray source generating energies of 35 and 80 keV and a flat 100 × 80 mm detector with individual pixel dimensions of 0.18 × 0.18 mm. A quality-control procedure was routinely performed with a calibration phantom before imaging. MRI images were obtained on a Biospec 4.7T (Bruker Corporation) with the following parameters: field of view, 4 x 4 cm; echo time, 13 milliseconds; repetition time, 5,000 milliseconds; matrix, 256 x 256, as described (25). Images were analyzed for separation of fat/water content by the two-point Dixon method. Six coronal or axial sections per mouse from a similar body region were analyzed for total and sc fat content, respectively, using ImageJ software (https://imagej.nih.gov/nih-image).
Glucose and insulin tolerance tests
To assess the effect of GPER activation on metabolism, glucose tolerance tests (GTT) insulin tolerance tests (ITT) were performed as specified. Mice were fasted for 4 hours and basal blood glucose (considered baseline) was measured. Subsequently, mice received glucose (2 g/kg body weight) or insulin (0.5 U/Kg body weight) intraperitoneally (IP). Following injection, blood glucose was monitored at regular time intervals (15, 30, 60, and 120 min post administration) from tail nicks using the ReliOn Confirm glucose monitoring system (Relion Corp). Blood glucose was plotted as a function of time and differences between treatment groups were assessed by the corresponding area under the curve (AUC).
Measurement of fasting plasma glucose, insulin, and lipids
Fasting glucose, insulin, cholesterol, and triglycerides were measured as described (25). Briefly, mice were fasted for 10-12 hours prior to euthanasia and blood was collected by transthoracic cardiac puncture. Subsequently, glucose, insulin, triglycerides, and cholesterol (low-density lipoprotein [LDL] and high-density lipoprotein [HDL]) were measured in the plasma. Glucose was measured as above and insulin was measured using a mouse insulin ELISA kit (Mercodia AB). The extent of insulin resistance was quantified by the homeostatic model assessment (HOMA-IR) using the matched fasting glucose and insulin concentrations. Total cholesterol and triglyceride concentrations were determined at IDEXX BioResearch.
Hematoxylin and eosin staining
Following killing, adipose tissue was rapidly fixed in phosphate-buffered saline (PBS) containing 4% paraformaldehyde for 24 hours and subsequently washed with PBS and paraffin-embedded. Tissue sections (10 μm thick) were stained with hematoxylin and eosin (H&E). Images were quantified with ImageJ to derive relative adipocyte area in adipose sections.
Real-time quantitative PCR analysis
Total RNA was extracted from frozen perigonadal (white) adipose tissue, brown adipose tissue, liver and skeletal muscle (~30-50 mg) using the RNeasy Mini Kit (Qiagen Co.). Isolated RNA (~100 ng) was used for cDNA synthesis using the ImProm-II Reverse Transcription System (Promega) in a final reaction volume of 20 μL. Subsequently, quantitative real time PCR was carried out in a 7500 Fast Real-Time PCR System (Applied Biosystems). Reactions for qPCR were set up in a total volume of 15 μL containing 7.5 μL Fast SYBR green Master Mix (Applied Sciences), 3.5 μL water, 1 μL forward and reverse primer (table S1) each (50 μM stock), and 2 μL cDNA for 40 cycles. Gene expression was normalized to 18S RNA as an internal reference and fold change over the control was calculated using the ΔΔCt method. Quantitative real-time PCR reactions were performed in duplicate from a minimum of 5 individual mice.
Measurement of cellular respiration
Cellular respiration was measured as oxygen consumed in brown preadipocytes (78) using the XFe-24 analyzer (Agilent Technologies) according to manufacturer’s protocols. Cells were maintained in DMEM supplemented with 25 mM glucose, 2 mM glutamine, 10% fetal bovine serum, 100 U/ml penicillin, and 100 μg/ml streptomycin in a humidified chamber at 37 oC with 95% O2 and 5% CO2. Cells (50,000) were seeded in a 24-well plate and after 24 h, cells were starved in phenol-red free DMEM/F-12 medium supplemented with 5% charcoal-stripped serum. The following day, cells were treated with either vehicle or 100 nM G-1 for 24 h. On the day of analysis, the culture medium was removed and cells were washed twice and switched to 500 μL XF assay medium supplemented with 1 mM pyruvate, 2 mM glutamine and 10 mM glucose (pH adjusted to 7.4) at 37 oC in a CO2-free incubator for 45 min before being transferred to the XFe analyzer for analysis of cellular respiration using the Mitochondrial Stress Test, in which cells are successively treated with the following modulators of mitochondrial function: oligomycin, FCCP, and rotenone/antimycin A. Cells were then fixed in PBS containing 2% PFA and quantified by crystal violet staining for normalization to cell numbers.
Measurement of mouse metabolic hormones and cytokines
Nonfasted mice were euthanized, and plasma samples collected. A mouse metabolic hormone magnetic bead panel (Millipore Corporation) was used to quantitate plasma amylin (active), C-peptide 2, ghrelin (active), gastric inhibitory polypeptide (GIP, total), glucagon-like peptide 1 (GLP-1, active), glucagon, interleukin 6 (IL6), insulin, leptin, monocyte chemotactic protein 1 (MCP1), pancreatic polypeptide (PP), peptide YY (PYY, total), resistin, and tumor necrosis factor α (TNFα) according to the manufacturer’s instructions.
Statistical analysis
For each experiment, data were typically pooled from 4-8 mice as indicated. Significance was determined by one-way ANOVA or two-way ANOVA with appropriate post-hoc analyses using GraphPad Prism version 5.00 for Windows (GraphPad Software). For time-dependent body weight and cellular respiration studies, two-way ANOVA was used to compare between different mouse cohorts over time or treatment groups. For energy expenditure, locomotor activity, GTT and ITT analyses, AUC was first calculated for each individual mouse, and different mouse cohorts were then compared by one-way ANOVA. Cellular respiration parameters were compared using the Mann-Whitney U test. P values <0.05 were considered statistically significant. Where P values are not provided in figures, statistically significant differences were not present.
Supplementary Material
Fig. S1. Baseline glucose homeostasis in female mice after ovariectomy.
Fig. S2. Plasma concentrations of ghrelin, PYY, GIP, amylin, and GLP-1 in ovariectomized female mice after G-1 treatment.
Fig. S3. Baseline glucose homeostasis in diet-induced obese male mice.
Fig. S4. Body weights and glucose tolerance in ovariectomized female mice on high-fat diet after treatment with G-1.
Fig. S5. Effects of different doses of G-1 on body weight in male mice with diet-induced obesity.
Fig. S6. Effects of G-1 dosing regimen on glucose tolerance in male mice with diet-induced obesity.
Table S1. Primers used for qPCR.
Acknowledgments:
We thank Laura Laidler, Dandan Wu, Tamara Howard, and Drs. John Weaver, Yan Luo, Xing Zhang and Andrey Dobroff for technical assistance.
Funding: This work was supported by research grants from the National Institutes of Health (NIH R01 CA127731, CA163890, and CA194496 to E.R.P.), Dialysis Clinic, Inc. (to E.R.P.) and by the UNM Comprehensive Cancer Center (P30 CA118100), which provided developmental and pilot funds and support for the Flow Cytometry Shared Resource. M.L. is supported by NIH R01 DK110439. F.M.J. is supported by NIH R01 DK074970 and DK107444 and by a Department of Veterans Affairs Merit Review Award (#BX003725). W.A. and R.P. received funding from the Gillson-Longenbaugh Foundation. Metabolic studies were supported by the Autophagy, Inflammation and Metabolism (AIM) Center of Biomedical Research Excellence (CoBRE) supported by NIH P20 GM121176. MRI images were generated at the UNM Brain Imaging Center, supported by NIH P30 GM0103400.
Footnotes
Overline: METABOLIC DISEASE
Competing interests: E.R.P. is an inventor on U.S. Patent No. 10,251,870 and G.S. and E.R.P. are inventors on U.S. patent No. 10,471,047, both for the therapeutic use of compounds targeting GPER (“Method for treating obesity, diabetes, cardiovascular and kidney diseases by regulating GPR30/GPER”). E.R.P. and J.B.A. are inventors on U.S. Patent Nos. 7,875,721 and 8,487,100 for GPER-selective ligands and imaging agents (“Compounds for binding to ERα/β and GPR30, methods of treating disease states and conditions mediated through these receptors and identification thereof”). R.P. and W.A are inventors on issued patents related to adipotide (U.S. Patent Nos. 7,452,964, 7,951,362, 8,252,764 and 8,846,859 entitled “Compositions and methods of use of targeting peptides against placenta and adipose tissues”, and U.S. patent No. 8,067,377 entitled “Peptide compositions for targeting adipose tissue”) and are founders of PhageNova Bio, which has optioned intellectual property related to adipotide, an investigational anti-obesity agent. R.P. is the Chief Scientific Officer and a paid consultant for PhageNova Bio. G.S., E.R.P., J.B.A., R.P. and W.A. are entitled to royalties if licensing or commercialization occurs. These arrangements are managed in accordance with established institutional conflict of interest policies. Other authors declare no conflicts of interest.
Data and materials availability:
All data associated with this study are present in the paper or Supplementary Materials.
References
- 1.Bojanowska E, Ciosek J, Can we selectively reduce appetite for energy-dense foods? An overview of pharmacological strategies for modification of food preference behavior, Curr Neuropharmacol 14, 118–142 (2016). [DOI] [PMC free article] [PubMed] [Google Scholar]
- 2.Chevalier N, Fenichel P, Bisphenol A: Targeting metabolic tissues, Rev Endocr Metab Disord 16, 299–309 (2015). [DOI] [PubMed] [Google Scholar]
- 3.Flegal KM, Kruszon-Moran D, Carroll MD, Fryar CD, Ogden CL, Trends in obesity among adults in the United States, 2005 to 2014, JAMA 315, 2284–2291 (2016). [DOI] [PMC free article] [PubMed] [Google Scholar]
- 4.Saunders KH, Umashanker D, Igel LI, Kumar RB, Aronne LJ, Obesity pharmacotherapy, Med Clin North Am 102, 135–148 (2018). [DOI] [PubMed] [Google Scholar]
- 5.Kolonin MG, Saha PK, Chan L, Pasqualini R, Arap W, Reversal of obesity by targeted ablation of adipose tissue, Nat Med 10, 625–632 (2004). [DOI] [PubMed] [Google Scholar]
- 6.Barnhart KF, Christianson DR, Hanley PW, Driessen WH, Bernacky BJ, Baze WB, Wen S, Tian M, Ma J, Kolonin MG, Saha PK, Do KA, Hulvat JF, Gelovani JG, Chan L, Arap W, Pasqualini R, A peptidomimetic targeting white fat causes weight loss and improved insulin resistance in obese monkeys, Sci Transl Med 3, 108ra112 (2011). [DOI] [PMC free article] [PubMed] [Google Scholar]
- 7.Pratley R, Amod A, Hoff ST, Kadowaki T, Lingvay I, Nauck M, Pedersen KB, Saugstrup T, Meier JJ, investigators P, Oral semaglutide versus subcutaneous liraglutide and placebo in type 2 diabetes (PIONEER 4): a randomised, double-blind, phase 3a trial, Lancet, (2019). [DOI] [PubMed] [Google Scholar]
- 8.Christou GA, Katsiki N, Blundell J, Fruhbeck G, Kiortsis DN, Semaglutide as a promising antiobesity drug, Obes Rev 20, 805–815 (2019). [DOI] [PubMed] [Google Scholar]
- 9.Rosenbaum M, Leibel RL, Adaptive thermogenesis in humans, Int J Obes (Lond) 34 Suppl 1, S47–55 (2010). [DOI] [PMC free article] [PubMed] [Google Scholar]
- 10.Srivastava G, Apovian C, Future pharmacotherapy for obesity: New anti-obesity drugs on the horizon, Curr Obes Rep 7, 147–161 (2018). [DOI] [PubMed] [Google Scholar]
- 11.Meyer MR, Clegg DJ, Prossnitz ER, Barton M, Obesity, insulin resistance and diabetes: sex differences and role of oestrogen receptors, Acta Physiol (Oxf) 203, 259–269 (2011). [DOI] [PMC free article] [PubMed] [Google Scholar]
- 12.Deroo BJ, Korach KS, Estrogen receptors and human disease, J Clin Invest 116, 561–570 (2006). [DOI] [PMC free article] [PubMed] [Google Scholar]
- 13.Prossnitz ER, Barton M, Estrogen biology: New insights into GPER function and clinical opportunities, Mol Cell Endocrinol 389, 71–83 (2014). [DOI] [PMC free article] [PubMed] [Google Scholar]
- 14.Mauvais-Jarvis F, Sex differences in metabolic homeostasis, diabetes, and obesity, Biol Sex Differ 6, 14 (2015). [DOI] [PMC free article] [PubMed] [Google Scholar]
- 15.Barros RP, Gustafsson JA, Estrogen receptors and the metabolic network, Cell Metab 14, 289–299 (2011). [DOI] [PubMed] [Google Scholar]
- 16.Revankar CM, Cimino DF, Sklar LA, Arterburn JB, Prossnitz ER, A transmembrane intracellular estrogen receptor mediates rapid cell signaling, Science 307, 1625–1630 (2005). [DOI] [PubMed] [Google Scholar]
- 17.Zekas E, Prossnitz ER, Estrogen-mediated inactivation of FOXO3a by the G protein-coupled estrogen receptor GPER, BMC Cancer 15, 702 (2015). [DOI] [PMC free article] [PubMed] [Google Scholar]
- 18.Prossnitz ER, Arterburn JB, Smith HO, Oprea TI, Sklar LA, Hathaway HJ, Estrogen action via the transmembrane receptor GPR30, Annu Rev Physiol 70, 165–190 (2008). [DOI] [PubMed] [Google Scholar]
- 19.Sharma G, Prossnitz ER, G-protein-coupled Estrogen Receptor (GPER) and sex-specific metabolic homeostasis, Adv Exp Med Biol 1043, 427–453 (2017). [DOI] [PMC free article] [PubMed] [Google Scholar]
- 20.Sharma G, Mauvais-Jarvis F, Prossnitz ER, Roles of G protein-coupled estrogen receptor GPER in metabolic regulation, J Steroid Biochem Mol Biol 176, 31–37 (2018). [DOI] [PMC free article] [PubMed] [Google Scholar]
- 21.Sharma G, Prossnitz ER, GPER/GPR30 knockout mice: Effects of GPER on metabolism, Methods Mol Biol 1366, 489–502 (2016). [DOI] [PMC free article] [PubMed] [Google Scholar]
- 22.Barton M, Prossnitz ER, Emerging roles of GPER in diabetes and atherosclerosis, Trends Endocrinol Metab 26, 185–192 (2015). [DOI] [PMC free article] [PubMed] [Google Scholar]
- 23.Prossnitz ER, Sklar LA, Oprea TI, Arterburn JB, GPR30: a novel therapeutic target in estrogen-related disease, Trends Pharmacol Sci 29, 116–123 (2008). [DOI] [PubMed] [Google Scholar]
- 24.Meyer MR, Fredette NC, Daniel C, Sharma G, Amann K, Arterburn JB, Barton M, Prossnitz ER, Obligatory role for GPER in cardiovascular aging and disease, Sci Signal 9, ra105 (2016). [DOI] [PMC free article] [PubMed] [Google Scholar]
- 25.Sharma G, Hu C, Brigman JL, Zhu G, Hathaway HJ, Prossnitz ER, GPER deficiency in male mice results in insulin resistance, dyslipidemia, and a proinflammatory state, Endocrinology 154, 4136–4145 (2013). [DOI] [PMC free article] [PubMed] [Google Scholar]
- 26.Davis KE, Carstens EJ, Irani BG, Gent LM, Hahner LM, Clegg DJ, Sexually dimorphic role of G protein-coupled estrogen receptor (GPER) in modulating energy homeostasis, Horm Behav 66, 196–207 (2014). [DOI] [PMC free article] [PubMed] [Google Scholar]
- 27.Bologa CG, Revankar CM, Young SM, Edwards BS, Arterburn JB, Kiselyov AS, Parker MA, Tkachenko SE, Savchuck NP, Sklar LA, Oprea TI, Prossnitz ER, Virtual and biomolecular screening converge on a selective agonist for GPR30, Nat Chem Biol 2, 207–212 (2006). [DOI] [PubMed] [Google Scholar]
- 28.Dennis MK, Burai R, Ramesh C, Petrie WK, Alcon SN, Nayak TK, Bologa CG, Leitao A, Brailoiu E, Deliu E, Dun NJ, Sklar LA, Hathaway HJ, Arterburn JB, Oprea TI, Prossnitz ER, In vivo effects of a GPR30 antagonist, Nat Chem Biol 5, 421–427 (2009). [DOI] [PMC free article] [PubMed] [Google Scholar]
- 29.Dennis MK, Field AS, Burai R, Ramesh C, Petrie WK, Bologa CG, Oprea TI, Yamaguchi Y, Hayashi S, Sklar LA, Hathaway HJ, Arterburn JB, Prossnitz ER, Identification of a GPER/GPR30 antagonist with improved estrogen receptor counterselectivity, J Steroid Biochem Mol Biol 127, 358–366 (2011). [DOI] [PMC free article] [PubMed] [Google Scholar]
- 30.Prossnitz ER, Arterburn JB, International Union of Basic and Clinical Pharmacology. XCVII. G protein-coupled estrogen receptor and its pharmacologic modulators, Pharmacol Rev 67, 505–540 (2015). [DOI] [PMC free article] [PubMed] [Google Scholar]
- 31.Prossnitz ER, GPER modulators: Opportunity Nox on the heels of a class Akt, J Steroid Biochem Mol Biol 176, 73–81 (2018). [DOI] [PMC free article] [PubMed] [Google Scholar]
- 32.Revankar CM, Bologa CG, Pepermans RA, Sharma G, Petrie WK, Alcon SN, Field AS, Ramesh C, Parker MA, Savchuk NP, Sklar LA, Hathaway HJ, Arterburn JB, Oprea TI, Prossnitz ER, A Selective Ligand for Estrogen Receptor Proteins Discriminates Rapid and Genomic Signaling, Cell Chem Biol 26, 1692–1702 e1695 (2019). [DOI] [PMC free article] [PubMed] [Google Scholar]
- 33.Haas E, Bhattacharya I, Brailoiu E, Damjanovic M, Brailoiu GC, Gao X, Mueller-Guerre L, Marjon NA, Gut A, Minotti R, Meyer MR, Amann K, Ammann E, Perez-Dominguez A, Genoni M, Clegg DJ, Dun NJ, Resta TC, Prossnitz ER, Barton M, Regulatory role of G protein-coupled estrogen receptor for vascular function and obesity, Circ Res 104, 288–291 (2009). [DOI] [PMC free article] [PubMed] [Google Scholar]
- 34.Sharma G, Prossnitz ER, Mechanisms of estradiol-induced insulin secretion by the G protein-coupled estrogen receptor GPR30/GPER in pancreatic beta-cells, Endocrinology 152, 3030–3039 (2011). [DOI] [PMC free article] [PubMed] [Google Scholar]
- 35.Martensson UE, Salehi SA, Windahl S, Gomez MF, Sward K, Daszkiewicz-Nilsson J, Wendt A, Andersson N, Hellstrand P, Grande PO, Owman C, Rosen CJ, Adamo ML, Lundquist I, Rorsman P, Nilsson BO, Ohlsson C, Olde B, Leeb-Lundberg LM, Deletion of the G protein-coupled receptor 30 impairs glucose tolerance, reduces bone growth, increases blood pressure, and eliminates estradiol-stimulated insulin release in female mice, Endocrinology 150, 687–698 (2009). [DOI] [PubMed] [Google Scholar]
- 36.Wang A, Luo J, Moore W, Alkhalidy H, Wu L, Zhang J, Zhen W, Wang Y, Clegg DJ, Bin X, Cheng Z, McMillan RP, Hulver MW, Liu D, GPR30 regulates diet-induced adiposity in female mice and adipogenesis in vitro, Sci Rep 6, 34302 (2016). [DOI] [PMC free article] [PubMed] [Google Scholar]
- 37.Garner SC, Anderson JJ, Mar MH, Parikh I, Estrogens reduce bone loss in the ovariectomized, lactating rat model, Bone Miner 15, 19–31 (1991). [DOI] [PubMed] [Google Scholar]
- 38.Seidell JC, Muller DC, Sorkin JD, Andres R, Fasting respiratory exchange ratio and resting metabolic rate as predictors of weight gain: the Baltimore Longitudinal Study on Aging, Int J Obes Relat Metab Disord 16, 667–674 (1992). [PubMed] [Google Scholar]
- 39.Ye J, Emerging role of adipose tissue hypoxia in obesity and insulin resistance, Int J Obes (Lond) 33, 54–66 (2009). [DOI] [PMC free article] [PubMed] [Google Scholar]
- 40.Yin J, Gao Z, He Q, Zhou D, Guo Z, Ye J, Role of hypoxia in obesity-induced disorders of glucose and lipid metabolism in adipose tissue, Am J Physiol Endocrinol Metab 296, E333–342 (2009). [DOI] [PMC free article] [PubMed] [Google Scholar]
- 41.Trayhurn P, Hypoxia and adipocyte physiology: implications for adipose tissue dysfunction in obesity, Annu Rev Nutr 34, 207–236 (2014). [DOI] [PubMed] [Google Scholar]
- 42.Seale P, Transcriptional regulatory circuits controlling brown fat development and activation, Diabetes 64, 2369–2375 (2015). [DOI] [PMC free article] [PubMed] [Google Scholar]
- 43.Havel PJ, Update on adipocyte hormones: regulation of energy balance and carbohydrate/lipid metabolism, Diabetes 53 Suppl 1, S143–151 (2004). [DOI] [PubMed] [Google Scholar]
- 44.Lean ME, Malkova D, Altered gut and adipose tissue hormones in overweight and obese individuals: cause or consequence?, Int J Obes (Lond) 40, 622–632 (2016). [DOI] [PMC free article] [PubMed] [Google Scholar]
- 45.Heine PA, Taylor JA, Iwamoto GA, Lubahn DB, Cooke PS, Increased adipose tissue in male and female estrogen receptor-alpha knockout mice, Proc Natl Acad Sci U S A 97, 12729–12734 (2000). [DOI] [PMC free article] [PubMed] [Google Scholar]
- 46.Ribas V, Nguyen MT, Henstridge DC, Nguyen AK, Beaven SW, Watt MJ, Hevener AL, Impaired oxidative metabolism and inflammation are associated with insulin resistance in ERalpha-deficient mice, Am J Physiol Endocrinol Metab 298, E304–319 (2010). [DOI] [PMC free article] [PubMed] [Google Scholar]
- 47.Prossnitz ER, Hathaway HJ, What have we learned about GPER function in physiology and disease from knockout mice?, J Steroid Biochem Mol Biol 153, 114–126 (2015). [DOI] [PMC free article] [PubMed] [Google Scholar]
- 48.Dakin RS, Walker BR, Seckl JR, Hadoke PW, Drake AJ, Estrogens protect male mice from obesity complications and influence glucocorticoid metabolism, Int J Obes (Lond) 39, 1539–1547 (2015). [DOI] [PMC free article] [PubMed] [Google Scholar]
- 49.Feldman RD, Gros R, Ding Q, Hussain Y, Ban MR, McIntyre AD, Hegele RA, A common hypofunctional genetic variant of GPER is associated with increased blood pressure in women, Br J Clin Pharmacol 78, 1441–1452 (2014). [DOI] [PMC free article] [PubMed] [Google Scholar]
- 50.Ricquier D, Respiration uncoupling and metabolism in the control of energy expenditure, Proc Nutr Soc 64, 47–52 (2005). [DOI] [PubMed] [Google Scholar]
- 51.Zhang W, Bi S, Hypothalamic regulation of brown adipose tissue thermogenesis and energy homeostasis, Front Endocrinol (Lausanne) 6, 136 (2015). [DOI] [PMC free article] [PubMed] [Google Scholar]
- 52.Naaz A, Zakroczymski M, Heine P, Taylor J, Saunders P, Lubahn D, Cooke PS, Effect of ovariectomy on adipose tissue of mice in the absence of estrogen receptor alpha (ERalpha): a potential role for estrogen receptor beta (ERbeta), Horm Metab Res 34, 758–763 (2002). [DOI] [PubMed] [Google Scholar]
- 53.Lizcano F, Guzman G, Estrogen deficiency and the origin of obesity during menopause, Biomed Res Int 2014, 757461 (2014). [DOI] [PMC free article] [PubMed] [Google Scholar]
- 54.Roberts R, Hodson L, Dennis AL, Neville MJ, Humphreys SM, Harnden KE, Micklem KJ, Frayn KN, Markers of de novo lipogenesis in adipose tissue: associations with small adipocytes and insulin sensitivity in humans, Diabetologia 52, 882–890 (2009). [DOI] [PubMed] [Google Scholar]
- 55.Kim JH, Meyers MS, Khuder SS, Abdallah SL, Muturi HT, Russo L, Tate CR, Hevener AL, Najjar SM, Leloup C, Mauvais-Jarvis F, Tissue-selective estrogen complexes with bazedoxifene prevent metabolic dysfunction in female mice, Mol Metab 3, 177–190 (2014). [DOI] [PMC free article] [PubMed] [Google Scholar]
- 56.Gao Q, Horvath TL, Cross-talk between estrogen and leptin signaling in the hypothalamus, Am J Physiol Endocrinol Metab 294, E817–826 (2008). [DOI] [PubMed] [Google Scholar]
- 57.Clegg DJ, Brown LM, Woods SC, Benoit SC, Gonadal hormones determine sensitivity to central leptin and insulin, Diabetes 55, 978–987 (2006). [DOI] [PubMed] [Google Scholar]
- 58.Barnes KM, Miner JL, Role of resistin in insulin sensitivity in rodents and humans, Curr Protein Pept Sci 10, 96–107 (2009). [DOI] [PubMed] [Google Scholar]
- 59.Gower BA, Nagy TR, Goran MI, Smith A, Kent E, Leptin in postmenopausal women: influence of hormone therapy, insulin, and fat distribution, J Clin Endocrinol Metab 85, 1770–1775 (2000). [DOI] [PubMed] [Google Scholar]
- 60.Abildgaard J, Pedersen AT, Green CJ, Harder-Lauridsen NM, Solomon TP, Thomsen C, Juul A, Pedersen M, Pedersen JT, Mortensen OH, Pilegaard H, Pedersen BK, Lindegaard B, Menopause is associated with decreased whole body fat oxidation during exercise, Am J Physiol Endocrinol Metab 304, E1227–1236 (2013). [DOI] [PubMed] [Google Scholar]
- 61.Lee J, Ellis JM, Wolfgang MJ, Adipose fatty acid oxidation is required for thermogenesis and potentiates oxidative stress-induced inflammation, Cell Rep 10, 266–279 (2015). [DOI] [PMC free article] [PubMed] [Google Scholar]
- 62.Cavalcanti-de-Albuquerque JP, Salvador IC, Martins EL, Jardim-Messeder D, Werneck-de-Castro JP, Galina A, Carvalho DP, Role of estrogen on skeletal muscle mitochondrial function in ovariectomized rats: a time course study in different fiber types, J Appl Physiol (1985) 116, 779–789 (2014). [DOI] [PubMed] [Google Scholar]
- 63.Nicholls DG, Darley-Usmar VM, Wu M, Jensen PB, Rogers GW, Ferrick DA, Bioenergetic profile experiment using C2C12 myoblast cells, J Vis Exp, (2010). [DOI] [PMC free article] [PubMed] [Google Scholar]
- 64.Wang H, Alencar A, Lin M, Sun X, Sudo RT, Zapata-Sudo G, Lowe DA, Groban L, Activation of GPR30 improves exercise capacity and skeletal muscle strength in senescent female Fischer344 x Brown Norway rats, Biochem Biophys Res Commun 475, 81–86 (2016). [DOI] [PMC free article] [PubMed] [Google Scholar]
- 65.Longo M, Zatterale F, Naderi J, Parrillo L, Formisano P, Raciti GA, Beguinot F, Miele C, Adipose Tissue Dysfunction as Determinant of Obesity-Associated Metabolic Complications, Int J Mol Sci 20, (2019). [DOI] [PMC free article] [PubMed] [Google Scholar]
- 66.Straub RH, The complex role of estrogens in inflammation, Endocr Rev 28, 521–574 (2007). [DOI] [PubMed] [Google Scholar]
- 67.Ludgero-Correia A Jr., Aguila MB, Mandarim-de-Lacerda CA, Faria TS, Effects of high-fat diet on plasma lipids, adiposity, and inflammatory markers in ovariectomized C57BL/6 mice, Nutrition 28, 316–323 (2012). [DOI] [PubMed] [Google Scholar]
- 68.Santos RS, de Fatima LA, Frank AP, Carneiro EM, Clegg DJ, The effects of 17 alpha-estradiol to inhibit inflammation in vitro, Biol Sex Differ 8, 30 (2017). [DOI] [PMC free article] [PubMed] [Google Scholar]
- 69.Blasko E, Haskell CA, Leung S, Gualtieri G, Halks-Miller M, Mahmoudi M, Dennis MK, Prossnitz ER, Karpus WJ, Horuk R, Beneficial role of the GPR30 agonist G-1 in an animal model of multiple sclerosis, J Neuroimmunol 214, 67–77 (2009). [DOI] [PMC free article] [PubMed] [Google Scholar]
- 70.Brunsing RL, Owens KS, Prossnitz ER, The G protein-coupled estrogen receptor (GPER) agonist G-1 expands the regulatory T-cell population under TH17-polarizing conditions, J Immunother 36, 190–196 (2013). [DOI] [PMC free article] [PubMed] [Google Scholar]
- 71.Brunsing RL, Prossnitz ER, Induction of interleukin-10 in the T helper type 17 effector population by the G protein coupled estrogen receptor (GPER) agonist G-1, Immunology 134, 93–106 (2011). [DOI] [PMC free article] [PubMed] [Google Scholar]
- 72.Camporez JP, Jornayvaz FR, Lee HY, Kanda S, Guigni BA, Kahn M, Samuel VT, Carvalho CR, Petersen KF, Jurczak MJ, Shulman GI, Cellular mechanism by which estradiol protects female ovariectomized mice from high-fat diet-induced hepatic and muscle insulin resistance, Endocrinology 154, 1021–1028 (2013). [DOI] [PMC free article] [PubMed] [Google Scholar]
- 73.Yonezawa R, Wada T, Matsumoto N, Morita M, Sawakawa K, Ishii Y, Sasahara M, Tsuneki H, Saito S, Sasaoka T, Central versus peripheral impact of estradiol on the impaired glucose metabolism in ovariectomized mice on a high-fat diet, Am J Physiol Endocrinol Metab, (2012). [DOI] [PubMed] [Google Scholar]
- 74.Modder UI, Riggs BL, Spelsberg TC, Fraser DG, Atkinson EJ, Arnold R, Khosla S, Dose-response of estrogen on bone versus the uterus in ovariectomized mice, Eur J Endocrinol 151, 503–510 (2004). [DOI] [PubMed] [Google Scholar]
- 75.Riggs BL, The mechanisms of estrogen regulation of bone resorption, J Clin Invest 106, 1203–1204 (2000). [DOI] [PMC free article] [PubMed] [Google Scholar]
- 76.Meyer MR, Fredette NC, Howard TA, Hu C, Ramesh C, Daniel C, Amann K, Arterburn JB, Barton M, Prossnitz ER, G protein-coupled estrogen receptor protects from atherosclerosis, Sci Rep 4, 7564 (2014). [DOI] [PMC free article] [PubMed] [Google Scholar]
- 77.Burai R, Ramesh C, Shorty M, Curpan R, Bologa C, Sklar LA, Oprea T, Prossnitz ER, Arterburn JB, Highly efficient synthesis and characterization of the GPR30-selective agonist G-1 and related tetrahydroquinoline analogs, Org Biomol Chem 8, 2252–2259 (2010). [DOI] [PMC free article] [PubMed] [Google Scholar]
- 78.Liu M, Bai J, He S, Villarreal R, Hu D, Zhang C, Yang X, Liang H, Slaga TJ, Yu Y, Zhou Z, Blenis J, Scherer PE, Dong LQ, Liu F, Grb10 promotes lipolysis and thermogenesis by phosphorylation-dependent feedback inhibition of mTORC1, Cell Metab 19, 967–980 (2014). [DOI] [PMC free article] [PubMed] [Google Scholar]
Associated Data
This section collects any data citations, data availability statements, or supplementary materials included in this article.
Supplementary Materials
Fig. S1. Baseline glucose homeostasis in female mice after ovariectomy.
Fig. S2. Plasma concentrations of ghrelin, PYY, GIP, amylin, and GLP-1 in ovariectomized female mice after G-1 treatment.
Fig. S3. Baseline glucose homeostasis in diet-induced obese male mice.
Fig. S4. Body weights and glucose tolerance in ovariectomized female mice on high-fat diet after treatment with G-1.
Fig. S5. Effects of different doses of G-1 on body weight in male mice with diet-induced obesity.
Fig. S6. Effects of G-1 dosing regimen on glucose tolerance in male mice with diet-induced obesity.
Table S1. Primers used for qPCR.