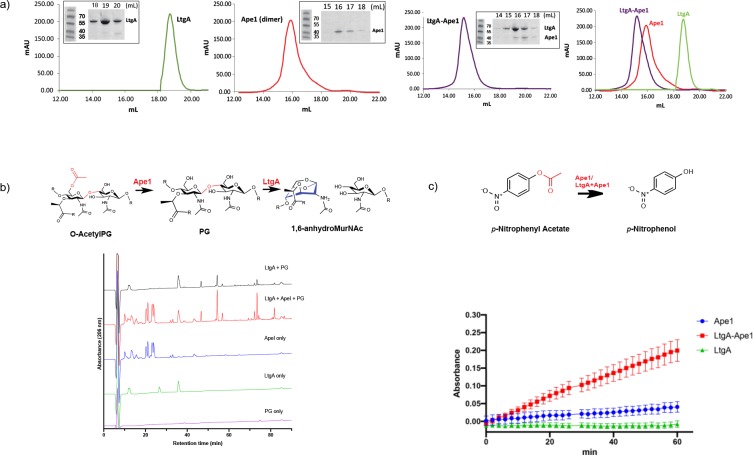
Figure 5. LtgA stimulates and stabilizes the enzymatic activity of Ape1.
(a) Chromatogram of the size exclusion analysis of purified (panel 1) LtgA, (panel 2)Ape1, (panel 3) Ape1-LtgA 105 kDa. Overlay of the chromatograms corresponding to purified LtgA, Ape1, and LtgA-Ape1 protein complex (panel 4). Each insert represents SDS-PAGE analysis of peak fractions containing proteins. Lanes are labeled with corresponding volumes. (b) Ape1 stimulates the activity of LtgA toward the acetylated PG of N. meningitidis. (c) LtgA stimulates and stabilizes Ape1 activity toward p-nitrophenol acetate. Ape1 utilizes p-nitrophenol acetate as a substratewhile LtgA does not. Error bars show the standard deviation of triplicate.


