

Abstract
Myriophyllum, among the most species‐rich genera of aquatic angiosperms with ca. 68 species, is an extensively distributed hydrophyte lineage in the cosmopolitan family Haloragaceae. The chloroplast (cp) genome is useful in the study of genetic evolution, phylogenetic analysis, and molecular dating of controversial taxa. Here, we sequenced and assembled the whole chloroplast genome of Myriophyllum spicatum L. and compared it to other species in the order Saxifragales. The complete chloroplast genome sequence of M. spicatum is 158,858 bp long and displays a quadripartite structure with two inverted repeats (IR) separating the large single copy (LSC) region from the small single copy (SSC) region. Based on sequence identification and the phylogenetic analysis, a 4‐kb phylogenetically informative inversion between trnE‐trnC in Myriophyllum was determined, and we have placed this inversion on a lineage specific to Myriophyllum and its close relatives. The divergence time estimation suggested that the trnE‐trnC inversion possibly occurred between the upper Cretaceous (72.54 MYA) and middle Eocene (47.28 MYA) before the divergence of Myriophyllum from its most recent common ancestor. The unique 4‐kb inversion might be caused by an occurrence of nonrandom recombination associated with climate changes around the K‐Pg boundary, making it interesting for future evolutionary investigations.
Keywords: Haloragaceae, hydrophyte, inversion, Myriophyllum spicatum, structure variation
We sequenced the entire chloroplast genome of Myriophyllum spicatum, a species in Saxifragales. The chloroplast genome of M. spicatum is 158,858 bp long and consists of a quadripartite structure with two inverted repeats separating the large and small single copy regions. In addition, it contains a 4‐kb phylogenetically informative inversion between trnE‐trnC that is unique to at least two genera in Haloragaceae. This inversion may be useful as a barcode to identify species in this genus, many of which are invasive and difficult to identify using morphological characteristics.
1. INTRODUCTION
Haloragaceae (Saxifragales) is a dicotyledonous, cosmopolitan family that includes eight genera and approximately 138 species (Moody & Les, 2007). Life forms vary widely in this family, which presents both terrestrial (small trees, shrubs, subshrubs, and annuals) and aquatic or semiaquatic genera (Moody & Les, 2010). Myriophyllum L. is a cosmopolitan aquatic angiosperm genus in Haloragaceae with ca. 68 species (as defined by APG II 2003). Some Myriophyllum species are highly invasive in several countries due to rapid asexual reproduction and strong competitiveness in aquatic systems (Moody & Les, 2010). In addition, reliable morphological identification of Myriophyllum is particularly difficult in the field when reproductive structures are lacking, as is common among many aquatic taxa (Cronk & Fennessy, 2001; Moody & Les, 2010; Sculthorpe, 1967). The genetic relationships also do not readily facilitate identification as previously published molecular phylogenies are lacking (Moody & Les, 2010). Commonly used markers for determining phylogenetic relationships include the nuclear‐encoded internal transcribed spacer (nrITS) and numerous chloroplast DNA markers (Moody & Les, 2007, 2010; Thum, Zuellig, Johnson, Moody, & Vossbrinck, 2011). Therefore, it is necessary to select more appropriate phylogenetically informative regions.
The sequencing of whole chloroplast genomes (cp genome), which are haploid and maternally inherited, have the potential to significantly advance our ability to resolve evolutionary relationships in complex plant lineages, such as Myriophyllum (Doorduin et al., 2011; Philippe & Roure, 2011). The plant cp genome is generally conserved in content and structure. It is usually composed of two copies of inverted repeats (IR) that separate a large single copy region (LSC) from a small single copy region (SSC). Highly conserved genes (100–120) have been retained in the cp genome, including those for photosynthesis, self‐reproduction, transcription of chloroplast expression‐related genes, and some unknown genes (Wicke, Schneeweiss, Depamphilis, Müller, & Quandt, 2011). Despite being much more conservative than the nuclear and mitochondrial genomes, the cp genome still varies in size, contraction and expansion of IRs, and structure (Daniell, Lin, Yu, & Chang, 2016). Moreover, many mutation events in the cp genome have been detected including indels, substitutions, and inversions (Chumley et al., 2006).
These evolutionary hotspots can provide useful information to elucidate the phylogenetic relationships of taxonomically unresolved plant taxa. Kim, Choi, and Jansen (2005) confirmed the Barnadesioideae as the most basal lineage in the Asteraceae by using a 22‐kb DNA inversion. The close relationship between the Poaceae and Joinvilleaceae was clarified by treating three DNA inversions composed of a nested set as a phylogenetic character (Doyle, Davis, Soreng, Garvin, & Anderson, 1992). Some variations in the cp genome, like gene loss and transfer, have been used to determine the evolutionary history of some plant species. For example, the extreme loss of ndh genes observed in Najas flexilis was used to illustrate a modified character associated with photosynthetic efficiency (Peredo, King, & Les, 2013).
In this study, we sequenced the complete cp genome of M. spicatum (Figure 1). The cp genome was then compared with previously published cp genomes from related species, allowing the identification of a noteworthy inversion. Phylogenetic analyses were then performed on Saxifragales spp. to determine the point at which the inversion in the cp genome of Myriophyllum occurred. Finally, we evaluated the sequence divergence between Myriophyllum and other clades in Haloragaceae. We investigated potentially useful plastid regions for future molecular phylogenetic analyses in Saxifragales with observation on the variation of chloroplasts at different molecular markers (exon, intron, and intergenic regions). These data provide insight into the evolutionary history of this cosmopolitan family and, in the future, will facilitate the identification of Myriophyllum spp.
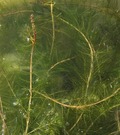
Figure 1.
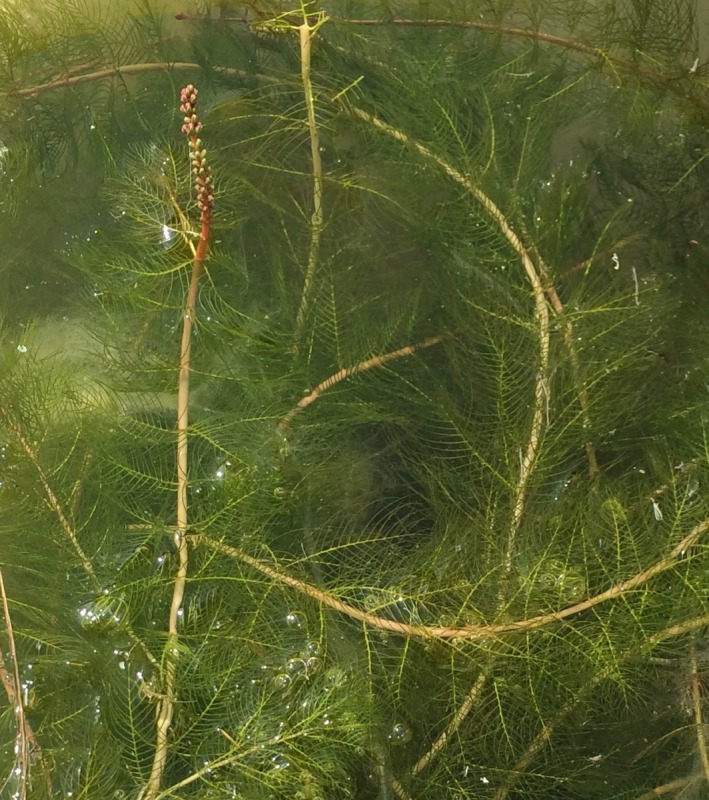
The Myriophyllum spicatum L. (Haloragaceae, Myriophyllum), a perennial submerged aquatic plant widely distributed in Europe, Asia, and north Africa
2. MATERIALS AND METHODS
2.1. Plant materials and DNA extraction
The taxa sampled in this study are shown in Table 1. All specimens were deposited in Wuhan Botanical Garden, Chinese Academy of Sciences in China. The total DNA of all samples were isolated from the fresh leaves according to the mCTAB method (Li, Wang, Yu, & Wang, 2013).
Table 1.
Taxa used for cp DNA sequencing and PCR diagnosis of the inversion
| No. | Family | Species | Locality | Used for |
|---|---|---|---|---|
| 1 | Haloragidaceae | Gonocarpus micranthus Thunb. | Shanwei, Guangdong, China | cp DNA sequencing |
| 2 | Haloragidaceae | Myriophyllum alterniflorum DC. | UK | PCR diagnosis |
| 3 | Haloragidaceae | Myriophyllum aquaticum (Vell.) Verdc. | Zhenjiang, Jiangsu, China | PCR diagnosis |
| 4 | Haloragidaceae | Myriophyllum dicoccum F. Muell. | Shanwei, Guangdong, China | PCR diagnosis |
| 5 | Haloragidaceae | Myriophyllum heterophyllum Michx. | USA | PCR diagnosis |
| 6 | Haloragidaceae | Myriophyllum lophatum Orchard | Australia | PCR diagnosis |
| 7 | Haloragidaceae | Myriophyllum oguraense Miki | Liangzi Lake, Ezhou, Hubei, China | PCR diagnosis |
| 8 | Haloragidaceae | Myriophyllum quitense Kunth | USA | PCR diagnosis |
| 9 | Haloragidaceae | Myriophyllum sibiricum Kom. | Ice land | PCR diagnosis |
| 10 | Haloragidaceae | Myriophyllum spicatum L. | Germany | PCR diagnosis |
| 11 | Haloragidaceae | Myriophyllum tenellum Bigelow | USA | PCR diagnosis |
| 12 | Haloragidaceae | Myriophyllum ussuriense Maxim. | Wuhan Botanical Gardon, Wuhan, Hubei, China | PCR diagnosis |
| 13 | Haloragidaceae | Myriophyllum variifolium Hook.f. | Australia | PCR diagnosis |
| 14 | Haloragidaceae | Myriophyllum verrucosum Lindl. | Australia | PCR diagnosis |
| 15 | Haloragidaceae | Myriophyllum verticillatum L. | Fuyuan, Heilongjiang, China | PCR diagnosis |
2.2. Chloroplast genome sequencing, mapping, and annotation for M. spicatum
The whole cp genome of M. spicatum was sequenced. The DNA sequencing library of M. spicatum was prepared following the method described by Dong, Xu, Cheng, Lin, and Zhou (2013) and Dong, Xu, Cheng, and Zhou (2013), and fragments were amplified using universal primers. Specific primers were designed for regions, such as poly‐A tails, that were insufficiently amplified using the universal primers. The inverted repeat regions (IRs) of the cpDNA were not amplified separately; instead, primers were designed to amplify the regions spanning the junctions of LSC/IRA, LSC/IRB, SSC/IRA, and SSC/IRB. Using these primers, we covered the entire cp genome of M. spicatum with PCR products ranging in size from 500 bp to 5 kb. The overlapping regions of each pair of adjacent PCR fragments exceeded 150 bp. The standard PCR amplification reactions were performed at 94°C for 4 min followed by 35 cycles of 30s denaturation at 94°C, 30s annealing at 55°C, 1.5 min extension at 72°C, and a final extension of 72°C for 10 min. PCR products were electrophoresed on a 1.0% agarose gel and purified with gel extraction kit (Omega Bio‐Tek). The amplified DNA fragments were further sent to Majorbio Bio‐Pharm Technology Co. Ltd. (Shanghai, China) for Sanger sequencing in both the forward and reverse directions according to their standard protocols on an ABI 3730xl DNA Analyzer. All fragments were sequenced 2–10 times (6‐fold coverage of the M. spicatum cp genome on average). The chloroplast DNA sequences were manually assembled by using of the program Sequencher v4.1.4 (Gene Codes Corporation, USA). Since automated assembly methods cannot distinguish two IRs, we input the reads as two groups and obtained two large contigs, with each contig including one IR and its adjacent partial large and small single copy (LSC and SSC) regions. Then, the two large contigs were manually assembled into the complete circular genome sequence.
The cp genome of M. spicatum was annotated using the online program Dual Organellar Genome Annotator (DOGMA; Wyman, Jansen, & Boore, 2004). All tRNA genes were further verified by the corresponding structures predicted by tRNAscan‐SE 1.3.1 (Schattner, Brooks, & Lowe, 2005). The graphical map of the circular plastome was drawn by GenomeVx (Conant & Wolfe, 2008).
The frequency of codon usage in exon sequences of all protein‐coding genes of the cp genome of M. spicatum was calculated by using of MEGA 6 (Tamura, Stecher, Peterson, Filipski, & Kumar, 2013) and yn00 in PAML 4 (Yang, 2007). REPuter (Kurtz et al., 2001) was used to identify and locate forward, palindrome, reverse, and complement sequences that were ≥30 bp and had a sequence identity ≥90%. Simple sequence repeats (SSRs) were identified with MISA (http://pgrc.ipk-gatersleben.de/misa/; Thiel et al., 2003). Detection criteria were constrained to perfect repeat motifs of 1–6 bp and a minimum repeat number of 8, 4, 4, 3, 3, and 3, for mono‐, di‐, tri‐, tetra‐, penta‐, and hexa‐nucleotide repeats, respectively. Geneious v8.0.2 (http://www.Geneious.com; Kearse et al., 2012) was used to perform the mapping of the location and size of repeated elements and SSRs in the M. spicatum cp genome.
2.3. Comparative genomic analysis
To determine structural variation of the cp genome, the newly sequenced cp genome of M. spicatum was compared with the cp genome of four other Saxifragales species: Liquidambar formosana [KC588388], Paeonia obovata [KJ206533], Penthorum chinense [JX436155], and Sedum sarmentosum [JX427551]. Mauve software 2.3.1 was used to determine the structural variation (Darling, Mau, Blattner, & Perna, 2004), and the cp genome of Nicotiana tabacum [NC_001879] was used as a reference.
To identify the presence of large structural variation (>1 kb) within the M. spicatum plastome, breaks of synteny were searched among plastomes of M. spicatum, L. formosana, P. obovata, P. chinense, and S. sarmentosum as well as two outgroup taxa, Vitis vinifera [NC_007957] and N. tabacum [NC_001879]. The mVISTA program in Shuffle‐LAGAN mode (Frazer, Pachter, Poliakov, Rubin, & Dubchak, 2004) was used to perform the sequential comparison of the cp genomes with the sequence annotation information of M. spicatum.
2.4. Identification of the inversion by PCR screening and sequencing in Myriophyllum and close relative Gonocarpus
To determine the origin of the inversion observed in M. spicatum, its presence/absence was surveyed by PCR with primer pairs diagnostic in Myriophyllum (M. spicatum, M. alterniflorum, M. aquaticum, M. dicoccum, M. heterophyllum, M. lophatum, M. oguraense, M. quitense, M. sibiricum, M. tenellum, M. ussuriense, M. variifolium, M. verrucosum, M. verticillatum), and Gonocarpus (G. micranthus; listed in Table 1). The primer pairs were designed in either conserved rpoB and trnE or trnC and trnT protein‐coding sequences, which are flanking the inversion endpoints, to allow for the assessment of the presence or absence of the inversion. The primer pairs used were: rpoB‐F (5′‐CTTCCGTCAAGCCCTGATC‐3′) and trnE‐R (5′‐ AATCCCCGCTGCCTCCTT‐3′) as well as trnC‐F (5′‐CGGATTTGAACTGGGGAAAA‐3′) and trnT‐R (5′‐CGGATTTGAACCGATGACTTAC‐3′). Each 50 μl reaction contained 2.5 mM MgCl2, 0.2 mM deoxynucleoside triphosphate, 0.25 mM primers, 2.5 units of Taq polymerase, and 2–5 ng of DNA. The standard PCR amplification reactions were performed at 94°C for 2 min followed by 35 cycles of 1 min denaturation at 94°C, 1 min annealing at 55°C, 2 min extension at 72°C, and a final extension of 72°C for 7 min. PCR‐amplified DNA was purified using the QIAquick PCR purification kit and then checked on 2% agarose gels after staining with ethidium bromide. The purified products were sequenced by Sangon Biotech (Shanghai, China). Sequence assemblies and alignments followed the abovementioned methods.
2.5. Phylogenetic analysis
The rpoB‐trnE and trnC‐trnT inversion regions and molecular markers (ITS, trnK, and matK) used in a previous study (Moody & Les, 2010) were used for a phylogenetic analysis. Because the rpoB‐trnE and trnC‐trnT loci are absent in L. formosana, P. obovata, P. chinense, and S. sarmentosum, the rpoB‐trnC and trnE‐trnT loci were used for these species because of high homology. Alignments were performed using MAFFT version 7. 0 (Katoh & Standley, 2013) with default parameters. Three combined datasets were created: (a) rpoB‐trnE and trnC‐trnT; (b) ITS, matK, and trnK; and (c) ITS, matK, trnK, rpoB‐trnE, and trnC‐trnT. An incongruence length difference (ILD) test between the nrITS and cpDNA was performed in PAUP v4.0b10 (Swofford, 2002) with 100 replicates, and this test indicated significant differences between data partitions (p < .01).
Maximum likelihood (ML), conducted using RAxML 7.0.3 (Stamatakis, 2006), and Bayesian inference (BI), conducted using MrBayes 3.1.2 (Huelsenbeck & Ronquist, 2001), were used to conduct the phylogenetic analyses. For ML analyses, values of all parameters were calculated by RAxML. Nonparametric ML bootstrap analyses included 1,000 pseudoreplicates. For BI analyses, two simultaneous runs were conducted, each consisting of four chains. In total, chains were run for 5,000,000 generations, with trees sampled every 1,000 generations. The first 25% of sampled generations were discarded as burn‐in, and the remaining trees were used to calculate majority‐rule consensus trees and posterior probabilities for nodes. Akaike information criterion (AIC) via Modeltest v3.7 (Posada & Crandall, 1998) was used to determine the most appropriate model of nucleotide evolution, supporting the use of GTR + I+G.
2.6. Molecular dating
Molecular dating analyses were run in BEAST package v1.7.5 (Drummond & Rambaut, 2007) using the combined ITS, matK, trnK, rpoB‐trnE, and trnC‐trnT matrix. The analysis followed the dating strategies in Chen et al. (Chen et al., 2014). The GTR + I + G model was selected as the best fit for the data by Mrmodeltest v2.3 (Nylander, 2004). A relaxed clock (uncorrelated lognormal) was selected as preliminary likelihood‐ratio test (LRT; Huelsenbeck & Rannala, 1997) rejected the strict molecular clock hypothesis for our data (p < .01). A Yule speciation model was used as a prior on the tree. We chose two reliable calibration points to constrain divergence times based on fossil taxa as follows: the extinct Tarahumara sophiae, representing the oldest known macrofossil record for Haloragaceae from the Maastrichtian–Campanian period (70.0 Ma) in northern Mexico (Hernandez‐Castillo & Cevallos‐Ferriz, 1999); one Altingiaceae species, Microaltingia apocarpelata (Zhou, Crepet, & Nixon, 2001), considered one of the oldest fossils of Saxifragales represented by macrofossils from the Upper Cretaceous (ca. 90 Ma) in New Jersey (USA). We defined 90.0 Ma as the lower boundary for the root age, and the crown group age of Haloragaceae was 70.0 Ma. Six independent Bayesian Markov chain Monte Carlo (MCMC) chains were run for 100 million generations on each, sampling every 10,000 generations. Tracer v1.5 was used to check the effective sample size (ESS) scores for all relevant estimated parameters to ensure values above 250. LogCombiner v1.7.5 was used to combine trees from these six runs and removed 25% generations as burn‐in. A maximum clade credibility tree with median ages and 95% highest posterior density (HPD) intervals was constructed using TreeAnnotator v1.7.5.
3. RESULTS
3.1. General characteristics of the M. spicatum cp genome
The complete cp genome of M. spicatum (GenBank accession number: MK250869) contains 158,858 bp with a quadripartite structure, and two IRs (25,813 bp) separated by an SSC (18,814 bp) and an LSC (88,418 bp) region (Figure 2). The IR extends from rps19 through a portion of ycf1 and contains 18 duplicated genes with one or two introns. The genome contains 113 unique genes including 30 tRNA genes, four rRNA genes, and 79 protein‐coding genes (Table 2). Genes involved in photosynthesis and transcription and translation were the two dominant families. There were six genes coding the subunits of ATP synthase and 11 genes associated with the subunits of NADH dehydrogenase. The genome consists of 58% coding regions and 42% noncoding regions, including both intergenic spacers and introns. A total of 26,316 codons represent the coding capacity of 79 protein‐coding genes in the genome. The frequency of codon usage was calculated based on the sequences of protein‐coding genes and tRNA genes, which are summarized in Table 3. Codon usage frequency demonstrated that leucine is the most common amino acid with 2,812 codons (10.69%), while cysteine is the least common with 299 codons (1.14%).
Figure 2.
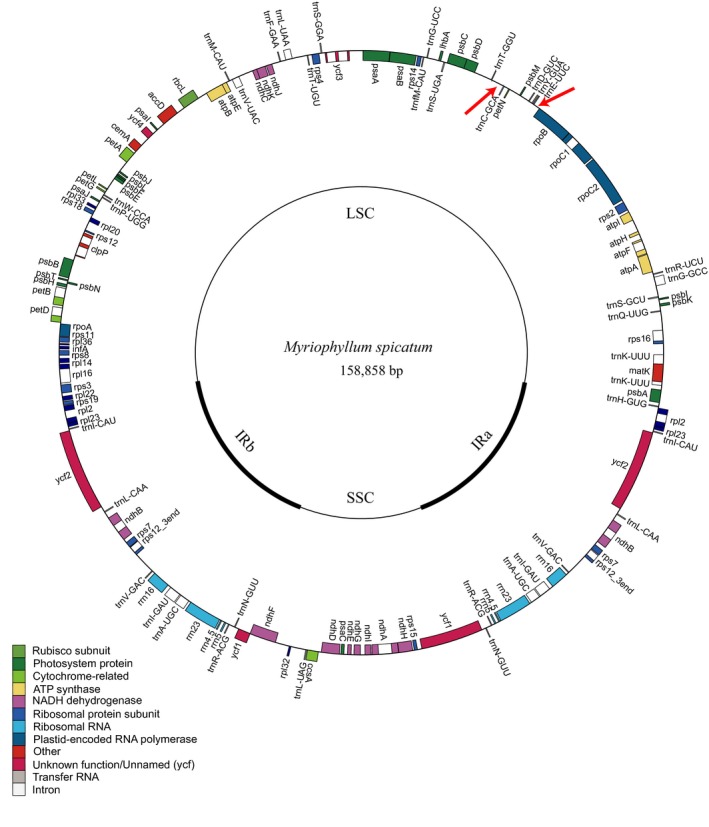
The whole assembly of the chloroplast genome of M. spicatum. The inverted repeats (IRa, IRb) were indicated in thick black lines on inner cycle which separate the genome into the large (LSC) and small (SSC) single copy regions. The genes drawn outside of the circle are transcribed counterclockwise, while those inside are clockwise. Gene boxes are colored by functional group as shown in the key. The red arrows denote the location of the 4‐kb inversion
Table 2.
Genes present in Myriophyllum spicatum chloroplast genome
| Category | Group of genes | Genes |
|---|---|---|
| Photosynthesis‐related genes (47) | Rubisco (1) | rbcL |
| Photosystem I (5) | psaA, psaB, psaC, psaI, psaJ | |
| Assembly/stability of photosystem I (2) | ycf3**,ycf4 | |
| Photosystem II (15) | psbA,psbB,psbC,psbD,psbE,psbF,psbH,psbI,psbJ,psbK,psbL,psbM,psbN,psbT,psbZ | |
| ATP synthase (6) | atpA, atpB, atpE, atpF*, atpH, atpI | |
| cytochrome b/f compelx (6) | petA, petB*, petD*, petG, petL, petN | |
| cytochrome c synthesis (1) | ccsA | |
| NADPH dehydrogenase (11) | ndhA*, ndhB*(x2), ndhC, ndhD, ndhE, ndhF,ndhG, ndhH, ndhI, ndhJ, ndhK | |
| Transcription and translation‐related genes (59) | transcription (4) | rpoA, rpoB, rpoC1*, rpoC2 |
| ribosomal proteins (20) | rps2, rps3, rps4, rps7(x2), rps8, rps11, rps12*(x2), rps14,rps15, rps16*, rps18, rps19,rpl2*(x2), rpl14, rpl16*, rpl20, rpl23(x2), rpl32, rpl33,rpl36 | |
| translation initiation factor (1) | infA | |
| ribosomal RNA (4) | rrn5(x2), rrn4.5(x2), rrn16(x2), rrn23(x2) | |
| transfer RNA (30) | trnA‐UGC*(x2), trnC‐GCA, trnD‐GUC, trnE‐UUC, trnF‐GAA,,trnG‐UCC,trnG‐GCC*, trnH‐GUG, trnI‐CAU(x2), trnI‐GAU*(x2),trnK‐UUU*, trnL‐CAA(x2), trnL‐UAA*, trnL‐UAG, trnfM‐CAUI,trnM‐CAU, trnN‐GUU(x2), trnP‐UGG, trnQ‐UUG,trnR‐ACG(x2), trnR‐UCU, trnS‐GCU, trnS‐GGA, trnS‐UGA, trnT‐GGU,trnT‐UGU, trnV‐GAC(x2), trnV‐UAC*, trnW‐CCA, trnY‐GUA | |
| Other genes (6) | RNA processing (1) | matK |
| carbon metabolism (1) | cemA | |
| fatty acid synthesis (1) | accD | |
| proteolysis (1) | clpP** | |
| conserved genes with unknown functions (2) | ycf1, ycf2(x2), ycf15(x2) |
One and two superscript asterisks indicate one‐ and two‐intron‐containing genes, respectively. Genes located in the IR region are indicated by (x2) after the gene name.
Table 3.
Codon usage in Myriophyllum spicatum chloroplast genome
| Codon | Amino acid | Count | RSCU | tRNA | Codon | Amino acid | Count | RSCU | tRNA |
|---|---|---|---|---|---|---|---|---|---|
| UUU(F) | Phe (F) | 988 | 1.31 | UCU(S) | Ser (S) | 564 | 1.68 | ||
| UUC(F) | Phe (F) | 524 | 0.69 | trnF‐GAA | UCC(S) | Ser (S) | 304 | 0.90 | trnS‐GGA |
| UUA(L) | Leu (L) | 870 | 1.86 | trnL‐UAA | UCA(S) | Ser (S) | 409 | 1.22 | trnS‐UGA |
| UUG(L) | Leu (L) | 560 | 1.19 | trnL‐CAA | UCG(S) | Ser (S) | 198 | 0.59 | |
| CUU(L) | Leu (L) | 593 | 1.27 | CCU(P) | Pro (P) | 424 | 1.58 | ||
| CUC(L) | Leu (L) | 199 | 0.42 | CCC(P) | Pro (P) | 202 | 0.75 | trnP‐UGG | |
| CUA(L) | Leu (L) | 394 | 0.84 | trnL‐UAG | CCA(P) | Pro (P) | 315 | 1.17 | |
| CUG(L) | Leu (L) | 196 | 0.42 | CCG(P) | Pro (P) | 135 | 0.50 | ||
| AUU(I) | I le (I) | 1,103 | 1.45 | ACU(T) | Thr (T) | 542 | 1.61 | ||
| AUC(I) | I le (I) | 418 | 0.55 | trnI‐GAU | ACC(T) | Thr (T) | 243 | 0.72 | trnT‐GGU |
| AUA(I) | I le (I) | 748 | 1.12 | trnI‐CAU | ACA(T) | Thr (T) | 407 | 1.21 | trnT‐UGU |
| AUG(M) | Met (M) | 590 | 0.88 | trnM‐CAU | ACG(T) | Thr (T) | 156 | 0.46 | |
| GUU(V) | Val (V) | 520 | 1.48 | GCU(A) | Ala (A) | 637 | 1.82 | ||
| GUC(V) | Val (V) | 175 | 0.50 | trnV‐GAC | GCC(A) | Ala (A) | 230 | 0.66 | |
| GUA(V) | Val (V) | 525 | 1.49 | trnV‐UAC | GCA(A) | Ala (A) | 401 | 1.15 | trnA‐UGC |
| GUG(V) | Val (V) | 186 | 0.53 | GCG(A) | Ala (A) | 129 | 0.37 | ||
| UAU(Y) | Try (Y) | 785 | 1.62 | UGU(C) | Cys (C) | 227 | 1.52 | ||
| UAC(Y) | Try (Y) | 185 | 0.38 | trnY‐GUA | UGC(C) | Cys (C) | 72 | 0.48 | |
| UAA(*) | Stop | 49 | 0.27 | UGA(*) | Stop | 15 | 0.06 | trnS‐GCU | |
| UAG(*) | Stop | 21 | 0.12 | UGG(W) | Trp (W) | 460 | 1.94 | trnC‐GCA | |
| CAU(H) | His (H) | 471 | 1.52 | CGU(R) | Arg (R) | 340 | 1.48 | ||
| CAC(H) | His (H) | 150 | 0.48 | CGC(R) | Arg (R) | 99 | 0.43 | trnW‐CCA | |
| CAA(Q) | Gln (Q) | 712 | 1.51 | trnH‐GUG | CGA(R) | Arg (R) | 354 | 1.54 | trnR‐ACG |
| CAG(Q) | Gln (Q) | 231 | 0.49 | trnQ‐UUG | CGG(R) | Arg (R) | 129 | 0.56 | |
| AAU(N) | Asn (N) | 968 | 1.52 | AGU(S) | Ser (S) | 446 | 1.33 | ||
| AAC(N) | Asn (N) | 305 | 0.48 | AGC(S) | Ser (S) | 95 | 0.28 | ||
| AAA(K) | Lys (K) | 1,080 | 1.51 | trnN‐GUU | AGA(R) | Arg (R) | 500 | 2.76 | trnR‐UCU |
| AAG(K) | Lys (K) | 350 | 0.49 | trnK‐UUU | AGG(R) | Arg (R) | 154 | 0.85 | |
| GAU(D) | Asp (D) | 887 | 1.63 | GGU(G) | Gly (G) | 595 | 1.32 | ||
| GAC(D) | Asp (D) | 201 | 0.37 | GGC(G) | Gly (G) | 168 | 0.37 | trnG‐GCC | |
| GAA(E) | Glu (E) | 1,007 | 1.50 | trnD‐GUC | GGA(G) | Gly (G) | 716 | 1.59 | trnG‐UCC |
| GAG(E) | Glu (E) | 338 | 0.50 | trnE‐UUC | GGG(G) | Gly (G) | 321 | 0.71 |
Excluding pseudogenes.
3.2. Repeat analysis
A total of 38 repeats were found including 21 direct (forward) repeats, 15 inverted (palindrome) repeats, one reverse repeat, and one complement repeat (Table S1). The longest repeat is a 51‐bp inverted repeat between the rbcL and accD. Most of the repeats are distributed within the intergenic spacer regions, the intron sequences, and ycf1 and ycf2. Cp microsatellites (cpSSRs) are potentially useful markers for detection of polymorphisms (Provan, Powell, & Hollingsworth, 2001); therefore, the distribution of SSRs was also analyzed, and 260 SSRs were identified in total. Among the identified SSRs, 177 mononucleotide SSRs (68.08%), 66 dinucleotide SSRs (25.38%), seven trinucleotide SSRs (2.70%), and 10 tetranucleotide SSRs (3.84%) were recognized. Most homopolymers are constituted by A/T sequences (98.87%). Of the dipolymers, 75.76% were constituted by multiple A and T bases. One hundred and fifty‐nine of the SSR loci were found in the intergenic regions, 35 were located in introns, and the other 66 SSRs were located in genes (Table S2). The locations of repeat sequences and SSRs are shown in Figure 3.
Figure 3.
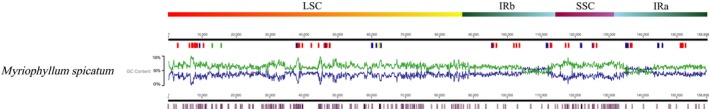
Distribution of repeat sequences and SSRs in M. spicatum chloroplast genome. GC content is shown
3.3. Comparison of genome organization in Saxifragales
To understand the structural characteristics in the cp genomes of M. spicatum, L. formosana, P. obovata, P. chinense, and S. sarmentosum, and broadly, Saxifragales, the size, gene content, and organization of the cp genomes were sampled for comparative analysis. The characters of the genomes from the abovementioned species are listed in Table S3. As expected, there were considerable differences in terms of genome size, GC content, extent of IR, gene content, and gene order. The coding region in M. spicatum was the largest (92,088 bp) among the five Saxifragales species investigated. The GC content of the LSC region, SSC region, and IRs of M. spicatum was the lowest. To understand the structural characteristics in the cp genome of M. spicatum, the comparative sequence alignment of the cp genome sequences of the five Saxifragales species was performed with the new annotation of M. spicatum as a reference (Figure 4). This showed general conservativeness among the five species but with some highly varied regions, including ycf1, rps16, ndhA, and accD, occurring as the most divergent coding genes.
Figure 4.
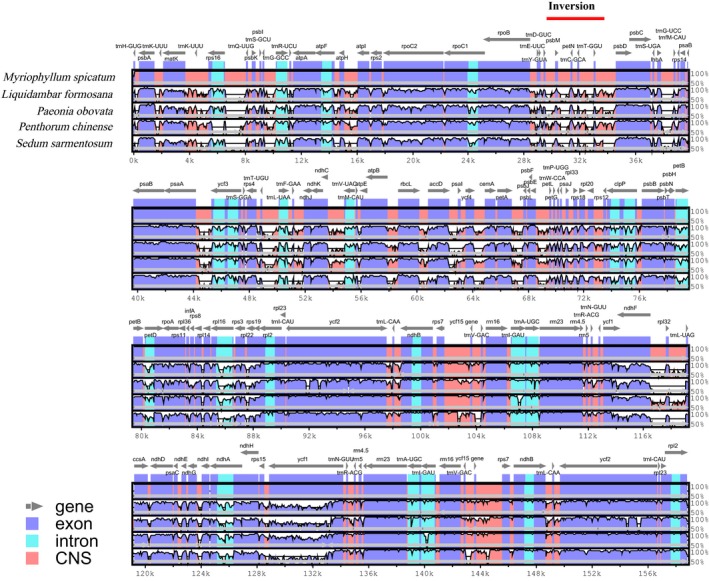
Comparison of five Saxifragales chloroplast genome. The top gray arrows and thick black lines show genes with their orientation. The inversion was indicated by thick red line. The y‐axis represents the percent identity within 50%–100%. The x‐axis represents the coordinate in the cp genome. Genome regions are color‐coded as protein‐coding (exon), intron, and conserved noncoding sequences (CNS)
The exact borders between the IR regions and the two single copy regions (LSC and SSC) were also compared to investigate the contraction or expansion of the IR regions (Figure 5). We found that the IR/SSC boundary regions were slightly varied. The genes marking the beginning and end of the IR were only partially duplicated. Specifically, 2–110 bp of rps19 (except for in P. chinense, which was entirely located in the LSC) and 1,065–1,164 bp of ycf1. The rps19 pseudogene occurred at the end of IRa and the ycf1 pseudogene occurred at the end of IRb. The ndhF gene shares some nucleotides with the ycf1 pseudogene (35 bp in M. spicatum, 1 bp in P. obovata, and 29 bp in P. chinense). Neither gene loss nor intron loss were detected in the cp genome of M. spicatum. ycf15 is identified as a pseudogene in the cp genome of M. spicatum because of the presence of a premature stop codon, which is different from the other four Saxifragales species.
Figure 5.
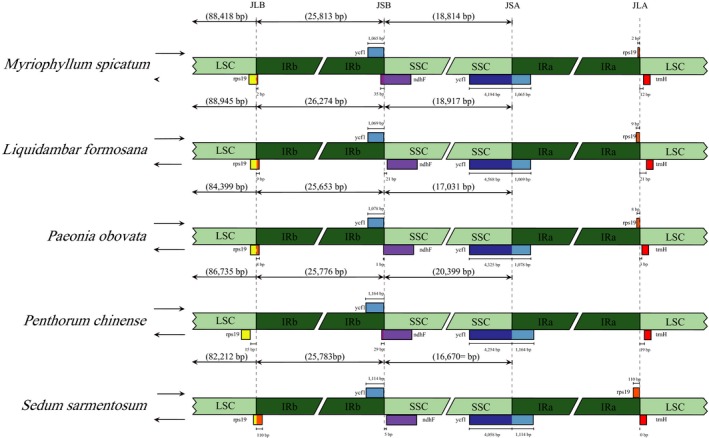
Comparison of the borders of LSC, IR, SSC, and LSC regions among five Saxifragales genomes. The adjacent border genes are indicated by boxes with gene names and bps above or below the main line
3.4. Occurrence of the unique lineage‐specific inversion
A 4‐kb inverted fragment in the LSC between rpoB‐trnT was found in M. spicatum after comparison with the four other taxa from Saxifragales (Figure 6). One end point of the inversion is located between the rpoB and trnE and ~300 bp upstream to trnE. The other end point is located between the trnC‐UUC and trnT‐GGU, ~1,000 bp downstream to trnC. The break points do not disrupt any genes. The trnE‐trnC inversion contained four tRNA genes (trnE, trnY, trnD, and trnC) and two protein‐coding genes (psbM and petN). To verify the presence of the inversion in Myriophyllum, we investigated 13 other Myriophyllum species (M. alterniflorum, M. aquaticum, M. dicoccum, M. heterophyllum, M. lophatum, M. oguraense, M. quitense, M. sibiricum, M. tenellum, M. ussuriense, M. variifolium, M. verrucosum, M. verticillatum) as well as G. micranthus in Haloragaceae, which is a species in a closely related genus. PCR amplification guided by four designed primers confirmed the presence the 4‐kb inversion among all of these species. Moreover, L. formosana, P. obovata, P. chinense, and S. sarmentosum lacked this 4‐kb inversion.
Figure 6.
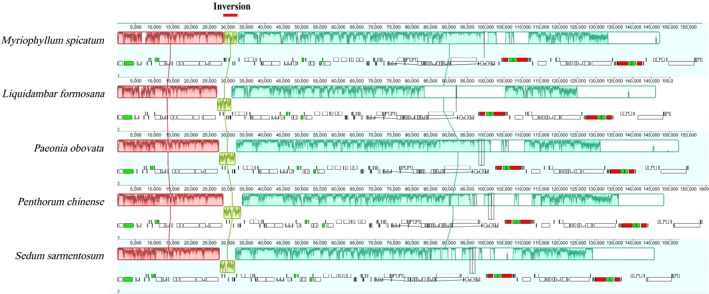
Linearized maps comparison of the plastid genomes of five Saxifragales plants. Syntenic blocks are shown above and gene maps are shown below. Unique regions are boxed in yellow, and the inversion events occurred in M. spicatum are marked with short red line
The phylogenetic relationships among 15 Haloragaceae species and four outgroup species (L. formosana, P. obovata, P. chinense, and S. sarmentosum) were investigated using three combined datasets (Figure 7). Two highly supported with strong bootstrap value (100%) monophyletic groups were identified within the 14 Myriophyllum species (Figure 6). Gonocarpus micranthus clustered into Myriophyllum, indicating that additional detailed analyses are needed including more species of Myriophyllum, Gonocarpus, and other closely related genera. The results also showed that P. chinense was more closely related to Haloragaceae rather than other outgroup species. Our results are congruent with the previous phylogenetic analysis among families of Saxifragales (Dong, Xu, Cheng, Lin, et al., 2013; Dong, Xu, Cheng, & Zhou, 2013; Jian et al., 2008; Moody & Les, 2010). The 4‐kb inversion originated after the split of Haloragaceae and Penthoraceae but before the divergence of Myriophyllum and Gonocarpus; the 4‐kb inversion was identified in all of the included Myriophyllum species and the Gonocarpus taxa. Bayesian analysis in BEAST and molecular dating (Figure 8b) further suggested that the trnE‐trnC inversion might have occurred between upper Cretaceous (72.54 MYA) and middle Eocene (47.28 MYA).
Figure 7.
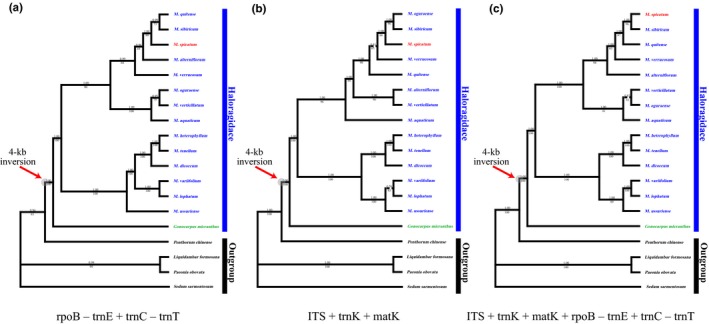
Inferred phylogenetic trees of 15 taxa of Haloragidaceae and related families basing on maximum (ML) and Bayesian inference (BI) analyses of different combined datasets. (a) rpoB‐trnE+trnC‐trnT. (b) ITS+trnK+matK. (c) ITS+trnK+matK+rpoB‐trnE+trnC‐trnT. The ML bootstrap values (below) and Bayesian posterior probability (above) are given for each branch. The 4‐kb inversion rearrangement event was mapped onto the branches with red arrow
Figure 8.
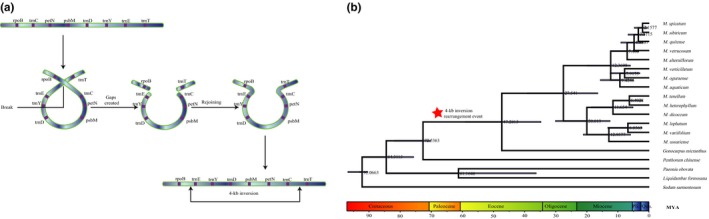
(a) Illustration of the suggested flip‐flop recombination event in Haloragidaceae resulting in a 4‐kb inversion. The ribbons represent partial of the chloroplast genome, and the genes are colored in purple. (b) Chronogram of Haloragaceae predicts and estimates the origin of the 4‐kb inversion under a Bayesian relaxed clock model by using of the combined ITS, matK, trnK, rpoB‐trnE, and trnC‐trnT matrix. Gray colored bars at nodes indicate the 95% credibility intervals of age estimates. The numbers near the nodes refer to the node age. Red asterisks highlight the 4‐kb inversion rearrangement event
4. DISCUSSION
In this study, the complete cp genome of M. spicatum was assembled, and it possesses the typical angiosperm quadripartite structure with two short inverted repeat regions separated by two single copy regions. The length of the IR regions of M. spicatum is similar to that of other Saxifragales species, and the genome size of the cp genome of the Saxifragales species investigated here only varied slightly, ranging from 152,698 to 160,410 bp. These results suggest that genomic length variation can be found in the LSC and SSC boundary regions, as reported for other species (Zhao et al., 2018). Only the ycf1 pseudogene was detected across the SSC/IRa border in the five Saxifragales species, which might be caused by a duplication of the normally single copy gene ycf1. No stop codons were detected in the coding sequence of ycf1; thus, we hypothesize that the expansion of the IR was caused by a duplication of ycf1, which occurred in the common ancestor of these species in Saxifragales.
Based upon the alignment of the plastomes from five Saxifragales species, the gene contents were almost identical. Most variations were detected in intergenic regions yet are also highly variable in coding regions such as ycf1, rps16, ndhA, and accD. These highly variable regions may be useful as specific DNA barcodes for species‐level identification, as well as provide genetic markers for resolving relationships among Saxifragales. Over 260 SSRs were identified in this study, which could be candidates for future inferences on population genetics and help to trace the origin of invasive populations (Provan et al., 2001). Moreover, these SSR markers could be used for genetic diversity studies on closely related species in Haloragaceae.
Normally, plastomic rearrangements in flowering plants are rare (Mower et al., 2018). Most photosynthetic angiosperms have a highly conserved plastome organization, except a small number of groups among major lineages, especially the Campanulaceae, Fabaceae, and Geraniaceae, which exhibit remarkable and extensive rearrangements (Jansen & Ruhlman, 2012; Mower & Vickrey, 2018)). In this article, a 4‐kb inversion was identified in all Myriophyllum species sampled and therefore likely provides an informative marker that highlights an additional synapomorphy supporting the monophyly of Myriophyllum. Moreover, the activity of repetitive elements has often been considered to be associated with plastome rearrangement and recombination (Lu et al., 2017; Weng, Blazier, Govindu, & Jansen, 2013). Regarding the trnE‐trnC inversion in Myriophyllum, a flip‐flop recombination event might have contributed to its occurrence (Figure 8a). This detectable rearrangement of sequences has occurred during the evolution of Myriophyllum, possibly playing an important role in the maintenance of the structural stability of the chloroplast genome (Palmer & Thompson, 1982; Wolfe, Li, & Sharp, 1987).
The 4‐kb inversion was detected in G. micranthus, a species in a genus closely related to Myriophyllum (Chen et al., 2014). Our results are congruent with the previous phylogenetic analysis among families of Saxifragales (Jian et al., 2008; Moody & Les, 2010; Dong, Xu, Cheng, Lin, et al., 2013; Dong, Xu, Cheng, & Zhou, 2013). The 4‐kb inversion was identified in all of the included Myriophyllum species and the Gonocarpus taxa; thus, the 4‐kb inversion might originate after the split of Haloragaceae and Penthoraceae but before the divergence of Myriophyllum and Gonocarpus. The molecular dating calibrated by fossil records indicated that Myriophyllum and Gonocarpus separated approximately 47 MYA, and the Myriophyllum‐Gonocarpus clade diverged approximately 72 MYA in Saxifragales. Based on historical biogeography analysis of Haloragaceae (Chen et al., 2014), our study indicated that this 4‐kb inversion was likely shared by a majority of clades in Haloragaceae (including almost three quarters of the species in Haloragaceae) before the earliest diversification of this family. A clustering of angiosperm paleopolyploidizations occurred around the Cretaceous–Paleogene (K–Pg) extinction event about 66 million years ago based on dated genome data (Vanneste, Baele, Maere, & Yves, 2014). Thus, we speculate that the 4‐kb inversion might be caused by an occurrence of nonrandom recombination associated with climate changes around the K–Pg boundary (Kaiho et al., 2016; Vellekoop et al., 2015). Additional whole chloroplast genome sequences from species in Haloragaceae should be obtained to construct larger phylogenetic trees to further test this presumption. In addition, more functional investigations are also needed to provide a more comprehensive understanding of divergence history and the influence of climate change on the novel 4‐kb inversion.
CONFLICT OF INTEREST
The authors declare no conflict interest.
AUTHOR CONTRIBUTIONS
TW and FL designed the study and modified manuscript. FL and YYL conducted the sequence analyses and drafted the manuscript. YL and RWM performed the experiments and analyzed the data. XL and TFL collected the samples. All authors read and approved the final manuscript.
Supporting information
ACKNOWLEDGMENTS
This study was supported by the Strategic Priority Research Program of Chinese Academy of Sciences (Grant No. XDB31010104) and the National Natural Scientific Foundation of China (31500457, 31870206 and 31670369).
Liao Y‐Y, Liu Y, Liu X, et al. The complete chloroplast genome of Myriophyllum spicatum reveals a 4‐kb inversion and new insights regarding plastome evolution in Haloragaceae. Ecol Evol. 2020;10:3090–3102. 10.1002/ece3.6125
Funding information
This study was financially supported by the Strategic Priority Research Program of the Chinese Academy of Sciences (Grant No. XDB31010104) and the National Natural Scientific Foundation of China (31500457, 31870206, 31670369).
Contributor Information
Tao Wan, Email: wantao1983@gmail.com.
Fan Liu, Email: fanliu@wbgcas.cn.
DATA AVAILABILITY STATEMENT
The complete chloroplast genome of Myriophyllum spicatum has been deposited in GenBank (Accession Number: MK250869).
REFERENCES
- Chen, L. Y. , Zhao, S. Y. , Mao, K. S. , Les, D. H. , Wang, Q. F. , & Moody, M. (2014). Historical biogeography of Haloragaceae: An out‐of‐Australia hypothesis with multiple intercontinental dispersals. Molecular Phylogenetics & Evolution, 78(1), 87–95. 10.1016/j.ympev.2014.04.030 [DOI] [PubMed] [Google Scholar]
- Chumley, T. W. , Palmer, J. D. , Mower, J. P. , Fourcade, H. M. , Calie, P. J. , Boore, J. L. , & Jansen, R. K. (2006). The complete chloroplast genome sequence of Pelargonium x hortorum: Organization and evolution of the largest and most highly rearranged chloroplast genome of land plants. Molecular Biology & Evolution, 23(11), 2175–2190. 10.1093/molbev/msl089 [DOI] [PubMed] [Google Scholar]
- Conant, G. C. , & Wolfe, K. H. (2008). Genomevx: Simple web‐based creation of editable circular chromosome maps. Bioinformatics, 24(6), 861–862. 10.1093/bioinformatics/btm598 [DOI] [PubMed] [Google Scholar]
- Cronk, J. K. , & Fennessy, M. S. (2001). Wetland plants: Biology and ecology. Boca Raton, FL: Lewis Publishers. [Google Scholar]
- Daniell, H. , Lin, C. S. , Yu, M. , & Chang, W. J. (2016). Chloroplast genomes: Diversity, evolution, and applications in genetic engineering. Genome Biology, 17(1), 134 10.1186/s13059-016-1004-2 [DOI] [PMC free article] [PubMed] [Google Scholar]
- Darling, A. C. E. , Mau, B. , Blattner, F. R. , & Perna, A. N. T. (2004). Mauve: Multiple alignment of conserved genomic sequence with rearrangements. Genome Research, 14(7), 1394–1403. 10.1101/gr.2289704 [DOI] [PMC free article] [PubMed] [Google Scholar]
- Dong, W. , Xu, C. , Cheng, T. , Lin, K. , & Zhou, S. (2013). Sequencing angiosperm plastid genomes made easy: A complete set of universal primers and a case study on the phylogeny of Saxifragales. Genome Biology & Evolution, 5(5), 989–997. 10.1093/gbe/evt063 [DOI] [PMC free article] [PubMed] [Google Scholar]
- Dong, W. P. , Xu, C. , Cheng, T. , & Zhou, S. L. (2013). Complete chloroplast genome of Sedum sarmentosum and chloroplast genome evolution in Saxifragales. PLoS ONE, 8(10), e77965 10.1371/journal.pone.0077965 [DOI] [PMC free article] [PubMed] [Google Scholar]
- Doorduin, L. , Gravendeel, B. , Lammers, Y. , Ariyurek, Y. , Chin‐A‐Woeng, T. , & Vrieling, K. (2011). The complete chloroplast genome of 17 individuals of pest species Jacobaea vulgaris: SNPs, microsatellites and barcoding markers for population and phylogenetic studies. DNA Research, 18(2), 93–105. 10.1093/dnares/dsr002 [DOI] [PMC free article] [PubMed] [Google Scholar]
- Doyle, J. J. , Davis, J. I. , Soreng, R. J. , Garvin, D. , & Anderson, M. J. (1992). Chloroplast DNA inversions and the origin of the grass family (Poaceae). Proceedings of the National Academy of Sciences of the United States of America, 89(16), 7722–7726. 10.1073/pnas.89.16.7722 [DOI] [PMC free article] [PubMed] [Google Scholar]
- Drummond, A. J. , & Rambaut, A. (2007). Beast: Bayesian evolutionary analysis by sampling trees. BMC Evolutionary Biology, 7(1), 214 10.1186/1471-2148-7-214 [DOI] [PMC free article] [PubMed] [Google Scholar]
- Frazer, K. A. , Pachter, L. , Poliakov, A. , Rubin, E. M. , & Dubchak, I. (2004). Vista: Computational tools for comparative genomics. Nucleic Acids Research, 32, W273–279. 10.1093/nar/gkh458 [DOI] [PMC free article] [PubMed] [Google Scholar]
- Hernandez‐Castillo, G. R. , & Cevallos‐Ferriz, S. R. S. (1999). Reproductive and vegetative organs with affinities to Haloragaceae from the Upper Cretaceous Huepac Chert Locality of Sonora, Mexico. American Journal of Botany, 86(12), 1717 10.2307/2656670 [DOI] [PubMed] [Google Scholar]
- Huelsenbeck, J. P. , & Rannala, B. (1997). Phylogenetic methods come of age: Testing hypotheses in an evolutionary context. Science, 276, 227–232. 10.1126/science.276.5310.227 [DOI] [PubMed] [Google Scholar]
- Huelsenbeck, J. P. , & Ronquist, F. (2001). Mrbayes: Bayesian inference of phylogenetic trees. Bioinformatics, 17(8), 754–755. 10.1093/bioinformatics/17.8.754 [DOI] [PubMed] [Google Scholar]
- Jansen, R. K. , & Ruhlman, T. A. (2012). Plastid genomes of seed plants. Genomics of chloroplasts and mitochondria. Dordrecht, The Netherlands: Springer. [Google Scholar]
- Jian, S. G. , Soltis, P. S. , Gitzendanner, M. A. , Moore, M. J. , Li, R. , Hendry, T. A. , … Soltis, D. E. (2008). Resolving an ancient, rapid radiation in Saxifragales. Systematic Biology, 57, 38–57. 10.1080/10635150801888871 [DOI] [PubMed] [Google Scholar]
- Kaiho, K. , Oshima, N. , Adachi, K. , Adachi, Y. , Mizukami, T. , Fujibayashi, M. , & Saito, R. (2016). Global climate change driven by soot at the K‐Pg boundary as the cause of the mass extinction. Scientific Reports, 6, 28427 10.1038/srep28427 [DOI] [PMC free article] [PubMed] [Google Scholar]
- Katoh, K. , & Standley, D. M. (2013). MAFFT multiple sequence alignment Software Version 7: Improvements in performance and usability. Molecular Biology & Evolution., 30, 772–780. 10.1093/molbev/mst010 [DOI] [PMC free article] [PubMed] [Google Scholar]
- Kearse, M. , Moir, R. , Wilson, A. , Stones‐Havas, S. , Cheung, M. , Sturrock, S. , … Drummond, A. (2012). Geneious Basic: An integrated and extendable desktop software platform for the organization and analysis of sequence data. Bioinformatics, 28, 1647–1649. 10.1093/bioinformatics/bts199 [DOI] [PMC free article] [PubMed] [Google Scholar]
- Kim, K. J. , Choi, K. S. , & Jansen, R. K. (2005). Two chloroplast dna inversions originated simultaneously during the early evolution of the sunflower family (Asteraceae). Molecular Biology & Evolution, 22(9), 1783–1792. 10.1093/molbev/msi174 [DOI] [PubMed] [Google Scholar]
- Kurtz, S. , Choudhuri, J. V. , Ohlebusch, E. , Schleiermacher, C. , Stoye, J. , & Giegerich, R. (2001). Reputer: The manifold applications of repeat analysis on a genomic scale. Nucleic Acids Research, 29(22), 4633–4642. 10.1093/nar/29.22.4633 [DOI] [PMC free article] [PubMed] [Google Scholar]
- Li, J. , Wang, S. , Yu, J. , & Wang, L. (2013). A modified CTAB protocol for plant DNA extraction. Chinese Bulletin of Botany, 48(1), 72–78. 10.3724/SP.J.1259.2013.00072 [DOI] [Google Scholar]
- Lu, L. , Li, X. , Hao, Z. , Yang, L. , Zhang, J. , Peng, Y. , … Cheng, T. L. (2017). Phylogenetic studies and comparative chloroplast genome analyses elucidate the basal position of halophyte Nitraria sibirica (Nitrariaceae) in the sapindales. Mitochondrial DNA. Part A: DNA Mapping Sequencing & Analysis, 29, 745–755. 10.1080/24701394.2017.1350954 [DOI] [PubMed] [Google Scholar]
- Moody, M. L. , & Les, D. H. (2007). Phylogenetic systematics and character evolution in the angiosperm family Haloragaceae. American Journal of Botany, 94(12), 2005–2025. 10.3732/ajb.94.12.2005 [DOI] [PubMed] [Google Scholar]
- Moody, M. L. & Les, D. H. (2010). Systematics of the aquatic angiosperm genus Myriophyllum (Haloragaceae). Systematic Botany, 35(1), 121–139. 10.1600/036364410790862470 [DOI] [Google Scholar]
- Mower, J. P. , Ma, P. F. , Grewe, F. , Taylor, A. , Michael, T. P. , VanBuren, R. , & Qiu, Y. L. (2018). Lycophyte plastid genomics: Extreme variation in GC, gene and intron content and multiple inversions between a direct and inverted orientation of the rRNA repeat. New Phytologist, 222, 1061–1075. 10.1111/nph.15650 [DOI] [PMC free article] [PubMed] [Google Scholar]
- Mower, J. P. , & Vickrey, T. L. (2018). Structural diversity among plastid genomes of land plants In Chaw S.‐M. & Jansen R. K. (Eds.), Advances in botanical research (Vol. 85, pp. 263–292). Cambridge, MA: Academic Press; 10.1016/bs.abr.2017.11.013 [DOI] [Google Scholar]
- Nylander, J. A. A. (2004). MrModeltest v2. Program distributed by the author. Evolutionary Biology Centre, Uppsala University. [Google Scholar]
- Palmer, J. D. , & Thompson, W. F. (1982). Chloroplast DNA rearrangements are more frequent when a large inverted repeat sequence is lost. Cell, 29(2), 537–550. 10.1016/0092-8674(82)90170-2 [DOI] [PubMed] [Google Scholar]
- Peredo, E. L. , King, U. M. , & Les, D. H. (2013). The plastid genome of Najas flexilis: Adaptation to submersed environments is accompanied by the complete loss of the ndh complex in an aquatic angiosperm. PLoS ONE, 8, e68591 10.1371/journal.pone.0068591 [DOI] [PMC free article] [PubMed] [Google Scholar]
- Philippe, H. , & Roure, B. (2011). Difficult phylogenetic questions: More data, maybe; better methods, certainly. BMC Biology, 9(1), 1–4. 10.1186/1741-7007-9-91 [DOI] [PMC free article] [PubMed] [Google Scholar]
- Posada, D. , & Crandall, K. A. (1998). Modeltest: Testing the model of DNA substitution. Bioinformatics, 14(9), 817–818. 10.1093/bioinformatics/14.9.817 [DOI] [PubMed] [Google Scholar]
- Provan, J. , Powell, W. , & Hollingsworth, P. M. (2001). Chloroplast microsatellites: New tools for studies in plant ecology and evolution. Trends in Ecology & Evolution, 16(3), 142–147. 10.1016/S0169-5347(00)02097-8 [DOI] [PubMed] [Google Scholar]
- Schattner, P. , Brooks, A. N. , & Lowe, T. M. (2005). The tRNAscan‐SE, snoscan and snoGPS web servers for the detection of tRNAs and snoRNAs. Nucleic Acids Research, 33(Web Server issue), 686–689. 10.1093/nar/gki366 [DOI] [PMC free article] [PubMed] [Google Scholar]
- Sculthorpe, C. D. (1967). The biology of aquatic vascular plants. London, UK: Edward Arnold Ltd. [Google Scholar]
- Stamatakis, A. (2006). Raxml‐vi‐hpc: Maximum likelihood‐based phylogenetic analyses with thousands of taxa and mixed models. Bioinformatics, 22(21), 2688–2690. 10.1093/bioinformatics/btl446 [DOI] [PubMed] [Google Scholar]
- Swofford, D. (2002). PAUP* 4.0: Phylogenetic analysis using parsimony. Sunderland, MA: Sinauer Associates. [Google Scholar]
- Tamura, K. , Stecher, G. , Peterson, D. , Filipski, A. , & Kumar, S. (2013). Mega6: Molecular evolutionary genetics analysis version 6.0. Molecular Biology & Evolution, 30(12), 2725–2729. 10.1093/molbev/mst197 [DOI] [PMC free article] [PubMed] [Google Scholar]
- Thiel, T. , Michalek, W. , Varshney, R. , & Graner, A. (2003). Exploiting EST databases for the development and characterization of gene‐derived SSR‐markers in barley (Hordeum vulgare L.). Theoretical & Applied Genetics, 106(3), 411–422. 10.1007/s00122-002-1031-0 [DOI] [PubMed] [Google Scholar]
- Thum, R. A. , Zuellig, M. P. , Johnson, R. L. , Moody, M. L. , & Vossbrinck, C. (2011). Molecular markers reconstruct the invasion history of variable leaf watermilfoil (Myriophyllum heterophyllum) and distinguish it from closely related species. Biological Invasions, 13(7), 1687–1709. 10.1007/s10530-010-9927-0 [DOI] [Google Scholar]
- Vanneste, K. , Baele, G. , Maere, S. , & Yves, V. D. P. (2014). Analysis of 41 plant genomes supports a wave of successful genome duplications in association with the Cretaceous‐Paleogene boundary. Genome Research, 24(8), 1334–1347. 10.1101/gr.168997.113 [DOI] [PMC free article] [PubMed] [Google Scholar]
- Vellekoop, J. , Smit, J. , van de Schootbrugge, B. , Weijers, J. W. , Galeotti, S. , Damste, J. S. S. , & Brinkhuis, H. (2015). Palynological evidence for prolonged cooling along the Tunisian continental shelf following the K‐Pg boundary impact. Palaeogeography, Palaeoclimatology, Palaeoecology, 426, 216–228. 10.1130/G37961.1 [DOI] [Google Scholar]
- Weng, M. L. , Blazier, J. C. , Govindu, M. , & Jansen, R. K. (2013). Reconstruction of the ancestral plastid genome in Geraniaceae reveals a correlation between genome rearrangements, repeats and nucleotide substitution rates. Molecular Biology & Evolution, 31(3), 645–659. 10.1093/molbev/mst257 [DOI] [PubMed] [Google Scholar]
- Wicke, S. , Schneeweiss, G. M. , Depamphilis, C. W. , Müller, K. F. , & Quandt, D. (2011). The evolution of the plastid chromosome in land plants: Gene content, gene order, gene function. Plant Molecular Biology, 76(3–5), 273–297. 10.1007/s11103-011-9762-4 [DOI] [PMC free article] [PubMed] [Google Scholar]
- Wolfe, K. H. , Li, W. H. , & Sharp, P. M. (1987). Rates of nucleotide substitution vary greatly among plant mitochondrial, chloroplast, and nuclear DNAs. Proceedings of the National Academy of Sciences of the United States of America, 84(24), 9054–9058. 10.1073/pnas.84.24.9054 [DOI] [PMC free article] [PubMed] [Google Scholar]
- Wyman, S. K. , Jansen, R. K. , & Boore, J. L. (2004). Automatic annotation of organellar genomes with dogma. Bioinformatics, 20(17), 3252–3255. 10.1093/bioinformatics/bth352 [DOI] [PubMed] [Google Scholar]
- Yang, Z. (2007). Paml 4: Phylogenetic analysis by maximum likelihood. Molecular Biology and Evolution, 24(8), 1586–1591. 10.1093/molbev/msm088 [DOI] [PubMed] [Google Scholar]
- Zhao, J. , Xu, Y. , Xi, L. , Yang, J. , Chen, H. , & Zhang, J. (2018). Characterization of the Chloroplast Genome Sequence of Acer miaotaiense: Comparative and Phylogenetic Analyses. Molecules, 23(7), 1740 10.3390/molecules23071740 [DOI] [PMC free article] [PubMed] [Google Scholar]
- Zhou, Z. K. , Crepet, W. L. , & Nixon, K. C. (2001). The earliest fossil evidence of the Hamamelidaceae: Late Cretaceous (Turonian) Inflorescences and fruits of Altingioideae. American Journal of Botany, 88(5), 753–766. 10.2307/2657028 [DOI] [PubMed] [Google Scholar]
Associated Data
This section collects any data citations, data availability statements, or supplementary materials included in this article.
Supplementary Materials
Data Availability Statement
The complete chloroplast genome of Myriophyllum spicatum has been deposited in GenBank (Accession Number: MK250869).