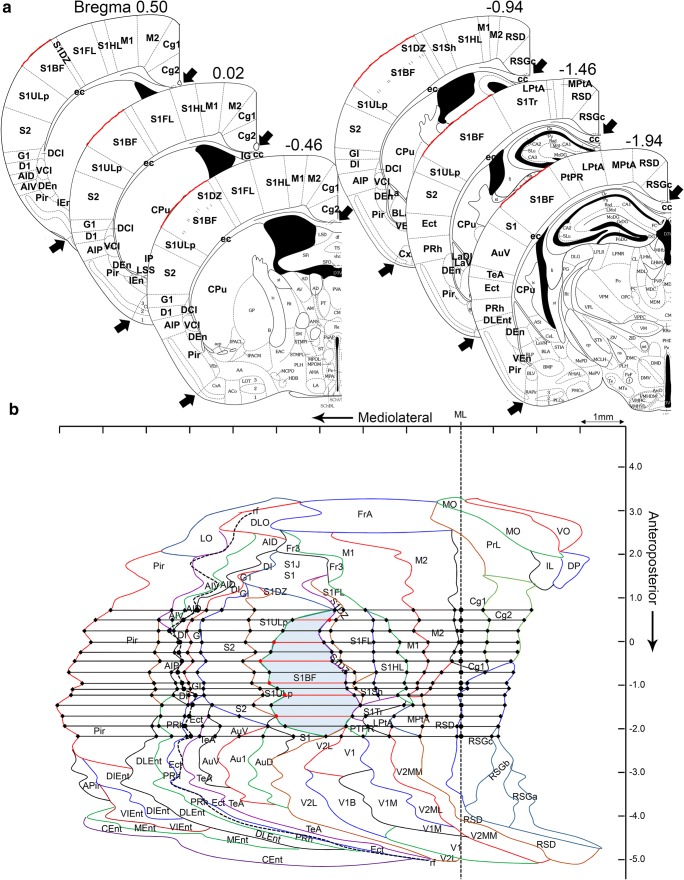
Fig. 1.
Template of the unfolded mouse cortex. Forty coronal plates between anteroposterior coordinates +3.20 to −4.96 with bregma as reference were used. On each atlas plate, the length of the outer boundary of each cortical region was measured along the brain surface, from the point of the midline where the cortex meets the corpus callosum (upper arrowhead) to the lateral edge of the piriform cortex (lower arrowhead). (a) Example of a measurement in the S1 cortex (red line) at different anteroposterior coordinates. (b) Measurement of the different cortical areas was transferred to a PowerPoint (see details in Methods). The points indicating the beginning and end of each cortical area on successive plates were connected to reveal the area boundaries as indicated here with the S1BF. The red line indicates measurements from the atlas plates in (A). Not that the rhinal fissure (rh) is depicted as dashed line and the Midline (ML)

