

Abstract
Sterile alpha and toll/interleukin receptor (TIR) motif–containing protein 1 (SARM1) plays a pivotal role in triggering the neurodegenerative processes that underlie peripheral neuropathies, traumatic brain injury, and neurodegenerative diseases. Importantly, SARM1 knock down or knock out prevents degeneration, thereby demonstrating that SARM1 is a promising therapeutic target. Recently, SARM1 was shown to promote neurodegeneration via its ability to hydrolyze NAD+, forming nicotinamide and ADP ribose (ADPR). Herein, we describe the initial kinetic characterization of full length SARM1, as well as the truncated constructs corresponding to the SAM1−2TIR and TIR domains, highlighting the distinct challenges that have complicated efforts to characterize this enzyme. Moreover, we show that bacterially expressed full length SARM1 (kcat/KM = 6000 ± 2000 M−1s−1) is at least as active as the TIR domain alone (kcat/KM = 1500 ± 300 M−1s−1). Finally, we show that the SARM1 hydrolyzes NAD+ via an ordered uni–bi reaction in which nicotinamide is released prior to ADPR.
Graphical Abstract

INTRODUCTION
Progressive axonal degeneration defines numerous diseases, including neuropathies, traumatic brain injury, and neurodegenerative diseases (e.g., Alzheimer’s disease, Parkinson’s disease, and Huntington’s disease).1–3 These diseases are often referred to as Wallerian–like because neuronal death is morphologically and mechanistically similar to Wallerian degeneration.4–6 Wallerian degeneration is the process by which stress or injury triggers microtubule and neurofilament breakdown, resulting in granular disintegration of the distal axonal cytoskeleton.4
This cell death program was long thought to occur passively, however, the discovery of the murine Wallerian degeneration slow (WLDS) mutant challenged this notion; these mutant mice display delayed degeneration in response to insult or injury.7, 8 The molecular basis of neuroprotection stems from the fact that the WLDS mutant mislocalizes nicotinamide mononucleotide adenylyl transferase 1 (NMNAT1) from the nucleus to the cytosol of neurons where it substitutes for NMNAT2, the only cytosolic NMNAT isozyme. NMNAT2 is degraded in response to injury and the consequent decline in NAD+ levels are a precursor of cell death. By contrast, the WLDS mutant mice are protected by maintaining cytosolic NAD+ levels.9–11
The subsequent discovery of SARM1 (Sterile alpha and toll/interleukin receptor (TIR) motif–containing protein 1) confirmed that Wallerian degeneration is an active process.10 SARM1 was originally identified as one of five toll interleukin receptor (TIR) adaptor proteins in humans and later found to function as an NAD+ hydrolase, generating nicotinamide and a mixture of ADP ribose (ADPR) and cyclic ADP ribose (cADPR) (Figure 1A).11, 12 The opposing roles of SARM1 and NMNAT highlight the critical role that NAD+ plays in regulating Wallerian degeneration. More specifically, increased NMNAT activity/NAD+ synthesis is associated with resistance to neuronal degeneration, whereas upregulated SARM1 activity/NAD+ cleavage increases cell death.
Figure 1. Enzymatic Reaction and Domain Structure of SARM1.

(A) The enzymatic reactions catalyzed by SARM1. (B) The domain architecture of full length SARM1 (80 kDa), SAM1−2TIR (35 kDa), and TIR constructs (25 kDa) used in this study.
SARM1 is comprised of an N–terminal armadillo/HEAT repeat (ARM), two sterile alpha motif (SAM) domains, and a C–terminal TIR domain that encodes the catalytic subunit (Figure 1B). The ARM domain is believed to autoinhibit SARM1 activity via an unknown mechanism.13 Injury or disease, relieves this autoinhibition allowing for oligomerization of the SAM domains, which facilitates dimerization of the TIR domains and increased NAD+ hydrolysis.14
Notably, loss of SARM1 protects axons against neurodegeneration associated with axonomy, traumatic brain injury, and vincristine–induced peripheral neuropathy in both cells and animal models.10, 15–17 These findings highlight SARM1 as a potential target for treating these disease types, yet little is known about its NAD+ hydrolase activity. Herein, we describe the initial kinetic characterization of full length SARM1 as well as constructs corresponding to the SAM1−2TIR and TIR domains. Moreover, we show that SARM1 hydrolyzes NAD+ via an ordered uni–bi reaction in which nicotinamide is released prior to ADPR. These data as well as our in-depth description of the challenges associated with studying this enzyme will be broadly useful for the development of SARM1 inhibitors.
METHODS
Key Resources and Expression Constructs.
Proteins used in these studies are listed in Table 1. Key resources, including reagents, kits, and oligonucleotide primers are summarized in Table S1. A codon optimized SARM1 construct was generated by custom synthesis (Genscript) (Figure S1A). This construct encodes the full length human SARM1 gene bound by a twin N–terminal Strep tag and a C–terminal hexa–histidine tag. The gene was inserted between the NdeI and XhoI restriction digest sites in the IPTG–inducible pET30a+ vector (Figure S1B). Constructs that express the SAM1–2TIR domains (residues 412 – 724) and TIR domain only (residues 561 – 724) were generated by PCR mutagenesis (Figure 1B). Constructs were generated with only the twin–strep tag and with both the twin strep and hexa–histidine tags. To remove the hexa–histidine tag, a stop codon was inserted prior to the tag. SAM1–2TIR and TIR domain constructs were generated by excising the required region from the full length construct using the following PCR protocol: (1) initial denaturation at 95 ˚C for 10 min, (2) denaturation 95 ˚C for 1:30 min, (3) annealing for 45 s 65 – 67 ˚C, (4) extension 68 ˚C 6 min and (5) final extension 68 ˚C for 10 min. Steps 2–4 were repeated 30 times. This protocol was performed using NEBNext® 2X PCR Master Mix, which contains the Q5 high fidelity polymerase, deoxynucleotides, and 2 mM Mg. Template DNA (2 ng/μL) and primers (0.5 μM final; Table S1) were combined with 1x NEBNext® Master Mix. The entire construct was sequenced (Genewiz) to ensure that no mutations were introduced during the PCR process.
Table 1.
Proteins of Interest
For the C. elegans constructs (Figure S2A), the full length Tir–1a sequence was obtained from Wormbase and generated by custom synthesis (Genscript). To make the truncated ceSAMTIR (residues 557 – 850) and ceTIR (residues 707 – 850) constructs (Figure S2B), the domains of interest were amplified by PCR using primers that contain BamH1 and XhoI cut sites (Table S1) and the master mix composition described above. The PCR protocol for ceTIR was (1) 1 min at 98 ˚C, (2) 30 s at 98 ˚C, (3) 45 s at 54 – 56 ˚C, (4) 1 min at 68 ˚C and (5) 5 min at 68 ˚C and for ceSAMTIR was (1) 1 min at 98 ˚C, (2) 30 s at 98 ˚C, (3) 45 s at 58.8 – 60.8 ˚C, (4) 90 s at 72 ˚C and (5) 5 min at 72 ˚C. Steps 2–4 were repeated 30 times. The PCR products were purified (Qiagen Purification Kit) and digested with 40 units of BamHI and XhoI (NEB) in Cutsmart buffer for 1 h at 37 ˚C. Post–gel extraction (Qiagen Kit) and phosphorylation with T4 PNK (NEB), the insert was ligated into the empty pET30a+ vector (Table S1B) at 1:3 and 1:10 molar ratios of vector: insert at 16 ˚C overnight.
Protein Expression and Purification.
The desired constructs were transformed into chemically competent Escherichia coli C43 (DE3) cells and plated on LB agar plates containing 50 μg/mL kanamycin and grown overnight at 37 ˚C. The C. elegans constructs were grown in BL21 (DE3) cells. Colonies were selected from the plates, immersed in LB media and grown overnight at 37 ˚C. These starter cultures were diluted 400–fold in 2 L of LB containing 50 μg/mL kanamycin and grown at 37 ˚C while shaking at 225 rpm until the culture reached an OD600 of 0.8. Protein expression was then induced via the addition IPTG (0.5 mM) and the temperature was reduced to 16 ˚C overnight. Cells were pelleted by centrifugation at 3,000 × g for 15 min at 4 ˚C. The supernatant was removed, and the pellet was resuspended in lysis buffer (100 mM NaH2PO4 pH 8.0, 200 mM NaCl, 10 % glycerol, 0.01% Tween 20) with Pierce™ EDTA–free protease inhibitor tablets (Thermo Scientific). The lysate was incubated with 100 μg/mL lysozyme for 10 min on ice and then sonicated at an amplitude of 6 for 30 s oscillating for 1 s on and 1 s off for a series of 12 replicates using a Fisher Scientific Sonic Dismembrator sonicator (FB–705). When applicable, the lysate was clarified by centrifugation at 15,000 × g for 25 min at 4 ˚C. The clarified lysate was applied to pre–equilibrated Streptacin XT resin. The resin was then washed with Wash Buffer (50 mM HEPES pH 8.0 and 500 mM NaCl). SARM1 was eluted with Wash Buffer containing 50 mM biotin. When applicable, the eluent was concentrated and injected on a HiLoad Superdec 200 pg column for size exclusion chromatography using 20 mM HEPES pH 8.0 with 150 mM NaCl as the mobile phase. Protein concentration was determined using the Bradford assay.
For the dual tagged TIR domain construct and the C. elegans ortholog, the Streptacin XT eluate was incubated with Co–NTA resin for 30 min at 4 ˚C. The resin was rinsed with Wash Buffer with increasing amounts of imidazole (50, 75, 100), and then with Wash Buffer containing 200 mM imidazole to release SARM1 or ceSARM1 from the resin. The elution was dialyzed overnight at 4 ˚C into 50 mM NaH2PO4 pH 8.0 plus 300 mM NaCl.
Concentration of SARM1 in Lysates.
SARM1 concentration in lysates was quantified by western blotting (Figure S1C). Briefly, serial dilutions of the purified TIR domain (0 – 2 μM) were separated by SDS–PAGE and subjected to western blotting. Lysates (1:40 dilutions at least in duplicate) were separated on the same gel. Proteins were then transferred to a nitrocellulose membrane for 1 h at 80 V. The membrane was blocked with 5% BSA at RT for 30 min prior to incubation with streptavidin IR Dye 630RD at 1:10,000 dilution for 1 h at RT. The blot was washed twice with PBS for 10 min and then once with water for 10 min prior to imaging. The Western blot was imaged using a Licor Odyssey Imaging System. The imager software was used to quantify the intensity of the bands and generate standard curves (R2 = 0.99), which were used to determine the concentration of SARM1 in the lysates.
Fluorescent Assay.
A continuous fluorescent assay was applied to monitor SARM1 activity. This assay employs an NAD+ analog, Nicotinamide 1, N6–ethenoadenine dinucleotide (ENAD), which fluoresces upon ENAD hydrolysis (λex= 330 nm, λem= 405 nm).18–20 Enzymatic reactions were performed in Reaction Buffer (50 mM NaH2PO4 pH 8.0 with 50 mM NaCl) using 96–well Corning® Half Area Black Flat Bottom Polystrene NBS™ plates with a final volume of 60 μL. Reactions were initiated by the addition of a 10x stock solution of ENAD. Enzymatic assays were generally carried out at a fixed concentration of SARM1 (300 nM) unless otherwise noted. For quantification of the fluorescent signal, serial dilutions of etheno–ADPR (EADPR) (0–400 μM) were used to generate a standard curve. EADPR was generated by treating fixed concentrations of ENAD (0–400 μM) with excess ADPR cyclase (Sigma Aldrich #A9106) and allowing the reaction to go to completion as evidenced by a plateau in the fluorescence over time graph. When applicable, 10x stock solutions of inhibitors were diluted in Reaction Buffer with 300 nM SARM1 and incubated at RT for ten min prior to initiating the reaction with ENAD. EADPR fluorescence (λex= 330 nm, λem= 405 nm) was detected in real time at 15 s intervals for 15 min using a PerkinElmer EnVision 2104 Multilabel Reader in conjunction with Wallac EnVision Manager software. Activity was linear with respect to time and enzyme concentration under these conditions.
Assays with Purified SARM1.
SARM1 was purified as described above and concentrated to ~60 μM with an Amicon 10 kDa cutoff centrifugal filter. Protein concentration was determined with the Bradford assay. SARM1 (20 μM) in Reaction Buffer was incubated with ENAD and the activity was measured using the fluorescent assay described above.
Initial Fluorescent Assay Optimization.
To identify the optimal enzyme concentration, SARM1 concentration in lysates was varied from 50 – 600 nM at a fixed concentration of ENAD (100 μM). To determine an optimal pH for the assay, buffer stocks (4x) were prepared at 200 mM and 1.2 M NaCl. The following buffers were used: Sodium Acetate pH 5.5, MES pH 6.0, Imidazole pH 6.5, MOPS pH 7.0, HEPES pH 7.5, HEPES pH 8.0, CHES pH 9.0. The 4x buffer stocks were diluted with water and lysate for a final concentration of 50 mM buffer and 300 mM NaCl. Assays were performed in triplicate. The final SARM1 concentration was 300 nM. Reactions were initiated by the addition of 200 μM ENAD.
To evaluate the effect of reducing agents, 100 mM stocks of dithiothreitrol (DTT) and tris(2–carboxyethyl)phosphine (TCEP) were prepared. Reactions were initiated by the addition of 100 μM ENAD to Reaction Buffer containing increasing concentrations of reducing agent (0 – 2 mM). To determine if divalent metals or the lack of metals, possess activating or inhibitory effects, we evaluated the impact of CaCl2, CdCl2, CoCl2, CuCl2, MgCl2, MnCl2, NiCl2, ZnCl2, and ethylenediaminetetraacetic acid (EDTA) on SARM1 activity. The reactions were performed with 300 nM SARM1 in Reaction Buffer containing 2 mM metals or EDTA and initiated by the addition of 200 μM ENAD. For all these assays, the fluorescence was recorded as a function of time to quantify the rate of EADPR production. To determine the potency of NiCl2 and ZnCl2 inhibition, the metals were varied from 0 – 4 mM and 0 – 2 mM, respectively. Activity relative to a no metal control was quantified and fit to equation 1,
| (1) |
using the GraphPad Prism software package to generate IC50 values. [I] is the concentration of inhibitor, IC50 is concentration of the inhibitor at half the maximum enzymatic activity, and fractional activity of SARM1 is the percent activity at the respective inhibitor concentration.
Determination of SARM1 Steady State Kinetic Parameters.
The steady state kinetic parameters were determined using the fluorescent ENAD assay and a novel luminescent assay (see below). For the fluorescent assay, the SARM1 TIR domain was incubated in Reaction Buffer at a concentration of 300 nM with ENAD (0 – 400 μM) for 15 min and readings were taken every 15 s (λex= 330 nm, λem= 405 nm). The fluorescence produced over time was converted to EADPR via an EADPR standard curve. The slopes of these progress curves (EADPR produced/min) yielded the velocity at each ENAD concentration. These initial velocities were then fit to the Michaelis Menten equation (eq. 2),
| (2) |
using the GraphPad Prism software package. Vmax is the maximum velocity, [S] is the concentration of substrate, and Km is the substrate concentration at half the maximum velocity. The steady state kinetic parameters were similarly determined for the SAM1–2TIR construct and full length SARM1, as well as full length Tir1 (the C. elegans ortholog of SARM1, ceSARM), C. elegans SAM1–2TIR (ceSAMTIR), and TIR (ceTIR) proteins.
Luminescent Assay.
To determine the steady state kinetic parameters for NAD+ hydrolysis, we developed a luminescent assay that exploits the nicotinamide N–methyl transferase (NNMT) catalyzed methylation of nicotinamide to couple SARM1 cleavage of NAD+ to the production of S–adenosylhomocysteine (SAH). SAH levels are then quantified using a commercially available methyltransferase kit (MTase–Glo™ Methyltransferase assay). Briefly, in this novel assay, SARM1 bound to Streptacin resin is incubated with NAD+ in Reaction Buffer and then incubated for 5 min. Reactions were then quenched by flash freezing in liquid nitrogen. The SARM1 cleavage products are thawed and added to a 10x solution of purified NNMT21 and S–adenosyl methionine (SAM) with final concentrations of 300 nM and 100 μM, respectively. NNMT is a SAM–dependent methyltransferase that catalyzes the methylation of nicotinamide (NAM), a product of the SARM1 reaction, forming 1–methyl nicotinamide (1–MNA) and SAH. SAH is then converted to light via the action of 5’–methylthioadenosine/AdoHcy nucleosidase (MTAN), adenine phosphoribosyl transferase (APRT), pyruvate orthophosphate dikinase (PPDK), and luciferase which are included in the MTase Glo Kit. Light can then be quantified using a PerkinElmer EnVision 2104 Multilabel Reader in conjunction with Wallac EnVision Manager software. Luminescence is converted to velocity using an SAH standard curve, and the initial velocities at each NAD+ concentration were fit to eq. 2 to obtain the Michaelis Menten constants.
LC–MS analysis of the SARM1 catalyzed reaction.
LC–MS analysis of the SARM1 catalyzed reaction was carried out according to a reported procedure.22 Briefly, SARM1 expressing cell lysates (C43 cell line, 0.6 μM final) were incubated in buffer (100 mM NaH2PO4 pH 8.0 plus 100 mM NaCl) with or without NAD+ (200 μM final) at 37 ˚C for 30 min. The samples were then incubated with 1M HClO4 (10 mM final) for 15 min and the resulting precipitate was removed by centrifugation at 16,500 × g for 10 min. The pH of the supernatant was neutralized by adding potassium carbonate (100 mM final) and then incubated on ice for 15 min. The mixture was clarified by centrifugation at 16,500 × g for 10 min and the pellet discarded. The resulting solution was added to NaH2PO4 pH 8.0 (100 mM final). A 50 μL fraction, was then injected onto a Synergi Fusion–RP (4.6 × 150 mm, 4 μm, Phenomenex column) at a flow rate of 0.55 mL/min with water as the mobile phase. Metabolites were eluted with a gradient of 0 % methanol for 0 – 2 min, 0 – 80 % methanol for 2 – 17 min, 80 – 100 % methanol for 17 – 18 min, and 0 % for 18 – 19 min. The metabolites were detected with a Quadropole Mass spectrometer (Agilent) in the positive ion mode. For control experiments, lysate with empty vector was used along with ENAD (200 μM final) and ADPR (200 μM final).
Inhibition Assays.
The fluorescent ENAD assay was used for all inhibitor assays. Briefly SARM1 was used at a working concentration of 300 nM in Reaction Buffer. ADPR (0 – 2 mM), cADPR (0 – 1.5 mM), and nicotinamide (0 – 1 mM) were each independently incubated with SARM1 for 10 min prior to initiating the reaction with ENAD (50 μM final). The nicotinamide analogs, 4–chloronicotinamide (0 – 1 mM), and 6–chloronicotinamide (0 – 1 mM), were also independently incubated with SARM1 for 10 min prior to initiation of the reaction with ENAD (50 μM final). The data were converted to velocity as described above and then normalized to the activity without inhibitor. IC50 values were determined from plots of inhibition concentration versus normalized response and fitting the data to eq. 1.
To determine the specific mechanism of inhibition, ADPR (0 – 250 μM) and 4– chloronicotinamide (0 – 1mM) were independently varied and incubated with SARM1 (300 nM) for 10 min in Reaction Buffer. The reaction was then initiated by the addition of ENAD (0 – 400 μM) and product formation was monitored as described above. The initial rates were compiled to produce Michaelis Menten curves at each inhibitor concentration using the GraphPad Prism software. The initial velocities under these conditions were fit to equations for competitive (eq 3), noncompetitive (eq 4), and uncompetitive inhibition (eq 5),
| (3) |
| (4) |
| (5) |
where Kii is the intercept Kind Kis is the slope Ki. The best fits were determined via a combination of visual and quantitative analysis, generating a pattern that allowed for the deduction of the kinetic mechanism.
RESULTS AND DISCUSSION
SARM1 Protein Purification and Initial Assay Optimization.
The SARM1 TIR domain with an N–terminal Strep–tag was expressed in E. coli C43 (DE3) cells and purified by Streptacin XT affinity chromatography and size exclusion chromatography unless otherwise noted. The protein was >95% pure as judged by SDS–PAGE and Coomassie staining (Figure S1D). To measure enzyme activity, we used a real–time NAD+ hydrolase assay that measures the cleavage of etheno–NAD+ (ENAD) (Figure 2A). SARM1 activity has historically been measured ‘on–bead’ after purification via Streptacin and/or metal ion affinity chromatography.12 Consistent with these early reports, we also observed a loss in activity during purification of a TIR domain construct containing an N–terminal Strep–tag and a C–terminal hexa–histidine tag (Figure 3A).
Figure 2. Assays to Characterize SARM1 Activity.

(A) SARM1 cleaves etheno-NAD+ (ENAD) to form nicotinamide and etheno-ADPR (EADPR) (λex= 330 nm, λem= 405 nm), allowing for direct, real-time monitoring of SARM1 activity. (B) Luminescent assay that couples the cleavage of NAD+ to the methylation of nicotinamide by Nicotinamide N-Methyltransferase (NNMT), which produces SAH (S-adenosyl homocysteine) as a by-product. SAH is then converted to ATP and then to light, as an indirect measure of SARM1 activity.
Figure 3. Initial Characterization of SARM1 Activity.

(A) Dually tagged SARM1 TIR domain activity at each step of the purification. (B) Activity of lysate expressed SARM1 (300 nM) versus the activity of purified SARM1 TIR domain (20 μM). (C) LC-MS traces of NAD+ (200 μM), ADPR (200 μM), and SARM1 lysate (SARM1 concentration 0.6 μM) with and without NAD+ (200 μM) at 254 nm. (D) Superimposed LC traces of lysates with empty vector or SARM1 overexpression incubated with 200 μM NAD+. (E) MS spectraof NAD+ in the positive mode. (F) Mass spectrum of ADPR in the positive mode.(G) Time course of product produced over time monitored with the ENAD assay. The concentration of SARM1 concentration in the lysates was determined by Western blotting (see methods). (H) Concentration dependence of SARM1 activity obtained using the ENAD assay.
Notably, the initial centrifugation step to clarify the lysate led to a significant drop in activity (Figure 3A). Similarly, there was little to no activity after purification from the Streptacin XT and Co–NTA affinity columns (Figure 3A). By contrast, and consistent with earlier reports, robust activity, resembling that seen in the crude lysate, was apparent when protein was bound to either Streptacin or Co–NTA beads (Figure 3A). While purified SARM1 is active when concentrated to 20 μM, the activity is ~800–fold less than is apparent in cell lysates, when the activity is normalized for enzyme concentration (Figure 3B). Concerned that the NAD+ hydrolase activity was not SARM1–catalyzed, we used LC–MS to evaluate enzyme activity in SARM1 expressing C43 cell lysates as well as cells transformed with an empty control vector (Figure 3C–F). As depicted in Figure 3C, robust NAD+ hydrolase activity was detected in SARM1 expressing cells, whereas no activity was apparent in the empty vector control lysates (Figure 3D). Furthermore, the SARM1–expressing cells showed a clear dose dependence as the ADPR peak area increased and that of NAD+ decreased, with increasing SARM1 concentration (Figure S3). Similar results were observed during the expression and purification of full length SARM1 and the SAM1–2TIR domain, as well as the corresponding C. elegans constructs (Figure S4). Notably, the addition of purified SARM1 to E. coli lysates did not restore activity, indicating that the decrease in activity is not due to the loss of an essential cofactor. Given that robust activity was observed in lysates with nanomolar levels of SARM1, we elected to pursue further mechanistic studies using cell lysates or enzyme partially purified on affinity resins.
To identify the optimal assay conditions, we first evaluated the dependence of activity on enzyme concentration. Notably, SARM1 activity was linear with respect to time and enzyme concentration (Figure 3G–H). We then evaluated the pH dependence and found that SARM1 activity is largely pH independent over the tested range (pH 5.5 – 9) (Figure S5A). Next, the effect of reducing agents was tested to determine whether they might influence SARM1 activity. Neither DTT nor TCEP altered SARM1 activity over the concentration ranges tested (0 – 2 mM), indicating that SARM1 activity is not redox regulated, at least under these conditions (Figure S5B). Based on these results, further assays were performed at 300 nM of SARM1 in a sodium phosphate buffer pH 8.0 with 300 mM NaCl.
Having optimized our assay conditions, we then evaluated the effect of common divalent metal ions (CaCl2, CdCl2, CoCl2, CuCl2, MgCl2, MnCl2, NiCl2, ZnCl2) and EDTA on SARM1 catalysis. Notably, none of the metal ions could activate SARM1, and only Ni2+ and Zn2+ inhibit SARM1 (Figure S6). The lack of an effect of EDTA on activity suggests that SARM1 does not require a metal ion for catalysis; although we recognize that these data do not rule out a tightly bound metal ion. To determine the potency of inhibition, IC50 values were obtained for both Ni2+ (IC50 = 600 ± 100 μM) and Zn2+ (10 ± 3 μM) (Figure S6). Although the specific mechanism by which Ni2+ and Zn2+ inhibit SARM1 activity is unclear, they are both thiophilic and their inhibitory effects could suggest that a cysteine is important for catalysis.
Steady State Kinetic Parameters.
Using our optimized conditions, the steady state kinetic parameters were determined for Strep–tagged wild type SARM1 TIR domain using the fluorescent assay. From this analysis, the Km, kcat and kcat/Km values for ENAD hydrolysis are 35 ± 10 μM, 0.06 ± 0.03 s–1, and 1500 ± 300 M–1s–1 (Figure 4). To determine the kinetic parameters for NAD+, the physiologically relevant substrate, we developed a novel assay that monitors nicotinamide production. In this assay, nicotinamide is first methylated via the action of NNMT, a SAM– dependent methyltransferase, and the SAH produced from this reaction is detected using the MTase–Glo methyltransferase assay (Promega) (Figure 2B). Using this assay, the Km, kcat and kcat/Km values for NAD+ hydrolysis are 28 ± 6 μM, 0.21 ± 0.03 s–1, and 7500 ± 1000 M–1s–1 (Figure 4, Table 2). Note that these values were obtained using Streptacin-bound SARM1. These values are within 4–fold of those obtained with the fluorescent assay and ENAD as a substrate, and nearly identical to those that were previously established (Km = 24 μM, kcat = 0.17 s–1 and kcat/Km = 7083 M–1s–1) using an alternative assay format12 (Table 2). In summary, while there is a small preference for NAD+, these data indicate that ENAD is an excellent substrate mimic that can be used to probe SARM1 catalysis.
Figure 4. Initial Kinetic Characterization of SARM1 and C. elegans SARM1 Ortholog Tir–1.
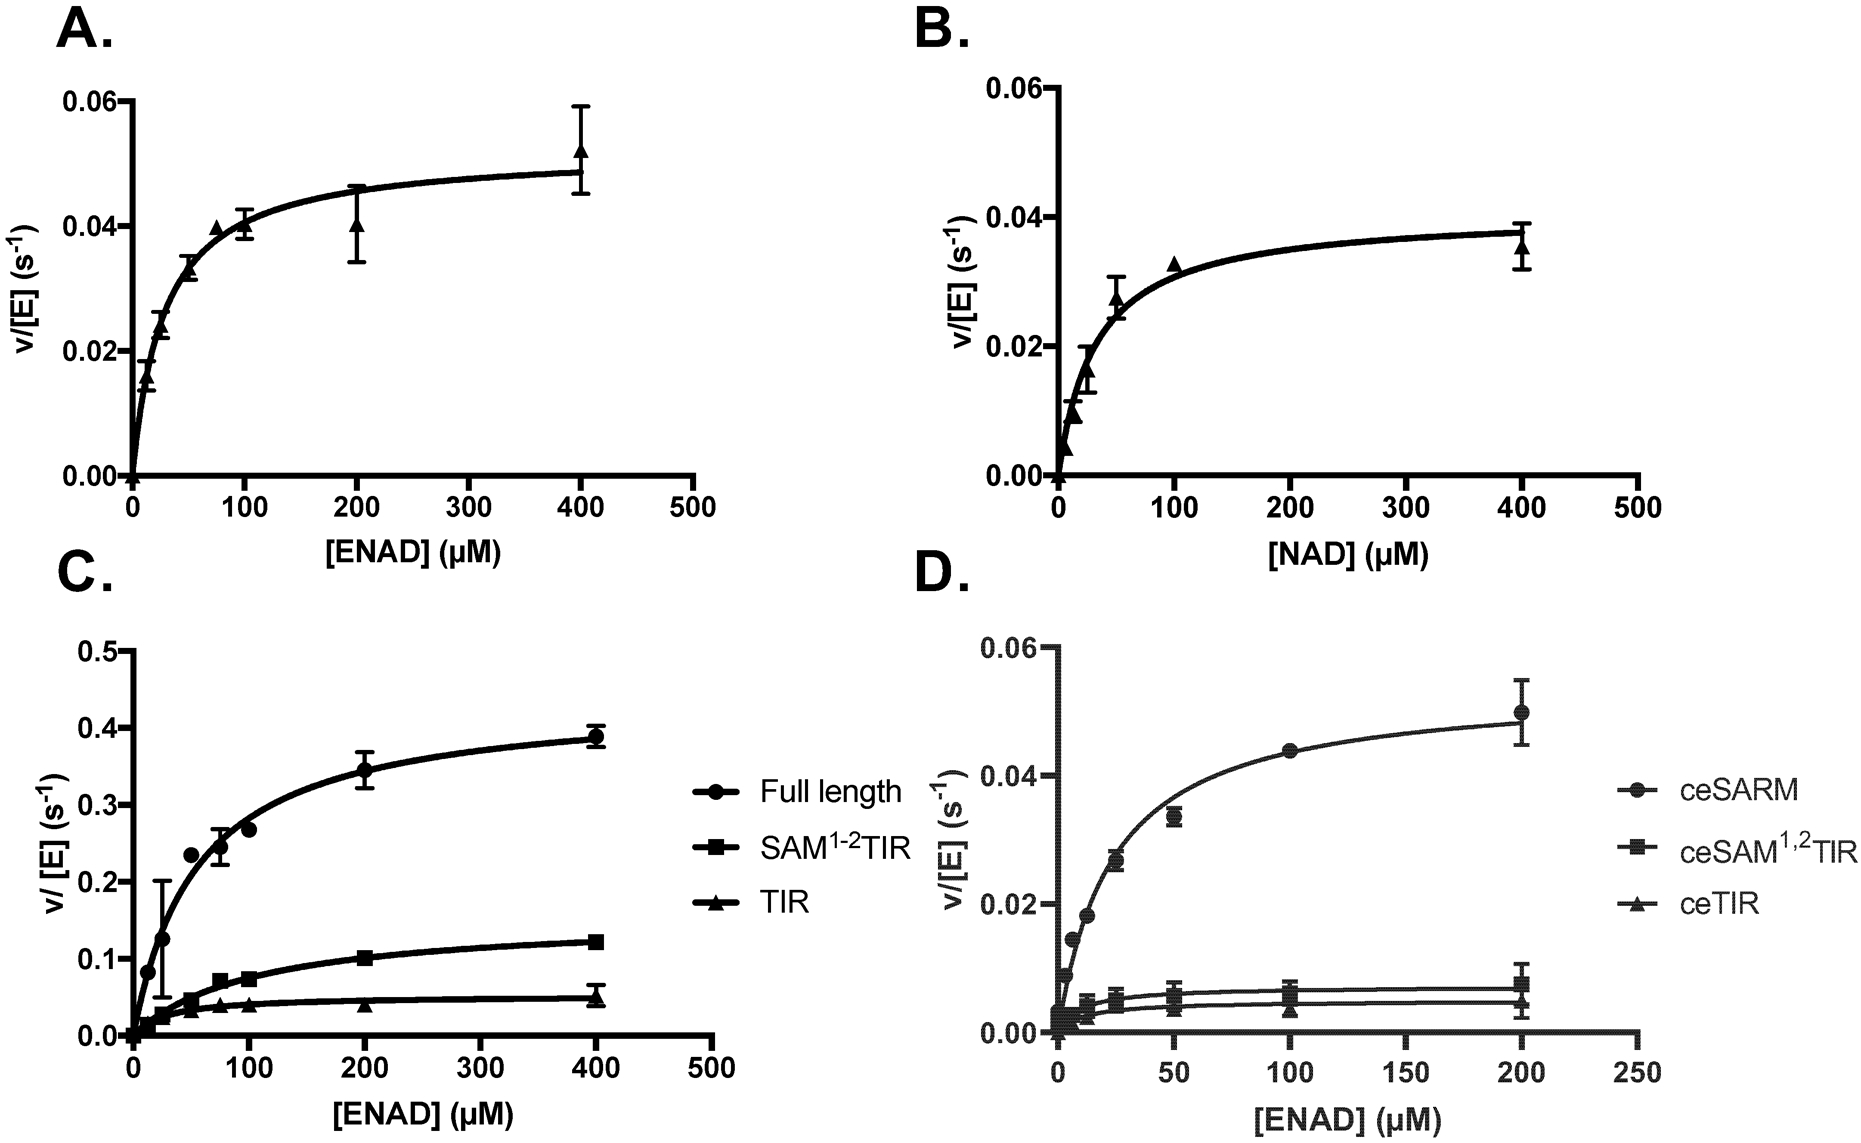
Steady State Kinetic analysis of the TIR domain of SARM1 characterized by the (A) fluorescent and (B) luminescent assays. (C) Activity of full length SARM1, the SAM1−2TIR, and TIR domains. (D) Steady State Kinetic analysis of full length Tir–1 (ceSARM), and the truncated Tir–1 constructs, ceSAM1−2TIR and ceTIR.
Table 2.
The Steady-State Kinetic Parameters for Wild type SARM1
| Substrate | ENAD | ENAD | ENAD | NAD+ | NAD+ |
|---|---|---|---|---|---|
|
Km (μM) |
70 ± 20 | 130 ± 20 | 35 ± 10 | 28 ± 6 | 24 |
|
kcat (s−1) |
0.40 ± 0.04 | 0.12 ± 0.02 | 0.06 ± 0.03 | 0.21 ± 0.03 | 0.17 |
|
kcat/Km (M−1s−1) |
6000 ± 2000 | 960 ± 300 | 1500 ± 300 | 7500 ± 1000 | 7083 |
Average of values calculated from 4 separate experiments run in duplicate.
Average of values calculated from 2 separate experiments run in duplicate.
Average of values calculated from triplicate experiments performed with affinity beads using the luminescent assay and NAD+ as a substrate.
Values reported by Essuman et al. 2017 (ref. 12) using NAD+ as the substrate. Values were determined using an LC-MS based assay.
Having validated our assay, we next determined the steady state kinetic parameters of ENAD hydrolysis for full-length SARM1 and a construct encompassing both the SAM and TIR domains (i.e. SAM1–2TIR). We focused on these constructs because the SAM1–2TIR construct has been reported to be constitutively active, whereas the full-length protein has been suggested to exist in an autoinhibited state.14 Interestingly, the steady state kinetic parameters for full-length SARM1 and the SAM1−2TIR construct are comparable to the TIR domain alone. In fact, based on the kcat/Km values, full-length SARM1 is the most active construct (kcat/Km = 6000 ± 2000 M−1s−1 vs. 1500 ± 300 M−1s−1 for the TIR domain). The increased activity is principally driven by a higher kcat (0.40 ± 0.04 s−1 for full-length SARM1 versus 0.06 ± 0.03 s−1 for the TIR domain alone).
To corroborate our results, we overexpressed TIR–1, the C. elegans ortholog, and showed that like full-length SARM1, the catalytic efficiency of full-length TIR–1 (kcat/Km = 2000 ± 1000 M−1s−1) is higher than the values obtained for either ceSAMTIR or ceTIR alone (Figure 4D, Table S2). We note that like full-length SARM1, TIR–1 was also expressed at low levels (>50–fold worse than the TIR domains alone). Since previous studies do not appear to have normalized for protein levels, a lack of apparent activity may have led others to suggest that the full-length enzyme exists in an auto-inhibited state; low expression might also mitigate aggregation resulting in low activity. Alternatively, post-translational modifications (which are absent in our bacterial expression system) may be required for the protein to adopt an auto-inhibited conformation. Finally, we recognize that the observed activity associated with full-length SARM1 may be due to the presence of proteolytic fragments that are catalytically active. The fact that the Km for full-length enzyme is significantly higher than the TIR domain at least partially mitigates this concern.
Elucidation of Kinetic Mechanism.
Having determined the kinetic parameters, we next sought to define the kinetic mechanism of SARM1; such knowledge is generally useful for inhibitor development. Based on the reaction products (Figure 1), SARM1 could cleave NAD+ via one of three mechanisms: (1) a sequential intermediate mechanism where SARM1 would cleave NAD+ to nicotinamide and cADPR, and then in a second step where cADPR is hydrolyzed to ADPR; (2) a uni–bi ordered mechanism where product release is ordered; or (3) a uni–bi random mechanism where product release occurs randomly. The fact that SARM1 cleaves ENAD with comparable kinetics to NAD+ argues against an obligate sequential intermediate mechanism; the etheno bridge in ENAD blocks the N1 position, which was previously shown to be the site of cyclization.12 Furthermore, the fact that cADPR is a poor inhibitor of SARM1 (see below) indicates that it is also a poor substrate for the second half reaction, which is inconsistent with an obligate sequential intermediate mechanism. Nevertheless, cyclization at N7 has been observed with other enzymes (e.g. CD38).23 As such, a sequential intermediate mechanism cannot be definitively ruled out.
To differentiate between ordered and random product release, we first evaluated the product inhibition patterns. For these experiments, we used the Strep–tagged TIR domain as it expresses 20–fold to 50–fold better than either the truncated SAM1–2 TIR or full-length enzyme, respectively. Initially, we determined IC50 values for ADPR, cADPR, and nicotinamide to identify the concentration ranges necessary to determine the modes of inhibition. Notably, ADPR inhibits SARM1 with an IC50 of 129 ± 6 μM (Figure 5). By contrast, the IC50 for cADPR is > 1.5 mM, indicating that cADPR binds poorly to the enzyme (Figure 5). Nicotinamide is also a poor inhibitor with an IC50 value > 500 μM (Figure 5). This finding is in line with CD38 where the Ki for nicotinamide is 7.1 mM.23 Alternatively, the weak inhibition may be due to nicotinamide being sequestered or metabolized. To combat these potential issues, we evaluated the nicotinamide analogs 4–chloronicotinamide (4-CN) and 6–chloronicotinamide (6-CN) as alternative nicotinamide analogs. Both chlorinated analogs inhibit SARM1, with 4–CN acting more potently with an IC50 of 640 ± 40 μM (Figure 5).
Figure 5. Evaluation of Products and Product Analogs as Inhibitors.

The dose dependence of (A) nicotinamide, (B) ADPR, (C) cADPR, (D) 4-CN and (E) 6-CN on SARM1 activity.
Having established that ADPR and 4-CN are reasonably potent SARM1 inhibitors, we next determined their mechanisms of inhibition. Notably, ADPR exhibited a competitive inhibition pattern with a Ki of 90 ± 10 μM. By contrast, 4–CN yields a noncompetitive pattern of inhibition with a Ki of 700 ± 30 μM (Figure 6). This inhibition pattern is consistent with the patterns of inhibition afforded by nicotinamide for Sir2 and CD38 where nicotinamide shows noncompetitive and mixed inhibition, respectively.24–27 In combination, these data are consistent with SARM1 catalysis proceeding via an ordered uni–bi kinetic mechanism where nicotinamide is released prior to ADPR (Scheme 1). For the random uni–bi mechanism to hold true, both nicotinamide and ADPR would compete for the same form of the enzyme and as a result, function as competitive inhibitors. Therefore, the fact that 4–CN acts as a noncompetitive inhibitor rules out random product release and is only consistent with an ordered uni–bi kinetic mechanism.
Figure 6. Determination of Inhibition Mechanisms.

(A) ADPR inhibits SARM1 competitively with a Ki of 90 ± 10 μM and (B) 4-Chloronicotinamide inhibits noncompetitively with a Ki of 700 ± 30 μM.
Scheme 1. SARM1 Follows an Ordered Uni-bi Mechanism.

The kinetic mechanism of SARM1 wherein NAD+ binds, enzymatic turnover occurs, and then nicotinamide is released prior to ADPR release.
CONCLUSIONS
This work depicts the initial kinetic characterization of SARM1, including the difference in activity of pure protein compared to that in lysates, the effect of reducing agents, pH and metals, and the application of three independent assay formats to characterize NAD+ hydrolase activity. We show that SARM1 loses activity during purification, and that pure SARM1 is only active when highly concentrated. This challenge has led us and others, to study SARM1 in cell lysates as the large quantity of pure SARM1 necessary for activity encounters issues with both practicality and feasibility. Furthermore, the activity of the pure enzyme is 800–fold lower than that in the cell lysates making it difficult to measure enzyme activity under initial rate conditions. Note that these observations have only been alluded to in previous reports and not explicitly stated. We hope that highlighting these challenges will aid future efforts to study SARM1 catalysis. We also show that reducing agents and pH do not impact SARM1 activity, whereas a subset of thiophilic metals inhibit activity. Inhibition by these metals suggests that a cysteine could be involved in catalysis.
Contrary to prior reports, we also show that both full-length SARM1 and ceSARM1 are highly active relative to their truncated variants. Given that this trend is conserved amongst orthologs, it suggests that TIR–1 is a suitable model system to study SARM1 activity. We also characterized the modes of inhibition of the product ADPR and the product analog 4-chloronicotinamide, which allowed us to deduce the kinetic mechanism of SARM1. Specifically, we showed that SARM1 follows an ordered uni–bi mechanism, where nicotinamide is released prior to ADPR. The competitive and noncompetitive inhibition mechanisms of ADPR and 4-chloronicotinamide indicate that these inhibitors compete with different forms of the enzyme, demonstrating that SARM1 follows an ordered mechanism of catalysis.
Compared to other metabolic enzymes where kcat/KM often approaches the diffusion limit, the catalytic efficiencies observed for SARM1 and ceSARM1 indicate that these enzymes are relatively weaker catalysts (102-104-fold relative to a diffusion–limited enzyme (i.e. 109 M−1s−1)). Nevertheless, the values are in line with other signaling enzymes, including the Protein Arginine Methyltransferases and Protein Arginine Deiminases,28 and may reflect the kinetics of Wallerian degeneration which proceeds over several hours.11, 12 However, much remains to be discovered regarding the basal activity of SARM1 and the mechanisms that regulate its activity. In summary, these studies provide a solid background for further study into this unique NAD+ hydrolase and will facilitate the development of inhibitors and activity–based probes targeting SARM1.
Supplementary Material
Funding Sources
This work was supported in part by NIH grants R35 GM118112 (P.R.T.) and F31NS108610 (H.S.L.).
ABBREVIATIONS
- SARM1
Sterile alpha and toll/interleukin receptor motif–containing protein 1
- TIR
toll/interleukin receptor
- ADPR
ADP Ribose
- WLDS
Wallerian degeneration slow
- NMNAT1
nicotinamide mononucleotide adenylyl transferase 1
- cADPR
cyclic ADP ribose
- ARM
armadillo/HEAT repeat
- SAM
sterile alpha motif
- ceSARM
C. elegans SARM1 ortholog, TIR-1
- ENAD
Nicotinamide 1, N6–ethenoadenine dinucleotide
- EADPR
etheno-ADPR
- DTT
dithiothreitrol
- TCEP
tris(2–carboxyethyl)phosphine
- NNMT
nicotinamide N-methyl transferase
- SAH
S-adenosyl homocysteine
- SAM
S-adenosyl methionine
- NAM
nicotinamide
- 1-MNA
1-methyl nicotinamide
- MTAN
5’–methylthioadenosine/AdoHcy nucleosidase
- APRT
adenine phosphoribosyl transferase
- PPDK
pyruvate orthophosphate dikinase
- 4-CN
4–chloronicotinamide
- 6-CN
6–chloronicotinamide
Footnotes
Supporting information. The Supporting Information is available free of charge on the ACS Publications website at DOI: Tables S1–2, Figures S1–S6.
The authors declare the following competing financial interest(s): P.R.T. is a consultant for Celgene and Disarm Therapeutics.
References
- (1).Saxena S, and Caroni P (2007) Mechanisms of axon degeneration: from development to disease, Prog Neurobiol 83, 174–191. [DOI] [PubMed] [Google Scholar]
- (2).Johnson VE, Stewart W, and Smith DH (2013) Axonal pathology in traumatic brain injury, Exp Neurol 246, 35–43. [DOI] [PMC free article] [PubMed] [Google Scholar]
- (3).Gunawardena S, and Goldstein LS (2005) Polyglutamine diseases and transport problems: deadly traffic jams on neuronal highways, Arch Neurol 62, 46–51. [DOI] [PubMed] [Google Scholar]
- (4).Coleman M (2005) Axon degeneration mechanisms: commonality amid diversity, Nat Rev Neurosci 6, 889–898. [DOI] [PubMed] [Google Scholar]
- (5).Conforti L, Gilley J, and Coleman MP (2014) Wallerian degeneration: an emerging axon death pathway linking injury and disease, Nat Rev Neurosci 15, 394–409. [DOI] [PubMed] [Google Scholar]
- (6).George EB, Glass JD, and Griffin JW (1995) Axotomy-induced axonal degeneration is mediated by calcium influx through ion-specific channels, J Neurosci 15, 6445–6452. [DOI] [PMC free article] [PubMed] [Google Scholar]
- (7).Schurter BT, Koh SS, Chen D, Bunick GJ, Harp JM, Hanson BL, Henschen-Edman A, Mackay DR, Stallcup MR, and Aswad DW (2001) Methylation of histone H3 by coactivator-associated arginine methyltransferase 1, Biochemistry 40, 5747–5756. [DOI] [PubMed] [Google Scholar]
- (8).Bisby MA, Tetzlaff W, and Brown MC (1995) Cell body response to injury in motoneurons and primary sensory neurons of a mutant mouse, Ola (Wld), in which Wallerian degeneration is delayed, J Comp Neurol 359, 653–662. [DOI] [PubMed] [Google Scholar]
- (9).Sasaki Y, and Milbrandt J (2010) Axonal degeneration is blocked by nicotinamide mononucleotide adenylyltransferase (Nmnat) protein transduction into transected axons, J Biol Chem 285, 41211–41215. [DOI] [PMC free article] [PubMed] [Google Scholar]
- (10).Osterloh JM, Yang J, Rooney TM, Fox AN, Adalbert R, Powell EH, Sheehan AE, Avery MA, Hackett R, Logan MA, MacDonald JM, Ziegenfuss JS, Milde S, Hou YJ, Nathan C, Ding A, Brown RH Jr., Conforti L, Coleman M, Tessier-Lavigne M, Zuchner S, and Freeman MR (2012) dSarm/Sarm1 is required for activation of an injury-induced axon death pathway, Science 337, 481–484. [DOI] [PMC free article] [PubMed] [Google Scholar]
- (11).Loring HS, and Thompson PR (2019) Emergence of SARM1 as a Potential Therapeutic Target for Wallerian-type Diseases, Cell Chem Biol. [DOI] [PMC free article] [PubMed] [Google Scholar]
- (12).Essuman K, Summers DW, Sasaki Y, Mao X, DiAntonio A, and Milbrandt J (2017) The SARM1 Toll/Interleukin-1 Receptor Domain Possesses Intrinsic NAD(+) Cleavage Activity that Promotes Pathological Axonal Degeneration, Neuron 93, 1334–1343 e1335. [DOI] [PMC free article] [PubMed] [Google Scholar]
- (13).Summers DW, Gibson DA, DiAntonio A, and Milbrandt J (2016) SARM1-specific motifs in the TIR domain enable NAD+ loss and regulate injury-induced SARM1 activation, Proc Natl Acad Sci U S A 113, E6271–E6280. [DOI] [PMC free article] [PubMed] [Google Scholar]
- (14).Gerdts J, Summers DW, Sasaki Y, DiAntonio A, and Milbrandt J (2013) Sarm1-mediated axon degeneration requires both SAM and TIR interactions, J Neurosci 33, 13569–13580. [DOI] [PMC free article] [PubMed] [Google Scholar]
- (15).Henninger N, Bouley J, Sikoglu EM, An J, Moore CM, King JA, Bowser R, Freeman MR, and Brown RH Jr. (2016) Attenuated traumatic axonal injury and improved functional outcome after traumatic brain injury in mice lacking Sarm1, Brain 139, 1094–1105. [DOI] [PMC free article] [PubMed] [Google Scholar]
- (16).Geisler S, Doan RA, Strickland A, Huang X, Milbrandt J, and DiAntonio A (2016) Prevention of vincristine-induced peripheral neuropathy by genetic deletion of SARM1 in mice, Brain 139, 3092–3108. [DOI] [PMC free article] [PubMed] [Google Scholar]
- (17).Turkiew E, Falconer D, Reed N, and Hoke A (2017) Deletion of Sarm1 gene is neuroprotective in two models of peripheral neuropathy, J Peripher Nerv Syst 22, 162–171. [DOI] [PMC free article] [PubMed] [Google Scholar]
- (18).Pergolizzi G, Butt JN, Bowater RP, and Wagner GK (2011) A novel fluorescent probe for NAD-consuming enzymes, Chem Commun (Camb) 47, 12655–12657. [DOI] [PubMed] [Google Scholar]
- (19).Barrio JR, Secrist JA 3rd, and Leonard NJ (1972) A fluorescent analog of nicotinamide adenine dinucleotide, Proc Natl Acad Sci U S A 69, 2039–2042. [DOI] [PMC free article] [PubMed] [Google Scholar]
- (20).Horsefield S, Burdett H, Zhang X, Manik MK, Shi Y, Chen J, Qi T, Gilley J, Lai JS, Rank MX, Casey LW, Gu W, Ericsson DJ, Foley G, Hughes RO, Bosanac T, von Itzstein M, Rathjen JP, Nanson JD, Boden M, Dry IB, Williams SJ, Staskawicz BJ, Coleman MP, Ve T, Dodds PN, and Kobe B (2019) NAD(+) cleavage activity by animal and plant TIR domains in cell death pathways, Science 365, 793–799. [DOI] [PubMed] [Google Scholar]
- (21).Loring HS, and Thompson PR (2018) Kinetic Mechanism of Nicotinamide N-Methyltransferase, Biochemistry 57, 5524–5532. [DOI] [PubMed] [Google Scholar]
- (22).Yoshino J, and Imai S (2013) Accurate measurement of nicotinamide adenine dinucleotide (NAD(+)) with high-performance liquid chromatography, Methods Mol Biol 1077, 203–215. [DOI] [PMC free article] [PubMed] [Google Scholar]
- (23).Sauve AA, Munshi C, Lee HC, and Schramm VL (1998) The reaction mechanism for CD38. A single intermediate is responsible for cyclization, hydrolysis, and base-exchange chemistries, Biochemistry 37, 13239–13249. [DOI] [PubMed] [Google Scholar]
- (24).Sauve AA, and Schramm VL (2003) Sir2 regulation by nicotinamide results from switching between base exchange and deacetylation chemistry, Biochemistry 42, 9249–9256. [DOI] [PubMed] [Google Scholar]
- (25).Jackson MD, Schmidt MT, Oppenheimer NJ, and Denu JM (2003) Mechanism of nicotinamide inhibition and transglycosidation by Sir2 histone/protein deacetylases, J Biol Chem 278, 50985–50998. [DOI] [PubMed] [Google Scholar]
- (26).Inageda K, Takahashi K, Tokita K, Nishina H, Kanaho Y, Kukimoto I, Kontani K, Hoshino S, and Katada T (1995) Enzyme properties of Aplysia ADP-ribosyl cyclase: comparison with NAD glycohydrolase of CD38 antigen, J Biochem 117, 125–131. [DOI] [PubMed] [Google Scholar]
- (27).Landry J, Slama JT, and Sternglanz R (2000) Role of NAD(+) in the deacetylase activity of the SIR2-like proteins, Biochem Biophys Res Commun 278, 685–690. [DOI] [PubMed] [Google Scholar]
- (28).Fuhrmann J, Clancy KW, and Thompson PR (2015) Chemical biology of protein arginine modifications in epigenetic regulation, Chem Rev 115, 5413–5461. [DOI] [PMC free article] [PubMed] [Google Scholar]
Associated Data
This section collects any data citations, data availability statements, or supplementary materials included in this article.