

Abstract
Introduction
Brain cells secrete extracellular microvesicles (EVs) that cross the blood‐brain barrier. Involved in cell‐to‐cell communication, EVs contain surface markers and a biologically active cargo of molecules specific to their tissue (and cell) of origin, reflecting the tissue or cell's physiological state. Isolation of brain‐secreted EVs (BEVs) from blood provides a minimally invasive way to sample components of brain tissue in Alzheimer's disease (AD), and is considered a form of “liquid biopsy.”
Methods
We performed a comprehensive review of the PubMed literature to assess the biomarker and therapeutic potential of blood‐isolated BEVs in AD.
Results
We summarize methods used for BEV isolation, validation, and novel biomarker discovery, as well as provide insights from 26 studies in humans on the biomarker potential in AD of four cell‐specific BEVs isolated from blood: neuron‐, neural precursor‐, astrocyte‐, and brain vasculature–derived BEVs. Of these, neuron‐derived BEVs has been investigated on several fronts, and these include levels of amyloid‐β and tau proteins, as well as synaptic proteins. In addition, we provide a synopsis of the current landscape of BEV‐based evaluation/monitoring of AD therapeutics based on two published trials and a review of registered clinical trials.
Discussion
Blood‐isolated BEVs have emerged as a novel player in the study of AD, with enormous potential as a diagnostic, evaluation of therapeutics, and treatment tool. The literature has largely concentrated on neuron‐derived BEVs in the blood in AD. Given the multifactorial pathophysiology of AD, additional studies, in neuron‐derived and other brain cell–specific BEVs are warranted to establish BEVs as a robust blood‐based biomarker of AD.
Keywords: Alzheimer's disease, blood‐based biomarkers, brain‐secreted extracellular microvesicles, early detection, exosomes, liquid biopsy, therapeutics
1. INTRODUCTION
Extracellular vesicles (EVs) are diverse, nanoscale membrane vesicles released by a variety of cells into the extracellular microenvironment. Based on their biogenesis, size, and biophysical properties, EVs can be further subtyped into categories such as exosomes, shedding microvesicles and apoptotic bodies.1 To date, EVs have been isolated from a variety of biological fluids, including those that are easily accessible, such as blood, saliva, and urine. Involved in cell‐to‐cell communication (both local and remote), EVs contain surface markers, as well as a biologically active cargo of metabolites, proteins, nucleic acids, and other molecules specific to their tissue (and cell) of origin, and reflecting the tissue or cell's physiological state. This tissue‐specificity combined with their easy accessibility from blood makes EVs extremely attractive as blood‐based biomarkers of disease, prognostic indicators, and therapeutic tools.
In the last decade or so, EVs, particularly brain‐secreted EVs (BEVs) isolated from blood have emerged as a novel player in Alzheimer's disease (AD) progression, with enormous potential as a diagnostic and treatment tool.2, 3 Accumulating evidence suggests that pathophysiological alterations (eg, synaptic dysfunction, brain amyloidosis) in AD might be reflected in the number and composition of BEVs.4, 5 For example, brain synaptic activity, which is altered early in AD, modulates the release of neuron‐derived BEVs.5, 6 Moreover, it was recently reported that the APOE ɛ4 allele, the greatest genetic risk factor for AD, compromises BEV production.7 While several questions pertaining to the biogenesis, release, and action of BEVs remains unexplored, it is well established that various components of the brain (eg, neurons, cerebral blood vessels, glia) secrete EVs that travel past the blood‐brain barrier (BBB) and accumulate in the blood (and other biofluids). Enrichment of BEVs derived from a specific brain component from blood is possible using cell‐specific surface markers, and provides a minimally invasive, yet powerful, way to sample components of healthy and AD brain tissue, a form of “liquid biopsy”.
A number of independent studies reported in the literature have focused on identifying biomarkers for early detection, disease stratification, and monitoring of AD from blood‐isolated BEVs. One study reported that the EV concentration was higher in blood plasma than in the cerebrospinal fluid (CSF).8 Classified as a connective tissue, blood consists of two main components: a liquid component, an admixture of proteins, enzymes, nutrients, wastes, hormones and gases; and a cellular component that includes mononuclear leukocytes, erythrocytes, and platelets. BEVs are usually isolated from serum and plasma, both derived from the liquid component of blood. Specifically, serum is the liquid that remains after the blood has clotted, while plasma is the liquid that remains when clotting is prevented with the addition of an anticoagulant.
Our overall goal was to perform a comprehensive review of the AD literature to assess the biomarker potential of blood‐isolated BEVs in human. Our specific aims were to summarize (1) the methods commonly used for blood‐based BEV isolation, validation, and novel biomarker discovery, (2) the insights gained from studies investigating brain‐cell‐specific (e.g. neurons, blood vessels) BEVs isolated from blood, and (3) the current landscape of blood‐isolated BEV‐based evaluation of AD therapeutics.
2. METHODS
We conducted a review of all PubMed articles published up to October 2019. Because the study of BEVs in blood is an emergent field, there is still a lack of consistent terminology. Therefore, to avoid missing relevant studies due to stringent use of terminology, we used relaxed and inclusive keywords, which captured all of the EV‐based literature in AD.
HIGHLIGHTS
Reviewed Alzheimer's disease (AD) studies on brain‐secreted extracellular microvesicles (BEVs) in blood
Provided an overview of BEV isolation, validation, and biomarker discovery methods
We found that BEVs demonstrate good biomarker potential, but more studies are needed
BEVs are actively being used to evaluate target engagement in AD drug trials
RESEARCH IN CONTEXT
Systematic review: We conducted a review of PubMed‐indexed articles investigating brain‐secreted extracellular microvesicles (BEVs) in blood. We included studies that investigated differences in BEV content in Alzheimer's disease (AD) and cognitively normal (CN) individuals. Studies utilizing BEVs to evaluate target engagement in AD drug trials were also included.
Interpretation: Our review summarizes that in blood, surface markers facilitate enrichment of brain‐cell‐specific (e.g. neurons, blood vessels) BEVs, providing a minimally invasive way to sample components of healthy and AD brain tissue. BEVs in blood demonstrate enormous potential to serve as a novel AD biomarker and treatment tool.
Future directions: We found that most studies investigated blood‐isolated neuron‐derived BEVs. To better assess the effect of the multifactorial pathophysiology of AD on blood‐isolated BEVs, additional studies investigating BEVs derived for other brain‐specific cells and using larger study populations are needed.
Initial search term combinations used were as follows: (1) Alzheimer's disease AND extracellular vesicles; (2) Alzheimer's disease AND extracellular vesicles AND blood; (3) Alzheimer's disease AND exosomes; (4) Alzheimer's disease AND exosomes AND blood; (5) Alzheimer's disease AND therapy AND extracellular vesicles, and (6) Alzheimer's disease AND therapy AND exosome. PubMed‐introduced variations of the provided search term combinations have been provided in the Supplementary material.
From the articles encountered with our initial search terms, we were inspired to conduct additional targeted searches. These were as follows: (7) mesenchymal stem cells AND Alzheimer's disease AND therapy AND extracellular microvesicles; (8) mesenchymal stem cells AND Alzheimer's disease AND therapy AND exosomes; (9) stem cells AND Alzheimer's disease AND therapy AND extracellular microvesicles; (10) stem cells AND Alzheimer's disease AND therapy AND exosomes; (11) intranasal insulin AND Alzheimer's disease AND therapy AND extracellular microvesicles; (12) intranasal insulin AND Alzheimer's disease AND therapy AND exosomes; (13) insulin AND Alzheimer's disease AND therapy AND extracellular microvesicles; and (14) insulin AND Alzheimer's disease AND therapy AND exosomes. PubMed‐introduced variations of these additional search term combinations have also been provided in the Supplementary material.
Overall, we included articles investigating AD‐associated blood‐isolated EVs (in particular BEVs) in humans, and published in English. Moreover, for the entire review, additional articles (that met criteria) were identified by scanning the reference lists of selected PubMed articles.
Additional details on microRNAs (miRs) presented in Section 4.5 (Alzheimer's disease–associated miR cargo of blood‐isolated EVs) were compiled from three different databases: Vesiclepedia, ExoCarta, and miRDB. Vesiclepedia is a manually curated compendium of molecular data identified in different classes of EVs (http://www.microvesicles.org/). ExoCarta is a web‐based compendium of exosomal cargo (http://www.exocarta.org/). miRDB is an online database for miR target prediction and functional annotations (http://mirdb.org/). Details on registered drug trials presented in Section 5 (blood‐isolated BEV‐based evaluation of AD therapeutics) were compiled from clinicaltrials.gov, a database of privately and publicly funded clinical studies conducted around the world.
3. BRAIN‐SECRETED EVs (BEVs) FROM BLOOD
EVs derived from various brain components are a highly attractive source for identification of novel AD biomarkers. However, isolation of pure, highly specific BEVs from blood (serum or plasma) is challenging because they are contaminated by peripherally derived EVs and non‐EV components (eg, lipoproteins of very low [VLDL], low [LDL], and high [HDL] density). Thus considerable caution must be taken in choosing the most appropriate method for selective isolation of BEVs and validating the purity of the preps, using existing guidelines set by the International Society for Extracellular Vesicles (ISEV, http://www.isev.org) for minimal information required for EV isolation. ISEV guidelines also include variables preceding BEV isolation, such as blood collection procedures, including time of draw and fasting status, blood tubes used and handling; processing steps such as the protocol used for separating plasma or serum; and storage‐associated variable such as temperature, time in storage, and the number of subsequent freeze‐thaw cycles.9, 10, 11 Because preanalytical variables can affect downstream findings, the use of standardized protocols are highly recommended to ensure reproducibility. In addition, EV collection from plasma is usually encouraged over serum, since the latter might contain contaminating EVs from platelets released during clot formation after blood collection.11 Selectively removing platelet EVs or enriching for BEVs might address some of the issues associated with serum. The ISEV, however, has not taken a position on the use of serum because a detailed comparison of serum versus plasma isolation is lacking. Thus serum‐derived BEVs can be used for biomarker evaluation, as long as highly specific methods that can separate or differentiate BEVs from the rest of the EV population (such as immunoaffinity) are used, and proper “minimal information for studies of EVs (MISEV)” guidelines9 for validation of BEV isolates are followed.
3.1. Methods for isolation of EVs and BEVs from plasma or serum
EV isolation from serum or plasma may be achieved by a number of methods, including ultracentrifugation‐based methods, polymer‐based precipitation, size‐exclusion chromatography, and immunoaffinity isolation.9 These methods can range in the degree of their specificity, recovery, and ease of EV isolation.9 Although these methods by themselves might be unable to achieve both high specificity and high recovery of EVs, a combination of multiple methods together with advanced multiplexed methods for validation can be used to achieve higher specificity and recovery.
Ultracentrifugation (UC) is usually considered a “gold standard” method for EV isolation from all sample types, and is typically the method to which all other methods are compared. Although it usually has high specificity for EV isolation, with few non‐EV components, the method can be tedious, requires large amounts of starting material, and uses relatively expensive ultracentrifuges and multiple centrifugation steps, resulting in sample loss and low EV recovery. Density gradient methods are also UC‐based and are usually superior to UC‐alone methods in separating non‐EV components and isolating highly specific EV fractions. However, density gradient methods require a larger amount of starting material and produce low EV recovery. Furthermore, these methods alone would not differentiate BEVs from peripherally derived EVs.
Commercially available polymeric precipitation kits (eg, ExoQuick [http://www.systembio.com], miRCURY[http://www.qiagen.com]), mainly utilizing polyethylene glycol for enriching EVs from blood, are becoming more acceptable and have evolved over the years in their capability for isolating EVs from biological samples. These kits are technically straightforward and require little hands‐on time. Although these methods recover the highest amount of extracellular materials, they significantly lack in specificity.9 For example, they are heavily contaminated with blood proteins and other non‐EV components. It is, therefore, almost always recommended to combine this method with other EV‐isolating methods, such as size‐exclusion chromatography and immunoaffinity to remove non‐EV components.
Size‐exclusion chromatography (SEC) and other size‐based methods (eg, ultrafiltration) separate the components of biological samples according to their size and allows for the separation of EVs from blood proteins, nucleic acids, non‐EV components, and other biomolecules, while maintaining their functional and morphological integrity. SEC is routinely used for the isolation of EVs from small volumes of biological samples such as serum/plasma and CSF. Although SEC can produce high‐specificity EVs, the recovery is typically low. Furthermore, similar to the methods mentioned in the preceding text, SEC alone would not be able to differentiate BEVs from peripherally derived EVs.
BOX 1
Define each preparation by a quantitative measure of the source. For plasma and serum this would include the volume of the biofluid used.
Characterize each preparation to estimate abundance of EVs. This can be done using various light‐scattering methods (eg, dynamic light scattering [DLS], nanoparticle tracking analysis [NTA], and standard or high‐resolution flow cytometry), and/or by measurement of total amounts of protein, RNA, or lipids. Light‐scattering methods allow measurement of total particle number, as well as the size range of the EVs, which could also be useful in estimating the composition of microvesicles, nanovesicles, and other particles. Nanovesicles (typically <150 nm) are EVs generated from the endosomal pathway (via multivesicular bodies) and microvesicles are larger EVs that are typically shed (ectosomes) from various cells. However, it should be noted that some light‐scattering methods (eg, DLS) are prone to artifacts due to contaminants, such as dust, microorganisms, and large particles, whereas other methods (eg, NTA) can easily detect these contaminants and are minimally influenced by them.14
Examine each preparation for generic EV components and specific BEV components, depending on the specificity needed (positive markers). The EV components are generic EV positive markers such as CD63, CD81, and CD82 antigens. It is recommended that enrichment of at least three generic protein EV markers are demonstrated using western blotting, enzyme linked immunosorbent assay (ELISA), mass spectrometry (MS), or other methods that allow protein sequence‐specific measurements. The BEV components are positive BEV markers such as neuron‐ or brain vessel‐specific markers. For BEV, it is highly recommended to demonstrate at least one of the BEV‐specific components: neural cell adhesion molecule L1 or L1CAM and neural cell adhesion molecule or NCAM (neurons); sodium‐dependent glutamate/aspartate transporter 1, also known as GLAST (astrocyte); glial fibrillary acidic protein or GFAP (glia/astrocyte); glucose transporter 1 or GLUT1 and claudin 5 or CLDN5 (brain endothelium).9, 12, 13
Test each preparation for the presence of non‐EV co‐isolated components (negative markers). It is recommended that depletion/significant reduction of at least one negative plasma/serum marker is demonstrated using protein sequence‐specific methods (mentioned above). Examples of plasma/serum markers include serum albumin and apolipoprotein B.
Provide some information on the individual EVs present. It is recommended that this includes both image‐based analysis of single EVs and non–image‐based analysis of a large number of single EVs.
Immunoaffinity (IA) isolation is probably the most suitable method for selective isolation of EVs and BEVs from serum and plasma. The method relies on the presence of extracellularly exposed proteins that are characteristically unique to the surface of various EV classes and can be exploited to selectively enrich the specific EV class (immuno‐enrichment) from a mixed population consisting of unwanted EV classes and contaminating non‐EV components. Alternatively, the method can also be used to remove unwanted EVs (eg, platelet‐derived) from the population (ie, immuno‐depletion). The IA method typically involves using antibodies to the surface proteins that are either directly conjugated to beads (eg, magnetic) or used in conjunction with a secondary antibody beads. Examples of surface protein markers of generic EVs include CD63 and CD81, whereas the neural cell adhesion molecule L1 (L1CAM or CD171) is an example of a surface protein marker for neuron‐derived BEVs. In addition, with the availability of large single‐cell RNAseq datasets now being publicly available for brain and other tissues,12, 13 highly specific and abundant markers for various brain components and/or regions can be chosen and used for IA‐based isolation of these selective populations of EVs. Overall, although an IA‐based method might produce lower recovery than some of the methods mentioned earlier, IA produces very high specificity for enriching or depleting a selective population of EVs from serum, plasma, and other biofluids.
3.2. Validation of isolated BEVs
Before isolated BEVs can be examined for discovery of novel biomarkers, it is essential that the quality of each preparation be validated. Box 1 provides a summary of ISEV recommended points to be addressed to validate isolation of BEVs from blood plasma (or serum). In Box 2 we first provide an idealized example of EV/BEV isolation from plasma, its characterization, followed by EV/BEV lysis and biomarker analysis (Figure 1). Also provided in Box 2 is a checklist of some of the mandatory criteria needed for characterization of plasma‐isolated EVs (including BEVs).
Figure 1.
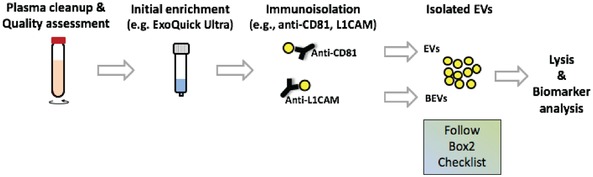
Workflow for immuno‐isolation of EVs and BEVs from plasma. Typical workflow involves plasma cleanup (through low centrifugation spins) followed by optional initial enrichment of EVs using commercial kits. The isolates are then used for immuno‐isolation of total EVs (using for example CD81 antibodies) and/or BEVs (using for example anti‐L1CAM antibodies). Post‐isolation EVs and/or BEVs should be characterized using the below‐provided MISEV2018 checklist. Thereafter they can be lysed and biomarker analysis performed
3.3. Methods for discovery of novel biomarkers in BEVs
Once the isolation of BEVs has been confirmed, the BEV preparations can be explored further for additional molecular biomarkers. Several methods can be used to examine various molecular components within the EVs, including RNAs, proteins, lipids, and metabolites. With the advancements in next‐generation RNA sequencing (RNAseq) analysis and microfluidics‐based single‐cell RNAseq analysis, the examination of BEVs to discover novel disease‐specific RNA biomarkers is an attractive choice. For example, several groups have demonstrated an increased EV response associated with altered miR profiles in the blood of AD patients.15
BOX 2
Checklist for mandatory criteria needed for characterization of EVs isolated from plasma (adapted from MISEV2018 guidelines 9)
Note that examples of proteins provided are from the MISEV2018 guidelines, although other proteins that fall into the provided categories can be used.
- Quantification of EVs
-
1.1Volume of plasma
-
□Plasma volume used to isolate EVs
-
□
-
1.2Global quantification(check at least two methods)
-
□Particle number per volume of plasma (eg, nanoparticle tracking analysis)
-
□Protein amount per volume of plasma (eg, global protein stain on sodium dodecyl sulfate ‐ polyacrylamide gel electrophoresis [SDS‐PAGE])
-
□Others as defined in MISEV2018
-
□
-
1.3Ratio of the two global quantification values
-
□Calculate ratio (provides purity metrics)
-
□
-
1.1
- Global characterization of EVs—by their protein composition
-
2.1Transmembrane/Glycosylphosphatidylinositol ‐anchored protein localized on the plasma membrane(presence demonstrates the lipid‐bilayer structure specific of EVs, check at least one)Non‐tissue specific (applies to all EVs)
-
□Tetraspanins (eg, CD63, CD81, CD82)
-
□Major histocompatibility complex (MHC) class I
-
□Integrins
-
□Others as defined in MISEV2018Cell/tissue‐specific proteins
-
□Cell/tissue‐specific tetraspanins (eg, CD37, CD53)
-
□BEV‐specific proteins (can be specific for neurons, astrocytes, etc)
-
□Others as defined in MISEV2018
-
□
-
2.2Cytosolic protein with membrane‐binding or ‐association capacity(demonstrates presence of lipid bilayer enclosed material, check at least one)
-
□Endosomal sorting complexes required for transport (ESCRT)‐I, II, III protein complexes
-
□ALIX protein (programmed cell death 6‐interacting protein, PDCD6IP)
-
□Flotillins, caveolins
-
□Heat shock proteins (HSPA8, HSP90AB1, HSPA1A)
-
□Others as defined in MISEV2018
-
□
-
2.3Depletion of abundant serum protein contaminants—negative markers(to assess the degree of purity of the EV preparation, check at least one)
-
□Albumin
-
□Apolipoprotein APOB, APOA1, APOA2
-
□
-
2.4[OPTIONAL] Proteins other than plasma membrane or endosome(for proteins localized in/on subcellular compartments, check only if applicable)
-
□Histones (nucleus)
-
□Mitochondria (cytochrome C1)
-
□Endoplasmic reticulum, Golgi (calnexin)
-
□Others as defined in MISEV2018
-
□
-
2.5[OPTIONAL] EV‐bound secreted proteins(check only if applicable)
-
□Cytokines, growth factors, extracellular matrix proteins
-
□Others as defined in MISEV2018
-
□
-
2.1
- Single EV analysis
-
3.1Image‐based analysis of single EVs by wide‐field and close‐up(check at least one)
-
□Electron microscopy
-
□Scanning probe microscopy
-
□Super‐resolution fluorescence microscopy
-
□Others as defined in MISEV2018
-
□
-
3.2Non–image‐based method analyzing large numbers of single EVs(check at least one)
-
□Nanoparticle tracking analysis (NTA)
-
□High‐resolution flow cytometry
-
□Multi‐angle light‐scattering
-
□Others as defined in MISEV2018
-
□
-
3.1
Protein‐based biomarkers are also attractive because they are stable and less prone to contamination compared to RNA‐based biomarkers, and can be transferred to ligand‐based assays for clinical testing. Although western blotting and other immuno‐based methods (eg, immunocyto/histochemistry) can be used to identify and validate one protein marker at a time from a known list of markers, MS‐based proteomics methods are ideal for discovery of novel protein biomarkers (Figure 2).
Figure 2.
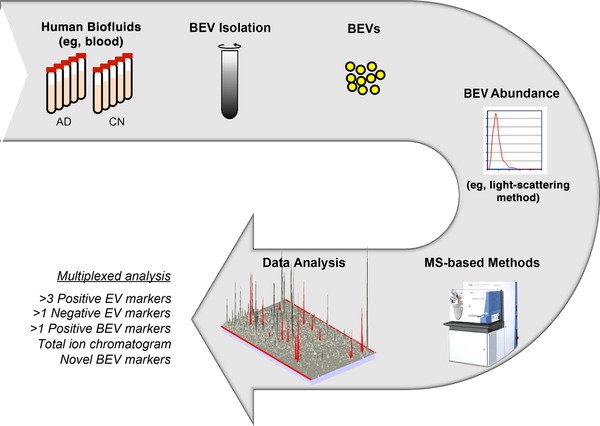
Example workflow of BEV isolation, validation, and novel biomarker identification using mass spectrometry
The high sensitivity, absolute identification, multiplexing, and quantification capabilities of advanced mass spectrometers give them an immense advantage over other methods to validate a large number of proteins (>50)16 within a minute sample size in a single run. That is, these methods can basically address almost all of the recommendations of ISEV by not just identifying/quantifying many negative and positive markers of EVs and BEVs, but also by simultaneously discovering novel protein markers within a typical 2 hour run.17 In addition, newly discovered brain‐derived protein markers (such as those reported by18, 19, 20) can be simultaneously validated by these methods in the isolated BEVs. Furthermore, lipids and metabolites from EVs can also be identified and quantified by various MS‐based methods to identify additional novel biomarkers in various BEVs. Integrated approaches21 for simultaneous isolation of RNA, proteins, lipids, and metabolites followed by RNAseq analysis and multiple MS analyses can therefore enable a more complete understanding and effective investigation22 of complex biological systems within EVs.
4. EVs AND BEVs IN BLOOD IN ALZHEIMER'S DISEASE
We have identified and reviewed 26 original articles5, 15, 23, 24, 25, 26, 27, 28, 29, 30, 31, 32, 33, 34, 35, 36, 37, 38, 39, 40 that compare and contrast EVs and/or BEVs isolated from blood (plasma or serum) in AD patients and cognitively normal (CN) individuals. To date, BEVs in blood plasma or serum assessed for their biomarker potential in AD stem from four main brain components: neurons, neural precursor cells, astrocytes, and the brain vasculature (the latter assessed only in a mouse model of AD) (Figure 3). In Sections 4.1 to 4.4, we review and synthesize findings from BEVs isolated from blood in AD from the four above‐mentioned categories. Of these, neuron‐derived BEVs have been intensely investigated (16 of 26 articles) on several fronts, and these include levels of amyloid‐β (Aβ; as well as proteins in the amyloid‐generating pathway) and tau proteins; synaptic proteins; brain insulin resistance‐associated proteins; lysosomal proteins; and transcription factors. Furthermore, in Section 4.5, we review the literature on AD‐associated miR cargo of blood‐isolated EVs.
Figure 3.
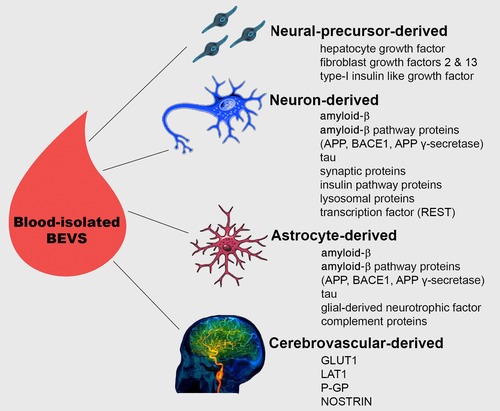
Blood‐isolated BEVs. Presented is a schematic overview of BEVs derived from three brain‐specific cells (neural precursor cells, neurons, and astrocytes) that have been isolated from blood in humans, and their content evaluated as potential biomarkers of Alzheimer's disease (AD). Although cerebrovascular‐derived BEVs have not yet been investigated in the context of AD, they have been successfully isolated from blood in humans via sequential immunoprecipitations and vascular endothelial‐specific antibodies, demonstrating that such studies are feasible. Given that damage to the cerebrovascular system is an early feature of AD, appearing years before clinical symptoms,41, 42 we recommend that future studies, in addition to the already examined BEVs, should also investigate the biomarker potential of cerebrovascular‐derived BEVs
4.1. Neuron‐derived BEVs in blood
4.1.1. Alterations in amyloid‐β and tau levels
Aβ and tau are well‐established AD biomarkers.43, 44 In the CSF, low Aβ42 levels is assumed to be a consequence of increased fibrillar‐Aβ deposition in the brain, whereas elevated levels of phosphorylated tau (ptau) and total tau (t‐tau) indicate increased brain tau pathology (neurofibrillary tangles).44, 45, 46 At present there is considerable interest in investigating the biomarker potential of Aβ and tau levels in blood‐isolated BEVs, considered to be “liquid biopsies” of brain tissue.
Eight studies investigated Aβ and/or tau levels in blood‐isolated neuron‐derived BEVs. Neuron‐derived BEVs was isolated from plasma in seven of these studies,25, 28, 30, 33, 34, 35, 37 and from serum in one study.47 Six studies performed immunochemical enrichment for neuron‐derived BEVs using L1CAM, one study used neural cell adhesion molecule (NCAM or CD56),25 and one study used both LICAM and NCAM.37
The five studies investing Aβ42 protein levels in plasma‐isolated neuron‐derived BEVs25, 30, 33, 35, 37 reported significantly elevated Aβ42 levels in AD dementia and/or mild cognitively imapired (MCI) patients, relative to CN individuals. Four of the five studies30, 33, 35, 37 were performed by a single group or in collaboration with a member of the group, and followed similar protocols for extraction of EVs and enrichment of neural‐derived BEVs. Next we discuss some additional key findings on Aβ42 protein levels in plasma‐isolated neuron‐derived BEVs reported by these studies. Using a longitudinal cohort, Fiandaca et al.37 demonstrated increased (relative to CN individuals) Aβ42 levels in plasma‐isolated neuron‐derived BEVs as early as 10 years before an AD dementia diagnosis. This finding, together with the observation that Aβ42 levels increased with time (preclinical timepoint <MCI or AD dementia timepoints) suggest that Aβ42 levels in plasma‐isolated neuron‐derived BEVs have the potential to be used both as an early biomarker of AD, as well as a marker of AD progression. Furthermore, in their 2016 study, Winston et al.35 reported significantly higher Aβ42 levels in plasma‐isolated neuron‐derived BEVs in individuals with AD dementia and MCI converting to AD dementia (within 3 years) compared to stable MCI and CN individuals. Given that all MCI individuals included in the study had CSF evidence of cerebral amyloid pathology, considered a biomarker of AD pathogenic change,43 the study suggests that Aβ42 levels in plasma‐isolated neuron‐derived BEVs may be able to discriminate a subset of MCI patients that progress to AD dementia within 3 years, that is, within the time frame set by the majority of clinical trials. We did note, however, that the MCI to AD dementia convertors were slightly older in age (mean age: 75.35 ± 6.82 MCI convertors vs 68.70 ± 7.76 stable MCI). Given that the incidence of AD increases with age, additional studies in larger age‐matched MCI subgroups (ie, convertors vs non‐convertors) are needed before a strong conclusion can be reached on this topic. Overall, the five studies indicate that Aβ42 levels in blood‐isolated neuron‐derived‐BEVs have the potential to serve as a novel AD biomarker. Whether it will make for a more sensitive biomarker than the currently used CSF Aβ42 levels warrants additional investigations, although a recent study by Jia et al.25 suggests that Aβ42 levels in neuron‐derived BEVs have the same capacity as those in CSF for the diagnosis of AD and MCI. It should be noted that unlike the inverse relationship between CSF Aβ42 level and brain amyloidosis, Aβ42 level in neuron‐derived BEVs directly reflects brain Aβ load. Although multiple lines of evidence supports this claim, the most salient ones are as follows: (1) neuronal BEVs sequester Aβ; and (2) in the AD brain, neuronal BEVs are enriched with Aβ and have been demonstrated to facilitate short‐ and long‐distance spread of Aβ species.48 In addition to Aβ, neuron‐derived BEVs in plasma have been reported to contain proteins belonging to the Aβ‐generating pathway, such as soluble amyloid precursor protein β (sAPPβ) and α (sAPPα), β‐site amyloid precursor protein‐cleaving enzyme 1 (BACE‐1), and γ‐secretase.33 To date, only levels of sAPPβ and sAPPα have been reported as elevated in AD dementia + MCI individuals compared to CN.33
From a robust biomarker perspective, it is important to note that neuron‐derived BEV levels of Aβ42 (or levels of Aβ42 in combination with Aβ‐generating pathway proteins) by itself cannot discriminate between individuals who are on the AD continuum and those who are CN (and may never develop AD) but amyloid positive. Better discrimination (from amyloid‐positive CN individuals) might be attained with a panel of BEV cargo proteins that in combination captures key features of the complex, multifactorial pathology of AD. Such approaches are currently being applied in AD‐associated genomics and metabolomics research.49 We recommend that proposed panel(s) of BEV cargo proteins be in sync with the recently proposed AT(N) criteria,43 that is, that the panel of proteins include Aβ, tau, protein markers of neurodegeneration, and other relevant AD pathophysiology proteins.
Next we discuss seven studies investigating tau levels in plasma‐25, 28, 30, 34, 35, 37 or serum‐isolated47 neuron‐derived BEVs. Four of the seven tau studies28, 30, 35, 37 were performed by a single group or in collaboration with a member of the group. Relative to CN individuals, elevated ptau levels (detected using P‐S396‐tau and/or P‐T181‐tau ELISA) was reported in AD dementia25, 35, 37 and MCI individuals,25, 37 individuals converting from MCI to AD dementia within 3 years,35 as well as in preclinical individuals diagnosed with AD dementia within 10 years.37 Fiandaca et al.37 reported that unlike Aβ42 level, tau levels (P‐S396‐tau and P‐T181‐tau) plateaued as early as 10 years before AD diagnosis,37 making it less attractive as a marker of AD progression (given reproducibility of this finding in future studies). In an additional three studies,28, 30, 34 although different tau fragments (P‐S396‐tau,30 P‐T181‐tau,28, 34 full‐length‐tau,28, 34 and mid‐region‐tau28) were detected in plasma‐isolated neuron‐derived BEVs, no statistical difference from CN was observed in AD dementia28, 34 or MCI28, 30 individuals. Similarly, no statistical difference in tau levels (fragments ending at amino acid 123 and 224) was found between AD dementia and CN individuals in serum‐isolated neuron‐derived BEVs, although it should be noted that the sample size for this comparison was extremely low (N = 4/group).47
At present, the association between tau levels in plasma‐isolated neuron‐derived BEVs and the AD continuum has yet to reach a consensus. Two interrelated factors may be contributing to the lack of agreement. First, the literature suggests that although tau levels in AD are increased in the brain, CSF, and blood, different fragments of tau predominate in the three compartments.45, 46 In a recent study, Chen et al.45 reported increased mid‐region and N‐terminal tau fragments in the CSF of AD patients, as well as an elevated N‐terminal fragment in the plasma. In addition, Sato et al.46 reported that brain neurons both passively and actively release tau fragments to the extracellular space, with the actively released ones tending to comprise the mid‐ to C‐terminus regions of the full‐length tau. However, at present, a consensus on which tau fragment(s) dominate in neuron‐derived BEVs (or BEVs in general) has not been reached,28, 46, 50, 51 making it difficult to choose the appropriate assay(s). Second, the assays being used for tau detection might also be adding to the discord. Currently, tau detected by different assays comprises both overlapping and distinct populations of tau fragments. For example, the P‐T181‐tau assay used by five studies25, 28, 34, 35, 37 employs two mid‐region directed antibodies that are different from the antibody used to detect mid‐region tau by Guix et al.28 The P‐S396‐tau assay targets the C‐terminus of tau. The full‐length tau assay employs two antibodies, one directed to the extreme N‐terminus of tau and the other directed to its extreme C‐terminus.28 Use of such varied antibodies, needless to say, complicates cross‐study comparisons. Adding to this noise, some commercially used tau assays employing mid‐region–directed antibodies have been erroneously referred to as total tau assays.28, 45 Moreover, tau detection sensitivity of the commercially used ELISA assays is also being debated, with some studies reporting them as low.34, 45 Given these various facets to assessing tau levels in blood‐isolated neuron‐derived BEVs, additional studies are clearly needed to position it as a blood‐based biomarker for AD.
4.1.2. Reductions in synaptic protein levels
Synaptic dysfunction is an early phenomenon in AD.52, 53 Five studies investigated cargo synaptic proteins in plasma26, 30, 32, 35 or serum‐isolated23 neuron‐derived BEVs. All five studies enriched for neuron‐derived BEVs using L1CAM. Note that the four studies conducted in plasma were performed by members of the same group.
Neuronally derived BEV levels of the post‐synaptic protein neurogranin were reported as reduced in individuals with AD dementia32 and MCI,30 relative to CN. Reduced neurogranin levels in neuron‐derived BEVs were also reported in individuals converting from MCI to AD dementia within 36 months, compared to CN and stable MCI.35 Synaptic proteins synaptotagmin, synaptopodin, and synaptophysin were also reported reduced in neuron‐derived BEVs in AD dementia32 and MCI30 individuals. However, given that reductions in neurogranin, synaptotagmin, synaptopodin, and synaptophysin are not unique to AD, but have also been reported in Parkinson disease,32 their biomarker potential to uniquely identify patients in the AD continuum appears low. Reduced levels of the growth‐associated protein 43 (GAP43) was observed in AD dementia,32 but not in MCI.30 Although these findings suggest that GAP43 may be a promising marker for MCI convertors, this clearly needs to be demonstrated in future studies.
Next we discuss synaptic proteins only interrogated by a single study. Levels of the synaptosomal‐associated protein‐25 (SNAP‐25)23 and synapsin 132 were reported reduced in blood‐isolated, neuron‐derived BEVs of AD dementia patients, relative to CN. Cognitive impairment assessed using Mini‐Mental State Exam (MMSE) scores correlated positively with SNAP‐25 levels.23 Interactions between pre‐ (neuronal pentraxin 2, neurexin 2α) and post‐ (eg, GluA4‐containing glutamate receptor, neuroligin 1) synaptic proteins is crucial for proper synapse formation and function.26 The above four proteins were significantly reduced in neuron‐derived BEVs of AD dementia patients, with the postsynaptic proteins levels correlating with cognitive loss. In a longitudinal cohort, with the exception of neuronal pentraxin 2, significant protein level reductions were observed in the preclinical period (6‐11 years before dementia onset), relative to CN individuals.26 Because levels of all four proteins in the longitudinal cohort declined significantly with the development of AD dementia, they hold promise as biomarkers of AD progression.
Overall, given that reductions in synaptic protein levels in AD (AD dementia and/or MCI) was reported across all five studies, one could comment that as a group, synaptic proteins in neuron‐derived BEVs demonstrate some biomarker potential. It should be noted, however, that only a handful of these synaptic proteins were investigated by two or more studies. Neurogranin was investigated by three studies,30, 32, 35 and GAP43,30, 32 synaptophysin, synaptotagmin, and synaptopodin30, 32 by two studies. Although we realize that the field is still in its early stages, additional studies are needed to assess the blood‐based biomarker potential of the synaptic protein cargo of neuron‐derived BEVs in AD.
4.1.3. Deregulation of insulin pathway proteins
Accumulating evidence suggests that disrupted brain insulin signaling is a characteristic of AD, and insulin resistance has been put forth as a critical link between the Aβ and tau pathologies in AD.54 Phosphorylation patterns of the insulin‐receptor‐substrate‐1 (IRS‐1) plays a key role in both normal insulin signaling and insulin resistance.31, 54 Two studies assessed the biomarker potential of IRS‐1 in plasma‐isolated, L1CAM, and/or NCAM enriched neuron‐derived BEVs, both by members of the same group.31, 39 Specifically, higher pSer312‐IRS‐1 (ineffective insulin signaling) and lower p‐panTyr‐IRS‐1 (effective insulin signaling) levels were found in BEVs of AD patients31, 39 up to 10 years before clinical onset.39 Neuron‐derived BEV levels of pSer312‐IRS‐1 and p‐panTyr‐IRS‐1 in AD patients were found to associate with gray matter volume, with pSer312‐IRS‐1 negatively associated with brain volume and p‐panTyr‐IRS‐1 positively associated.31 Of interest, the volumetric pattern associated with IRS‐1 variant levels in neuron‐derived BEVs was spatially correlated with brain regions expressing IRS‐1.31 Because of these encouraging findings, IRS‐1 level in blood‐isolated neuron‐derived BEVs was recently used to monitor target engagement of intranasal insulin administration.55
4.1.4. Differential expression of lysosomal proteins
Lysosomal protein levels in plasma‐isolated, L1CAM‐enriched, neuron‐derived BEVs were found to distinguish AD dementia patients from CN individuals, as well as predict (using step‐wise discriminant modeling) AD diagnosis.38 Cross‐sectional investigations demonstrated that levels of cathepsin D, type‐1 lysosome‐associated membrane protein, and ubiquitinated proteins were significantly increased in AD dementia patients, whereas levels of heat‐shock protein‐70 were diminished.38 Using a longitudinal cohort it was determined that levels of the above‐mentioned proteins were different from CN up to 10 years before clinical onset.38 However, because preclinical and clinical levels of these proteins were indistinguishable, it was suggested that neuronal lysosomal dysfunction may be an early event in AD pathogenesis. The three lysosomal proteins increased in AD were also found to be significantly lower in frontotemporal dementia.38 Although additional studies are required, current findings suggest that lysosomal protein levels in neuron‐derived BEVs may aid in delineating AD from other age‐related dementias.
4.1.5. Transcription factor(s) alterations
Neuron‐derived BEVs contain transcription factors that mediate cellular resistance to stress, including that caused by Aβ and tau accumulation. Winston et al.35 assessed the level of repressor element 1‐silencing transcription factor (REST), a key regulator of the stress response in the aging brain, in plasma‐isolated, L1CAM‐enriched neuron‐derived BEVs.35, 56 REST levels in neuron‐derived BEVs were significantly lower in AD dementia patients and MCI to AD converters, compared to stable MCI and CN subjects.35
4.2. Neural precursor cell‐derived BEVs in blood
Diffusely distributed in the brain, chondroitin sulfate proteoglycan (CSPG4) cells are a subtype of neural precursor cell that demonstrates extreme developmental plasticity, and releases neurotrophic factors important for neuronal growth, repair, and survival.24 Protein levels of four assessed neurotrophic factors (hepatocyte growth factor, fibroblast growth factors 2 and 13, and type 1 insulin‐like growth factor) were significantly higher in CSPG4‐derived BEVs, compared to neuron‐ and astrocyte‐derived BEVs.24 All three BEV types were isolated from blood plasma. Reductions in neurotrophic factor levels in CSPG4‐derived BEVs appeared in preclinical AD, with no significant decreases later in the disease course.24
4.3. Astrocyte‐derived BEVs in blood
Astrocyte‐derived BEVs isolated from blood plasma have the same size characteristics as neural‐derived BEVs.33 However, significantly fewer of them were detected in blood plasma compared to their neural‐derived counterparts.33 Similar to neuron‐derived BEVs, astrocyte‐derived BEVs have been reported to cargo AD hallmark proteins tau (P‐T181‐tau and P‐S396‐tau) and Aβ42 (soluble), as well as APP pathway proteins sAPPβ, sAPPα, BACE‐1, and γ‐secretase.33 In both AD patients and CN individuals, levels of all the above‐reported proteins were significantly higher in astrocyte‐derived BEVs compared to neuron‐derived BEVs.33 However, only levels of BACE‐1 and sAPPβ were significantly higher, and that of glial‐derived neurotrophic factor (GDNF) was significantly lower in astrocyte‐derived BEVs of patients with AD than in CN.33 High levels of complement proteins were also reported in astrocyte‐derived BEVs of AD patients, relative to CN.27
4.4. Cerebrovascular‐derived BEVs in blood
Cerebrovascular dysfunction is an early event in AD.42 Levels of cerebrovascular proteins known to be ferried by cerebrovascular‐derived BEVs across the BBB were reported deregulated in a mouse model of AD.19 However, studies assessing cerebrovascular‐derived BEVs and their cargo in human AD patients are sparse at best, making it an area ripe for investigation. We found one non‐AD study reporting on cerebrovascular‐derived BEVs in human, indicating that these BEVs can be isolated from blood by sequential immunoprecipitations and vascular endothelial–specific antibodies (CD3 and CD146). The authors found that concentrations of four cerebrovascular‐derived BEV cargo proteins, GLUT1, large neutral amino acid transporter (LAT1), P‐glycoprotein 1 (P‐GP), and nitric oxide synthase trafficker (NOSTRIN), were significantly higher in CN adults with white matter hyperintensities (WMHs) relative to those without.57 Higher levels of all four proteins associated with lower cognitive function, irrespective of WMH burden. Moreover, LAT1 and P‐GP levels were inversely associated with MRI‐detected global gray matter volumes, whereas GLUT1, LAT‐1, and P‐GP concentrations were significantly associated with systemic interleukin 6 levels.
4.5. Alzheimer's disease–associated microRNA cargo of blood‐isolated EVs
MicroRNAs (or miRs) are endogenous, short (≈22 ribonucleotide), non‐coding RNAs that can act as post‐transcriptional regulators of gene expression. They typically do so by interacting with ribonucleotides via complementary base‐pairs located within the 3' untranslated region (3'‐UTR) of target messenger RNAs (mRNAs). A multitude of EV‐associated miRs have been registered in open‐access databases such as ExoCarta and Vesiclepedia. To date, five studies have reported a total of 39 differentially expressed plasma‐5 or serum‐isolated15, 29, 36, 40 EV‐associated miRs in AD dementia and/or MCI cohorts, relative to CN individuals.
Twenty‐two of the 39 EV‐associated miRs are predicted to bind to one or more mRNAs of AD‐associated genes, namely, APP, PSEN1, BACE1, and several of the top 10 genes in the AlzGene database (APOE, BIN1, CLU, ABCA7, CR1, PICALM, MS4A6A, CD33, MS4A4E, CD2AP) (see Table 1). Only three miRs, however, were reported by at least two studies and are as follows: downregulated expression of miR‐193b15, 40 and miR‐342‐3p,5, 36 and both an increase36 and a decrease5 in miR‐3065‐5p level. Reduction in miR‐193b expression was greater in AD dementia compared to MCI.40 Given that miR‐193b is known to bind to APP 40 and PSEN1 58 mRNAs and repress their expression, its reduction may promote amyloidosis. miR‐342‐3p is highly expressed in the human brain,58 and its binding to the 3′‐UTR of protein phosphatase 2 (PP2A) and phosphatase and tensin homolog (PTEN) is predicted to affect tau phosphorylation and aggregation.59
Table 1.
Differentially expressed EV‐associated miRs in AD
| Exosome | ||||||||||||
|---|---|---|---|---|---|---|---|---|---|---|---|---|
| Publication | miR | Change direction | Blood | CSF | APP | BACE1 | PSEN1 | CLU | CR1 | PICALM | MS4A6A | CD2AP |
| Wei et al. 2018 | 223 | Down | x | x | x | |||||||
| Yang et al. 2018 | 135a | Up | xx | x | ||||||||
| 193b | Down | x | x | xx | xx | |||||||
| 384 | Up | xx | x | x | ||||||||
| Cheng et al. 2015 | 361‐5p | Up | x | x | x | |||||||
| 30e‐5p | Up | x | x | x | x | |||||||
| 93‐5p | Up | x | x | x | ||||||||
| 15a‐5p | Up | x | x | x | x | x | x | |||||
| 143‐3p | Up | x | x | x | ||||||||
| 335‐5p | Up | x | x | |||||||||
| 106b‐5p | Up | x | x | x | ||||||||
| 101‐3p | Up | x | x | x | ||||||||
| 424‐5p | Up | x | x | x | x | x | ||||||
| 106a‐5p | Up | x | x | |||||||||
| 18b‐5p | Up | x | ||||||||||
| 3065‐5p | Up | x | x | x | x | |||||||
| 20a‐5p | Up | x | x | x | ||||||||
| 582‐5p | Up | x | ||||||||||
| 1306‐5p | Down | x | ||||||||||
| 342‐3p | Down | x | x | |||||||||
| 15b‐3p | Down | x | ||||||||||
| Lugli et al. 2015 | 23b‐3p | Down | x | x | ||||||||
| 24‐3p | Down | x | x | |||||||||
| 29b‐3p | Down | x | x | x | x | |||||||
| 125b‐5p | Down | x | x | |||||||||
| 138‐5p | Up | x | x | |||||||||
| 139‐5p | Down | x | x | |||||||||
| 141‐3p | Down | x | x | x | x | |||||||
| 150‐5p | Down | x | x | |||||||||
| 152‐3p | Down | x | x | x | x | |||||||
| 185‐5p | Down | x | x | x | x | x | ||||||
| 338‐3p | Down | x | x | |||||||||
| 342‐3p | Down | x | x | |||||||||
| 342‐5p | Down | x | x | |||||||||
| 548at‐5p | Up | x | x | x | x | |||||||
| 659‐5p | Up | x | x | |||||||||
| 3065‐5p | Down | x | x | x | x | |||||||
| 3613‐3p | Down | x | x | x | ||||||||
| 3916 | Down | xx | ||||||||||
| 4772‐3p | Down | x | ||||||||||
| 5001‐3p | Up | x | x | x | ||||||||
| Liu et al. 2014 | 193b | Down | x | x | xx | xx | ||||||
Information on if the EV‐associated miRs in blood are also detected in CSF was gathered from ExoCarta (http://exocarta.org/) and Vesiclepedia (microvesicles.org). “xx” indicates that the information was present in one (or more) of the articles cited in this review, but not in the two above‐mentioned databases. Information on predicted binding of miRs to AD‐associated genes was collected from the miRDB database (http://mirdb.org/). A total of 14 genes (APP, APOE, BACE1, PSEN1, PSEN2, BIN1, CLU, ABCA7, CR1, PICALM, MS4A6A, CD33, MS4A4E, CD2AP) were researched using the miRDB database, but no miR‐gene interaction was reported for APOE, PSEN2, BIN1, ABCA7, CD33, and MS4A4E. These genes have thus been removed from Table 1.
Blood‐isolated EV‐associated miRs have been reported to aid early diagnosis in AD, as well as to discriminate between dementia conditions. Using multivariate logistic regression, Yang et al.15 demonstrated that a combination of three miRs (135a, 193b, and 384) known to modulate amyloidosis by regulating the expression of APP and/or BACE‐1, proved better for early AD diagnosis (MCI), than each miR alone. With regard to discrimination between AD and other dementia conditions: miR‐384 was reported to discriminate AD from vascular and Parkinson disease dementia;15 and miR‐223 level differed between AD dementia and vascular dementia cohorts.29 miR‐223 regulates inflammation by interacting with different targets.29 The level of miR‐223 was significantly correlated with MMSE, Clinical Dementia Rating scores, magnetic resonance spectroscopy metabolite ratios (N‐acetyl aspartate/creatine, myo‐inositol/creatine) and serum concentrations of interleukin 1 β and 6, tumor necrosis factor α, and C‐reactive protein.
Overall, differentially expressed miRs in blood‐isolated EVs have the potential to provide additional insights into AD mechanisms and aid early diagnosis. It should be noted, however, that the five studies discussed above did not separate the EVs based on cellular source (eg, BEVs). Given that the cellular source of an EV impacts its cargo, future studies should investigate differentially expressed miRs in blood‐isolated BEVs (eg, neuron‐derived BEVs, astrocyte‐derived BEVs) associated with AD.
5. BLOOD‐ISOLATED BEV–BASED EVALUATION OF AD THERAPEUTICS
To date, two published clinical trials in MCI and/or AD dementia patients have reported blood‐isolated BEV–based evaluation of drug treatment. The first trial tackled brain insulin resistance, known to contribute to AD pathogenesis. Several studies have reported that intranasal insulin is effective in improving or preserving cognition in MCI and early AD dementia patients.55 In a 4‐month, phase II randomized double‐blind placebo‐controlled trial of intranasal insulin administration, Mustapic et al.55 examined cargo proteins of neuron‐derived BEVs from amnestic MCI and probable AD individuals to assess engagement of the brain insulin cascade. Levels of IRS‐1 that facilitate downstream signaling upon binding of insulin to its receptor were assessed. Levels of other key downstream proteins were also assessed. Upon completion of treatment, change from baseline in neuron‐derived BEV‐associated insulin‐signaling molecules was associated with a change in cognition, suggesting engagement of the insulin cascade in the brain. The authors further noted that neuron‐derived BEV cargo proteins demonstrated good intra‐subject stability over time (4 months) in the placebo group.55 The second clinical trial evaluated the effect of somatotropin treatment. Cognitive changes with age have been linked to decreased expression of somatotropins (eg, growth hormone‐releasing hormone [GHRH]), and pathologically decreased levels may predispose to AD.30 A randomized, double‐blind, placebo‐controlled 20‐week trial of GHRH administration (via subcutaneous injections) increased the reduced levels of synaptophysin and synaptotagmin in neuron‐derived BEVs from MCI patients, but had no significant effect on amyloid and tau levels.30
Moreover, 119 registered clinical trials (clinicaltrials.gov, searched May 31, 2019) mention EVs (primarily exosomes) in their description, highlighting the rising popularity of EV‐based measurements in trial settings. Although the majority of these trials target cancer, 16 target AD risk factors, such as heart‐brain axis conditions (eg, ischemic stroke, diabetes mellitus, and hypertension) and aging itself. Two studies investigating AD include blood‐isolated EV‐based assessments in their outcome measures: NCT01811381 assessing “Curcumin and yoga therapy for those at risk for Alzheimer's disease,” and NCT03275363 reporting on the “The University of Hong Kong Neurocognitive Disorder Cohort.”
Bidirectional BBB crossings by EVs facilitate the ferrying of biologically active molecules between the brain and the body.60 Therefore, in addition to the monitoring of therapeutic effects, EVs (including BEVs) can be used as a drug delivery system to the brain. Although not a focus of this review, studies assessing EV‐based therapeutics are being carried out in animal models of AD, and might open a new horizon for therapeutic strategies in AD patients.
6. CONCLUSIONS
We comprehensively reviewed the published literature on the biomarker potential of blood‐isolated EVs, in particular BEVs, in AD patients. Given the relative newness of the BEV field in AD we also provided an overview of BEV isolation and validation methods that adhere to the ISEV guidelines and discussed how these methods variably balance recovery and specificity of EVs and BEVs. In fact, it is crucial that each EV/BEV preparation be validated for quality before they are explored for AD‐associated markers.
To date, neuron‐derived, neural precursor cell–derived and astrocyte‐derived BEVs in blood have been assessed for their biomarker potential in AD patients. The majority of studies have been performed by a single group (or in collaboration with a member of the group) using relatively similar protocols. Neuron‐derived BEVs have been the most intensely investigated, with the majority of studies interrogating levels of Aβ42 and tau (hallmark AD proteins), and synaptic proteins. Elevated Aβ42 levels in blood‐isolated neuron‐derived BEVs have been consistently reported in AD dementia and MCI patients, with one study further reporting elevated Aβ42 levels early in the course of the disease (preclinical timepoints) and its continued increase with disease progression. Although additional studies using larger sample sizes are needed, these findings indicate that Aβ42 levels in neuron‐derived BEVs have the potential to be used as a blood‐based biomarker for early detection and maybe even disease progression in AD. On the other hand, tau levels in blood‐isolated neuron‐derived BEVs in AD were reported increased by some studies but not others. This lack of consensus might stem in part from the choice of tau fragments interrogated and to the limited sensitivity of certain assays employed. Neither Aβ42 nor tau levels were elevated in blood‐isolated astrocyte‐derived BEVs of AD dementia and MCI patients (relative to CN), although elevated levels of two proteins in Aβ‐generating pathway (BACE‐1, APPβ) were reported. Levels of Aβ42 and tau were not interrogated in neural precursor cell‐derived BEVs. With regard to synaptic proteins, although several were assessed in neuron‐derived BEVs, only five were assessed in two or more studies. Of these, GAP43 showed some potential as a marker of AD progression.
In summary, we note that blood‐isolated BEVs have emerged as a novel player in the study of AD, with enormous potential as a blood‐based biomarker. They are starting to be used to evaluate target engagement in AD drug trials and are also being evaluated on their ability to cross the BBB and deliver drugs to the brain (the latter in animal models of AD, currently). However, the field is still in its early stages, and much work remains to be done (larger sample sizes, independent replication, protocol standardization, and so on) before BEV proteins (or other cargo such as miRs) with reported biomarker potential can be applied clinically at the individual level. Future work should aim to establish normative ranges for levels of BEV proteins with biomarker potential, and work to derive cutoffs indicating pathology that may eventually find clinical applications. In addition to neurons, studies are also needed on BEVs derived from other brain components affected early in AD, such as the cerebrovasculature, which currently lacks blood‐isolated BEV–based investigations in AD patients. Such studies, will allow, for example, the development of BEV cargo proteins panel(s) that better captures the key features of the complex, multifactorial pathology of AD, and make for more sensitive blood‐based biomarkers.
Supporting information
Supporting Information
ACKNOWLEDGMENT
We would like to thank Dr. Sridar Narayanan for helpful comments on the manuscript.
Badhwar A, Haqqani AS. Biomarker potential of brain‐secreted extracellular vesicles in blood in Alzheimer's disease. Alzheimer's Dement. 2020;12:e12001 10.1002/dad2.12001
Funding information
This review was performed by a member (A.B.) of the Biomarkers Team of the Canadian Consortium on Neurodegeneration in Aging (CCNA), which is funded by the Canadian Institutes of Health Research (CIHR) and partners. In addition, A.B. is supported by a CIHR Postdoctoral Fellowship (funding reference number #152548) and the Courtois Foundation.
REFERENCES
- 1. Kalra H, Drummen GPC, Mathivanan S. Focus on extracellular vesicles: introducing the next small big thing. Int J Mol Sci. 2016;17:170. [DOI] [PMC free article] [PubMed] [Google Scholar]
- 2. Dinkins MB, Wang G, Bieberich E. Sphingolipid‐enriched extracellular vesicles and Alzheimer's disease: a decade of research. J Alzheimers Dis. 2017;60:757–768. [DOI] [PMC free article] [PubMed] [Google Scholar]
- 3. Rajendran L, Honsho M, Zahn TR, et al. Alzheimer's disease beta‐amyloid peptides are released in association with exosomes. Proceedings of the National Academy of Sciences. 2006;103:11172‐11177. [DOI] [PMC free article] [PubMed] [Google Scholar]
- 4. Musunuri S, Khoonsari PE, Mikus M, et al. Increased levels of extracellular microvesicle markers and decreased levels of endocytic/exocytic proteins in the Alzheimer's disease brain. J Alzheimers Dis. 2016;54:1671–1686. [DOI] [PubMed] [Google Scholar]
- 5. Lugli G, Cohen AM, Bennett DA, et al. Plasma exosomal miRNAs in persons with and without Alzheimer disease: altered expression and prospects for biomarkers. PLoS One. 2015;10:e0139233. [DOI] [PMC free article] [PubMed] [Google Scholar]
- 6. Chivet M, Hemming F, Pernet‐Gallay K, Fraboulet S, Sadoul R. Emerging role of neuronal exosomes in the central nervous system. Front Physiol. 2012;3:145. [DOI] [PMC free article] [PubMed] [Google Scholar]
- 7. Peng KY, Pérez‐González R, Alldred MJ, et al. Apolipoprotein E4 genotype compromises brain exosome production. Brain. 2019;142:163–175. [DOI] [PMC free article] [PubMed] [Google Scholar]
- 8. Eitan E, Hutchison ER, Marosi K, et al. Extracellular vesicle‐associated Aβ mediates trans‐neuronal bioenergetic and Ca2+‐handling deficits in Alzheimer's disease models. NPJ Aging Mech Dis. 2016;2 10.1038/npjamd.2016.19. [DOI] [PMC free article] [PubMed] [Google Scholar]
- 9. Théry C, Witwer KW, Aikawa E, et al. Minimal information for studies of extracellular vesicles 2018 (MISEV2018): a position statement of the international society for extracellular vesicles and update of the MISEV2014 guidelines. J Extracell Vesicles. 2018;7:1535750. [DOI] [PMC free article] [PubMed] [Google Scholar]
- 10. Fiandaca MS, Mapstone ME, Cheema AK, Federoff HJ. The critical need for defining preclinical biomarkers in Alzheimer's disease. Alzheimers Dement. 2014;10:S196–S212. [DOI] [PubMed] [Google Scholar]
- 11. Witwer KW, Buzás EI, Bemis LT, et al. Standardization of sample collection, isolation and analysis methods in extracellular vesicle research. J Extracell Vesicles. 2013;2 10.3402/jev.v2i0.20360. [DOI] [PMC free article] [PubMed] [Google Scholar]
- 12. Vanlandewijck M, He L, Mäe MA, et al. A molecular atlas of cell types and zonation in the brain vasculature. Nature. 2018;554:475–480. [DOI] [PubMed] [Google Scholar]
- 13. Darmanis S, Sloan SA, Zhang Y, et al. A survey of human brain transcriptome diversity at the single cell level. Proc Natl Acad Sci U S A. 2015;112:7285–7290. [DOI] [PMC free article] [PubMed] [Google Scholar]
- 14. Filipe V, Hawe A, Jiskoot W. Critical evaluation of Nanoparticle Tracking Analysis (NTA) by NanoSight for the measurement of nanoparticles and protein aggregates. Pharm Res. 2010;27:796–810. [DOI] [PMC free article] [PubMed] [Google Scholar]
- 15. Yang TT, Liu CG, Gao SC, Zhang Y, Wang PC. The serum exosome derived MicroRNA‐135a, ‐193b, and ‐384 were potential Alzheimer's disease biomarkers. Biomed Environ Sci. 2018;31:87–96. [DOI] [PubMed] [Google Scholar]
- 16. Paterson RW, Heywood WE, Heslegrave AJ, et al. A targeted proteomic multiplex CSF assay identifies increased malate dehydrogenase and other neurodegenerative biomarkers in individuals with Alzheimer's disease pathology. Transl Psychiatry. 2016;6:e952. [DOI] [PMC free article] [PubMed] [Google Scholar]
- 17. Haqqani AS, Delaney CE, Tremblay T‐L, Sodja C, Sandhu JK, Stanimirovic DB. Method for isolation and molecular characterization of extracellular microvesicles released from brain endothelial cells. Fluids Barriers CNS. 2013;10:4. [DOI] [PMC free article] [PubMed] [Google Scholar]
- 18. Yu L, Petyuk VA, Gaiteri C, et al. Targeted brain proteomics uncover multiple pathways to Alzheimer's dementia. Ann Neurol. 2018;84:78–88. [DOI] [PMC free article] [PubMed] [Google Scholar]
- 19. Badhwar A, Brown R, Stanimirovic DB, Haqqani AS, Hamel E. Proteomic differences in brain vessels of Alzheimer's disease mice: normalization by PPARγ agonist pioglitazone. J Cereb Blood Flow Metab. 2016. 10.1177/0271678X16655172. [DOI] [PMC free article] [PubMed] [Google Scholar]
- 20. Badhwar A, Stanimirovic DB, Hamel E, Haqqani AS. The proteome of mouse cerebral arteries. J Cereb Blood Flow Metab. 2014;34:1033–1046. [DOI] [PMC free article] [PubMed] [Google Scholar]
- 21. Nakayasu ES, Nicora CD, Sims AC, et al. MPLEx: A robust and universal protocol for single‐sample integrative proteomic, metabolomic, and lipidomic analyses. mSystems. 2016;1 10.1128/mSystems.00043-16. [DOI] [PMC free article] [PubMed] [Google Scholar]
- 22. Cambiaghi A, Díaz R, Martinez JB, et al. An innovative approach for the integration of proteomics and metabolomics data in severe septic shock patients stratified for mortality. Sci Rep. 2018;8:6681. [DOI] [PMC free article] [PubMed] [Google Scholar]
- 23. Agliardi C, Guerini FR, Zanzottera M, Bianchi A, Nemni R, Clerici M. SNAP‐25 in serum is carried by exosomes of neuronal origin and is a potential biomarker of Alzheimer's disease. Mol Neurobiol. 2019. 10.1007/s12035-019-1501-x. [DOI] [PubMed] [Google Scholar]
- 24. Goetzl EJ, Nogueras‐Ortiz C, Mustapic M, et al. Deficient neurotrophic factors of CSPG4‐type neural cell exosomes in Alzheimer disease. FASEB J. 2019;33:231–238. [DOI] [PMC free article] [PubMed] [Google Scholar]
- 25. Jia L, Qiu Q, Zhang H, et al. Concordance between the assessment of Aβ42, T‐tau, and P‐T181‐tau in peripheral blood neuronal‐derived exosomes and cerebrospinal fluid. Alzheimers Dement. 2019;15:1071–1080. [DOI] [PubMed] [Google Scholar]
- 26. Goetzl EJ, Abner EL, Jicha GA, Kapogiannis D, Schwartz JB. Declining levels of functionally specialized synaptic proteins in plasma neuronal exosomes with progression of Alzheimer's disease. FASEB J. 2018;32:888–893. [DOI] [PMC free article] [PubMed] [Google Scholar]
- 27. Goetzl EJ, Schwartz JB, Abner EL, Jicha GA, Kapogiannis D. High complement levels in astrocyte‐derived exosomes of Alzheimer disease. Ann Neurol. 2018;83:544–552. [DOI] [PMC free article] [PubMed] [Google Scholar]
- 28. Guix FX, Corbett GT, Cha DJ, et al. Detection of aggregation‐competent tau in neuron‐derived extracellular vesicles. Int J Mol Sci. 2018;19 10.3390/ijms19030663. [DOI] [PMC free article] [PubMed] [Google Scholar]
- 29. Wei H, Xu Y, Xu W, et al. Serum exosomal miR‐223 serves as a potential diagnostic and prognostic biomarker for dementia. Neuroscience. 2018;379:167–176. [DOI] [PubMed] [Google Scholar]
- 30. Winston CN, Goetzl EJ, Baker LD, Vitiello MV, Rissman RA. Growth hormone‐releasing hormone modulation of neuronal exosome biomarkers in mild cognitive impairment. J Alzheimers Dis. 2018;66:971–981. [DOI] [PMC free article] [PubMed] [Google Scholar]
- 31. Mullins RJ, Mustapic M, Goetzl EJ, Kapogiannis D. Exosomal biomarkers of brain insulin resistance associated with regional atrophy in Alzheimer's disease. Hum Brain Mapp. 2017;38:1933–1940. [DOI] [PMC free article] [PubMed] [Google Scholar]
- 32. Goetzl EJ, Kapogiannis D, Schwartz JB, et al. Decreased synaptic proteins in neuronal exosomes of frontotemporal dementia and Alzheimer's disease. FASEB J. 2016;30:4141–4148. [DOI] [PMC free article] [PubMed] [Google Scholar]
- 33. Goetzl EJ, Mustapic M, Kapogiannis D, et al. Cargo proteins of plasma astrocyte‐derived exosomes in Alzheimer's disease. FASEB J. 2016;30:3853–3859. [DOI] [PMC free article] [PubMed] [Google Scholar]
- 34. Shi M, Kovac A, Korff A, et al. CNS tau efflux via exosomes is likely increased in Parkinson's disease but not in Alzheimer's disease. Alzheimers Dement. 2016;12:1125–1131. [DOI] [PMC free article] [PubMed] [Google Scholar]
- 35. Winston CN, Goetzl EJ, Akers JC, et al. Prediction of conversion from mild cognitive impairment to dementia with neuronally derived blood exosome protein profile. Alzheimers Dement. 2016;3:63–72. [DOI] [PMC free article] [PubMed] [Google Scholar]
- 36. Cheng L, Doecke JD, Sharples RA, et al. Prognostic serum miRNA biomarkers associated with Alzheimer's disease shows concordance with neuropsychological and neuroimaging assessment. Mol Psychiatry. 2015;20:1188–1196. [DOI] [PubMed] [Google Scholar]
- 37. Fiandaca MS, Kapogiannis D, Mapstone M, et al. Identification of preclinical Alzheimer's disease by a profile of pathogenic proteins in neurally derived blood exosomes: a case‐control study. Alzheimers Dement. 2015;11:600‐607.e1. [DOI] [PMC free article] [PubMed] [Google Scholar]
- 38. Goetzl EJ, Boxer A, Schwartz JB, et al. Altered lysosomal proteins in neural‐derived plasma exosomes in preclinical Alzheimer disease. Neurology. 2015;85:40–47. [DOI] [PMC free article] [PubMed] [Google Scholar]
- 39. Kapogiannis D, Boxer A, Schwartz JB, et al. Dysfunctionally phosphorylated type 1 insulin receptor substrate in neural‐derived blood exosomes of preclinical Alzheimer's disease. FASEB J. 2015;29:589–596. [DOI] [PMC free article] [PubMed] [Google Scholar]
- 40. Liu C‐G, Song J, Zhang Y‐Q, Wang P‐C. MicroRNA‐193b is a regulator of amyloid precursor protein in the blood and cerebrospinal fluid derived exosomal microRNA‐193b is a biomarker of Alzheimer's disease. Mol Med Rep. 2014;10:2395–2400. [DOI] [PubMed] [Google Scholar]
- 41. Sweeney MD, Montagne A, Sagare AP, et al. Vascular dysfunction‐the disregarded partner of Alzheimer's disease. Alzheimers Dement. 2019;15:158–167. [DOI] [PMC free article] [PubMed] [Google Scholar]
- 42. Iturria‐Medina Y, Sotero RC, Toussaint PJ, Mateos‐Pérez JM, Evans AC, Alzheimer's disease neuroimaging initiative. Early role of vascular dysregulation on late‐onset Alzheimer's disease based on multifactorial data‐driven analysis. Nat Commun. 2016;7:11934. [DOI] [PMC free article] [PubMed] [Google Scholar]
- 43. Jack CR, Jr , DA Bennett, Blennow K, et al. NIA‐AA research framework: toward a biological definition of Alzheimer's disease. Alzheimers Dement. 2018;14:535–562. [DOI] [PMC free article] [PubMed] [Google Scholar]
- 44. Jack CR, Jr , DA Bennett, Blennow K, et al. A/T/N: an unbiased descriptive classification scheme for Alzheimer disease biomarkers. Neurology. 2016;87:539–547. [DOI] [PMC free article] [PubMed] [Google Scholar]
- 45. Chen Z, Mengel D, Keshavan A, et al. Learnings about the complexity of extracellular tau aid development of a blood‐based screen for Alzheimer's disease. Alzheimers Dement. 2019;15:487–496. [DOI] [PMC free article] [PubMed] [Google Scholar]
- 46. Sato C, Barthélemy NR, Mawuenyega KG, et al. Tau kinetics in neurons and the human central nervous system. Neuron. 2018;97:1284‐1298.e7. [DOI] [PMC free article] [PubMed] [Google Scholar]
- 47. Cicognola C, Brinkmalm G, Wahlgren J, et al. Novel tau fragments in cerebrospinal fluid: relation to tangle pathology and cognitive decline in Alzheimer's disease. Acta Neuropathol. 2019;137:279–296. [DOI] [PMC free article] [PubMed] [Google Scholar]
- 48. Sardar Sinha M, Ansell‐Schultz A, Civitelli L, et al. Alzheimer's disease pathology propagation by exosomes containing toxic amyloid‐beta oligomers. Acta Neuropathol. 2018;136:41–56. [DOI] [PMC free article] [PubMed] [Google Scholar]
- 49. Badhwar A, McFall GP, Sapkota S, et al. Toward discovery of multiomics biotypes of Alzheimer's disease: a focused review and proposed roadmap. Brain. 2019; awz384, 10.1093/brain/awz384. [DOI] [PMC free article] [PubMed] [Google Scholar]
- 50. Wang Y, Balaji V, Kaniyappan S, et al. The release and trans‐synaptic transmission of Tau via exosomes. Mol Neurodegener. 2017;12:5. [DOI] [PMC free article] [PubMed] [Google Scholar]
- 51. Kanmert D, Cantlon A, Muratore CR, et al. C‐Terminally truncated forms of tau, but not full‐length tau or its C‐terminal fragments, are released from neurons independently of cell death. J Neurosci. 2015;35:10851–10865. [DOI] [PMC free article] [PubMed] [Google Scholar]
- 52. Badhwar A, Tam A, Dansereau C, Orban P, Hoffstaedter F, Bellec P. Resting‐state network dysfunction in Alzheimer's disease: a systematic review and meta‐analysis. Alzheimers Dement. 2017;8:73–85. [DOI] [PMC free article] [PubMed] [Google Scholar]
- 53. Sperling RA, Aisen PS, Beckett LA, et al. Toward defining the preclinical stages of Alzheimer's disease: recommendations from the National Institute on Aging‐Alzheimer's Association workgroups on diagnostic guidelines for Alzheimer's disease. Alzheimers Dement. 2011;7:280–292. [DOI] [PMC free article] [PubMed] [Google Scholar]
- 54. Mullins RJ, Diehl TC, Chia CW, Kapogiannis D. Insulin resistance as a link between amyloid‐Beta and tau pathologies in Alzheimer's disease. Front Aging Neurosci. 2017;9:118. [DOI] [PMC free article] [PubMed] [Google Scholar]
- 55. Mustapic M, Tran J, Craft S, Kapogiannis D. Extracellular vesicle biomarkers track cognitive changes following intranasal insulin in Alzheimer's disease. J Alzheimers Dis. 2019;69:489‐498. 10.3233/JAD-180578. [DOI] [PMC free article] [PubMed] [Google Scholar]
- 56. Ashton NJ, Hye A, Leckey CA, et al. Plasma REST: A novel candidate biomarker of Alzheimer's disease is modified by psychological intervention in an at‐risk population. Transl Psychiatry. 2017;7:e1148–e1148. [DOI] [PMC free article] [PubMed] [Google Scholar]
- 57. Elahi FM, Casaletto KB, Altendahl M, et al. “Liquid Biopsy” of white matter hyperintensity in functionally normal elders. Front Aging Neurosci. 2018;10:343. [DOI] [PMC free article] [PubMed] [Google Scholar]
- 58. Lukiw WJ, Andreeva TV, Grigorenko AP, Rogaev EI. Studying micro RNA function and dysfunction in Alzheimer's disease. Front Genet. 2012;3:327. [DOI] [PMC free article] [PubMed] [Google Scholar]
- 59. Wang L‐L, Min L, Guo Q‐D, et al. Profiling microRNA from brain by microarray in a transgenic mouse model of Alzheimer's disease. Biomed Res Int. 2017;2017:8030369. [DOI] [PMC free article] [PubMed] [Google Scholar]
- 60. Liew LC, Katsuda T, Gailhouste L, Nakagama H, Ochiya T. Mesenchymal stem cell‐derived extracellular vesicles: a glimmer of hope in treating Alzheimer's disease. Int Immunol. 2017;29:11–19. [DOI] [PubMed] [Google Scholar]
Associated Data
This section collects any data citations, data availability statements, or supplementary materials included in this article.
Supplementary Materials
Supporting Information