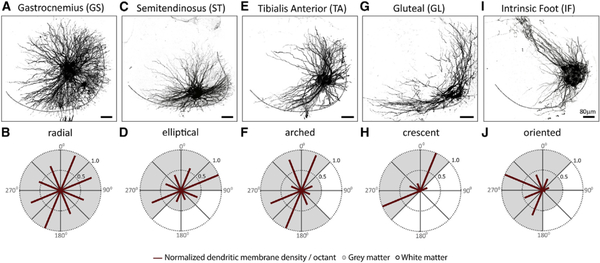
Figure 2. Dendritic Arborization Patterns of Distinct Motor Pools in Wild-Type Mice.
Representative dendritic arbors of motor neurons (A, C, E, G, and I) innervating distinct hindlimb muscles. Radial plot quantification of normalized dendritic membrane density per octant (red bars) from the centroid of motor neurons of (B) GS, (D) ST, (F) TA, (H) GL, and (J) IF pools. Gray and white matter are depicted by shading in the plots. Black dotted line in (A), (C), (E), (G), and (I) depicts gray matter boundary. See Table S2 for experimental sample sizes.

