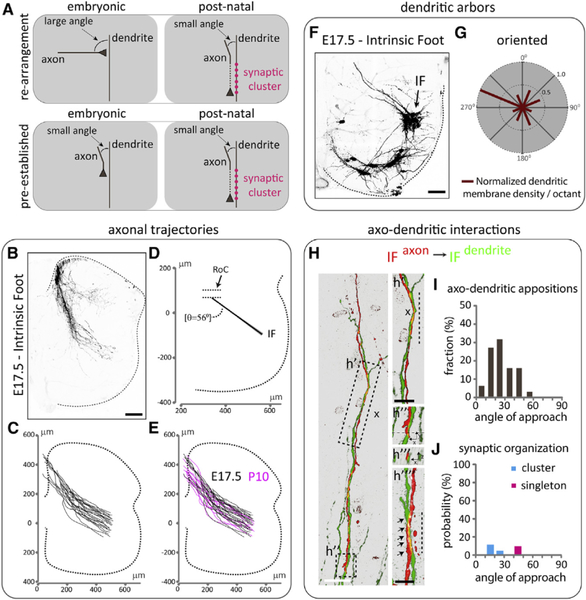
Figure 6. Axo-dendritic Morphologies and Interactions in the IF Reflex Circuit at Embryonic Stages of Wild-Type Mice.
(A) Schematics depicting different models of axodendritic configuration between IF sensory axons and IF motor neuron dendrites at embryonic and post-natal stages. Top: re-arrangement of axodendritic interactions results in angular reduction and synaptic cluster formation (magenta circles). Bottom: pre-established angular axo-dendritic interactions at embryonic and post-natal stages result in synaptic cluster formation (magenta circles).
(B) Representative spinal axonal projections from wild-type sensory neurons innervating intrinsic foot (IF) muscles labeled at E17.5 using a retrograde embryonic L5-L6 dorsal root fill. Black scale bar: 100μm.
(C) Reconstruction of IF sensory axons at E17.5.
(D) Average trajectory angle (56 ± 1°) of IF sensory axons from RoC toward the ventral spinal cord at E17.5. SEM of trajectory shown as shaded color.
(E) Overlay of reconstructed sensory axons. E17.5 spinal cords were scaled to the dimensions of a normalized P10 spinal cord (Figure 1F) for comparative analyses.
(F) Representative IF motor neuron dendritic arborization patterns labeled at E17.5 using a retrograde embryonic L5-L6 ventral root fill (note that some non-IF motor neurons, located in the ventral spinal cord, are also labeled). The dotted line represents the spinal cord boundary. Black arrow indicates IF motor neurons. Black scale bar: 80 μm.
(G) Radial plot quantification of normalized dendritic membrane density per octant (red bars) from the centroid of motor neurons of E17.5 IF pool.
(H) Maximum projection images of pseudo-color reconstructions of confocal optical sections. Green, IF motor neuron dendrites; red, IF sensory axon; white, vGluT1+ punctum on IF sensory axon. Arrows indicate sensory axon + vGluT1+ + motor neuron appositions. Vertical dotted line denotes axo-dendritic alignment. Black x indicates absence of synapses from identified axo-dendritic appositions, (h′), enlarged region showing axo-dendritic alignment and absence of vGluT 1+ puncta. (h″), region with presumptive IF sensory axon filopodium. (h″′) optical cross-section of Z stack encompassing presumptive filopodium denoted with a thin dotted line in (h″). (h″″) position of vGluT1+ synaptic cluster (image from a different section). White scale bar: 10 μm; black scale bar: 5 μm.
(I) Histogram indicating the fraction (y axis) of angle (degrees) of approach (x axis) for different axo-dendritic appositions.
(J) Histogram indicating the probability (y axis) of vGluTI+ cluster (cyan) or singleton (magenta) as a function of the angle (degrees) of approach (x axis).
See Table S2 for experimental sample sizes.

