Abstract
Introduction:
The segmentation method has a number of approaches, one of which is clustering. The clustering method is widely used for segmenting retinal blood vessels, especially the k-mean algorithm and fuzzy c-means (FCM). Unfortunately, so far there have been no studies comparing the two methods for blood vessel segmentation. Many studies do not explain the reason for choosing the method.
Aim:
This study aims to analyze the performance of the algorithms of k-means and FCM for retinal blood vessel segmentation.
Methods:
This research method is divided into three stages, namely preprocessing, segmentation, and performance analysis. Preprocessing uses the green channel method, Contrast-limited adaptive histogram equalization (CLAHE) and median filter. Segmentation is divided into three processes, namely clustering, thresholding and determining the region of interest (ROI). In the thresholding process, the determination of the threshold value uses two methods, namely the mean and the median. The third stage performs performance analysis using the performance parameters of the area under the curve (AUC) and statistical tests.
Results:
The statistical test results comparing FCM with k-means based on AUC values resulted in p-values <0.05 with a confidence level of 95%.
Conclusion:
Retinal vascular segmentation with the FCM method is significantly better than k-means.
Keywords: segmentation, k-mean, fuzzy c-meaans, clustering, median, mean
1. INTRODUCTION
Vascular segmentation is a process of separation between blood vessels and the background. The separation can be done using the clustering approach. Clustering is grouping data by referring to the closeness of each data. Clustering has several algorithms that can be grouped by partition, hierarchy, and clustering for large data. The clustering algorithm that is widely used is partition-based, with well-known algorithms that are k-means and fuzzy c-means (FCM). The two algorithms used two different approaches, in k-means, data will be included in one particular cluster, whereas in FCM, a data can be included in all existing clusters, but with varying degrees of membership, in a range of values [0 1](1,2). In concept, the two algorithms have similarities in how they work. Many studies have used the k-means clustering algorithm and FCM for image segmentation. Research generally just used the clustering algorithm to be combined with several methods for segmentation. The things that sometimes left behind was the reason for choosing the clustering algorithm. Research conducted by Wiharto et al. (3), uses the k-means clustering algorithm for blood vessel segmentation. The determination of blood vessels is done by thresholding based on the center of the cluster produced. The determination of the threshold is done by calculating the mean from the center of the cluster. Unfortunately, in this study more focused on detecting positive or negative hypertension retinopathy. The use of k-mean for segmentation was also carried out by Mapayi et al. (4). In this study using the k-means algorithm, which is combined with two stages of pre-processing and post-processing used to provide maximum segmentation results. Post-processing methods used are median filter and morphology. This is not described by the ability of k-means. The next research is to use the FCM algorithm for segmentation. Research conducted by Wiharto et al. (5), tested the effect of the number of clusters in the process of retinal vessel segmentation. FCM was also used in the study of Dey et al. (6), where the study also did not explain the reasons for selecting FCM and the number of clusters used. The next study was carried out by Mapayi et al. (7). In that study, it was almost the same as Mapayi et al. (4), only different in the clustering method, which uses FCM. A comparison of segmentation methods is done in the study of Mapayi et al. (8), only the comparison made is comparing the FCM + Phase Congruence with Gray-Level Co-Occurrence Matrix (GLCM) + Sum-Entropy. The results of the comparison show that FCM + Phase Congruence is better. FCM combined with other methods was also carried out by Memari et al. (9), which combines FCM with Gabor filter and frangi filter. This makes the study unable to show FCM performance. This condition is strengthened by the results of research conducted by Wiharto et al. (10), namely segmentation with a frangi filter combined with otsu thresholding alone can provide good performance, without having to be combined with FCM. Subsequent research was carried out by Supot et al. (11), which combines fuzzy with k-means. In that research, it is also not much different, namely the existence of post-processing using a length filter. Referring to some studies that have been done, it is necessary to compare the clustering method for retinal blood vessel segmentation. This is needed to know which method can provide better segmentation results. This study aims to test the ability of k-mean and FCM algorithms for retinal blood vessel segmentation. This research method is divided into three processes, namely preprocessing, segmentation and performance analysis. Preprocessing methods used are green channel, CLAHE, and median filter. In the segmentation process after clustering, the blood vessel is determined using the thresholding method. Determination of the threshold value in the thresholding process is done by calculating the mean and median of the cluster center. Performance parameters used are the area under the curve (AUC) and statistical tests for the comparison of FCM with K-means.
2. AIM
This study aims to compare the performance of the k-means and fuzzy c-means algorithms combined with the thresholding method for segmenting retinal blood vessels.
3. METHODS
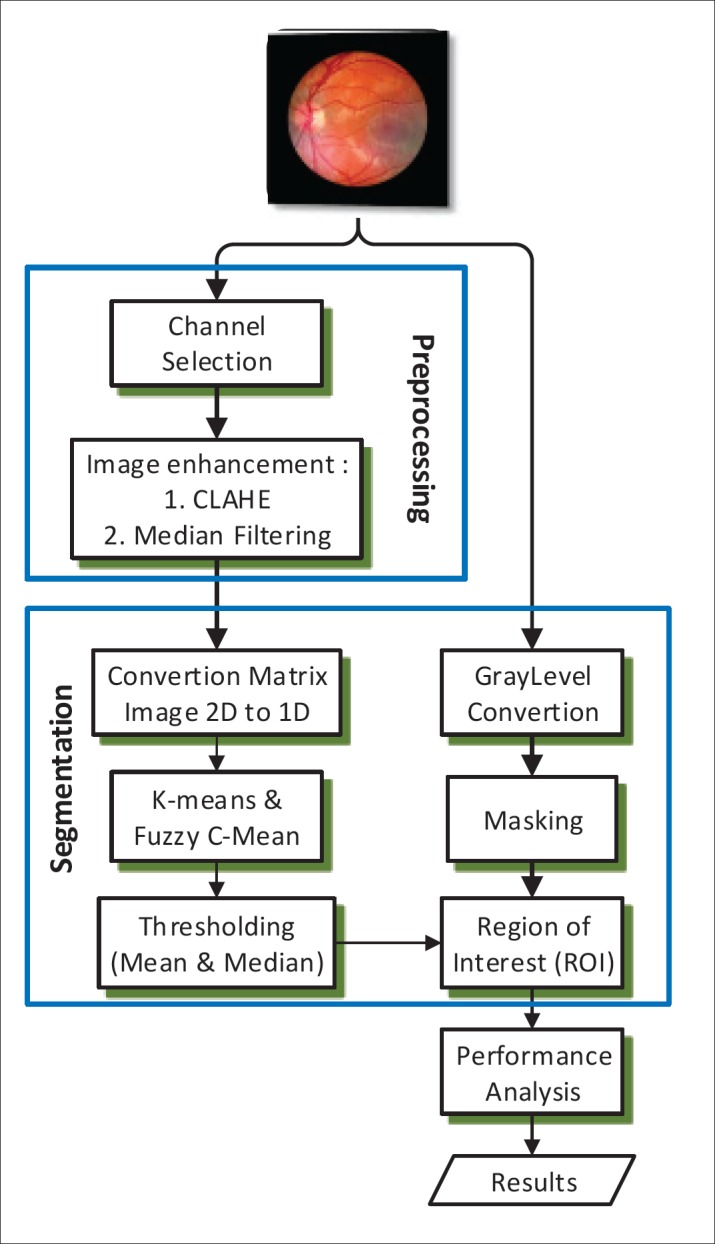
Research on retinal blood vessel segmentation uses two datasets, namely the DRIVE dataset (12) and STARE (13). Each dataset consists of 20 retinal fundus images that have not yet been segmented and segmented retinal images. This study uses the method as shown in Figure 1. Referring to Figure 1, the research method is divided into three stages, namely preprocessing, segmentation and performance analysis. The preprocessing stage aims to improve image quality, namely by separating the retinal image into three channels and taking the green channel for further processing. The green channel image is then processed using CLAHE and the median filter, for further segmentation. The clustering method for segmentation that will be tested is the k-means algorithm and fuzzy c-means (14). The segmentation stage is done using two methods, namely clustering, and thresholding. The fuzzy c-means clustering algorithm has the center cluster output expressed in vector V, with a total of c clusters. Pseudocode 1 FCM algorithm as follows (9):
Figure. 1. Research Method.
Pseudocode 1: FCM algorithm
Step 1: Determine the number of clusters c and ε
Step 2: Initialize the center of the cluster and
Step 3: k=1
Step 4: While
Calculation of and using equations (3-4)
Step 5: return cluster centers vi and membership function uij
In this study, in addition to fuzzy c-mean testing is also done using the k-means algorithm. The k-means algorithm is a partition-based clustering algorithm, using the mean. The algorithm has stages that can be described in pseudocode 2 (4).
Step 1: Determine the number of clusters, c, and initialization centroid μ1, μ2··, μc
Step 2: Determine the membership of each cluster by calculating the euclidean distance using the equation (5)
Step 3: Perform a new centroid calculation with the equation (6)
Step 4: Repeat step 2 and step 3, until no centroid changes occur. Criteria for these conditions using the equation (7)
The cluster center generated by the k-mean algorithm or FCM is then used for the thresholding process. In the thresholding process, the threshold value used is determined by calculating the mean and median values of the cluster center. The resulting threshold value is used to convert grayscale to binary. The result of the thresholding process in the form of a binary image, then performed subtraction with masking from the grayscale retina, to determine the region of interest (ROI). The results of the ROI process are then performed performance analysis using the parameters of sensitivity, specificity, and area under the curve (AUC). Sensitivity parameters indicate the ability of the system to detect that the pixel is a background, while the specificity to detect that the pixel is a blood vessel. The AUC parameter is a parameter that is calculated by referring to the sensitivity and specificity values. Cluster-based segmentation performance measurement is done by comparing the retinal image of clustering-based segmentation results with a segmented retina dataset. Comparisons are made by calculating true positive (TP), true negative (TN), False positive (FP) and false-negative (FN) parameters. TP shows blood vessel pixels that are properly segmented as blood vessel pixels, whereas TN shows non-blood vessel pixels that are properly segmented as non-blood vessel pixels. FP shows non-segmented vascular pixels as vascular pixels, whereas FN shows segmented vascular pixels as non-vascular pixels (15). The four values are then used to calculate the sensitivity, specificity, and AUC. The calculation of performance parameters is done by referring to the equation (8-10). A comparison of the two algorithms is performed using statistical tests with a confidence level of 95%. The test is used to determine whether there is a significant performance difference between the two algorithms.
4. RESULTS
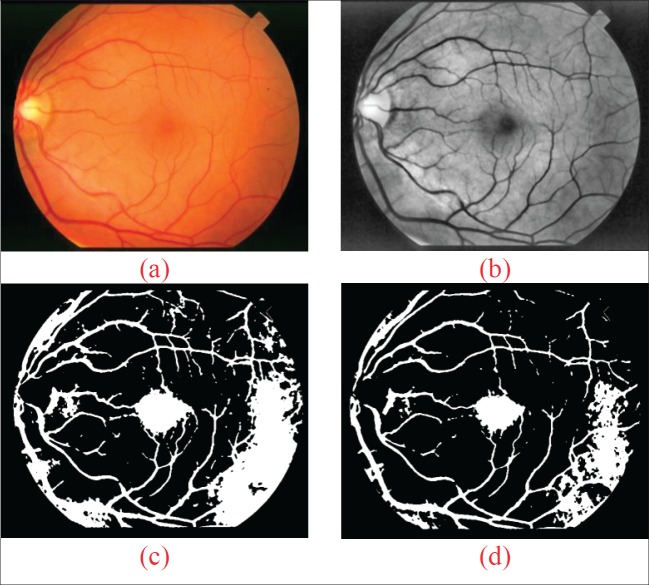
The results of segmentation using k-means and FCM for the STARE dataset can be shown in Figure 2 with the number of clusters of 10 and the threshold determination method with a median. In Figure 2 (a) is a sample input system image retina, Figure 2 (b) is the output of the CLAHE process and the median filter. Figure 2 (c) is a combined output of k-means and thresholding, while for the FCM and thresholding is shown in Figure 2 (d).
Figure. 2. The example outputs of the segmentation model using K-means and FCM.
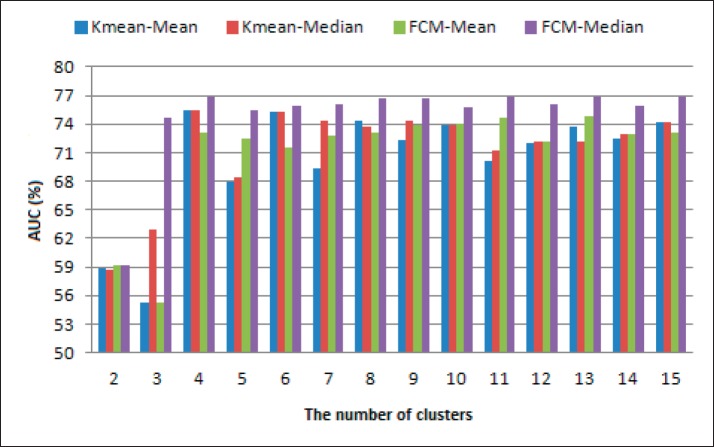
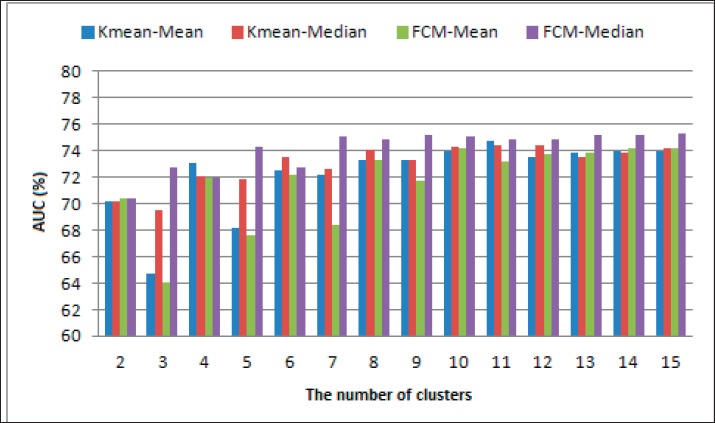
Performance resulting from testing conducted for the thresholding method with mean and median and for both clustering methods namely k-means and fuzzy c-means can be shown in Figure 3 and Figure 4. Figure 3 and Figure 4 show the results of the segmentation system performance using AUC performance parameters. This parameter is a combination of sensitivity and specificity.
Figure. 3. Effect of cluster number for DRIVE datasets.
Figure. 4. Effect of cluster number for STARE datasets.
5. DISCUSSION
The performance of the two methods for segmentation as shown in Figure 3 and Figure 4 shows that when the number of clusters is less than 4, the mean and FCM methods both provide relatively poor performance, whereas better performance is produced when the number of clusters is more than or equal to 4, however, when the number of clusters is above 4 the performance produced by both the k-means segmentation method and FCM tends to be relatively constant. This shows that a greater number of the cluster does not guarantee better performance. Changes in the cluster center value will affect the resulting threshold value so that it will affect the results of segmentation. Changes in threshold values in addition to being influenced by the central cluster value are also influenced by the method of determining the threshold value. Referring to Figure 2 and Figure 3 shows that the mean and median methods give different AUC performance. The segmentation of retinal blood vessels using the k-means algorithm, the determination of the center of the cluster was initially carried out by random. Figures 3 and 4 show the change in performance that is very volatile when there is a change in the number of clusters. A combination with several algorithms to improve the weaknesses of k-means will certainly give improvement to the results of segmentation. A relatively similar condition occurs in the fuzzy c-means algorithm, which is fluctuating performance. If the k-mean that is determined randomly is the initial value of the center of the cluster, then if the FCM that is determined randomly is the initial value of the partition matrix u. U partition matrix is the degree of membership in the cluster. The initial random center cluster determination will cause a local optimum. In this study the comparison is done under the same conditions, i.e. the initial cluster center and u partition matrix are randomly determined. A comparison of the performance of the k-means and fuzzy c-means clustering methods for segmentation can be shown in Table 1. Table 1 shows a comparison of FCM and k-mean performance for the DRIVE and STARE dataset. The comparison results show that the performance of the k-means algorithm is significantly lower than that of the fuzzy c-means, based on the results of the significance test between the two algorithms. While the clustering method with the c-mean fuzzy algorithm can provide a significantly better performance, compared to k-means. Clustering-based segmentation performance with the median threshold determination method can provide better performance. The performance of the fuzzy c-means algorithm gives better performance than k-mean, both when using thresholding with mean and median methods. Better performance of fuzzy c-means requires additional time when compared to k-means, this is as explained in the study of Ghosh & Kumar (16). The research has explained that the computational time of fuzzy c-means is longer than k-means. This is also supported by the complexity of the k-mean Q(n) algorithm, while fuzzy c-means Q(n2). This is also reinforced by research conducted by Panda et al. (17).
Table 1. Comparison of system performance.
| Parameters | P-value (Kmean vs FCM) | |||||||
|---|---|---|---|---|---|---|---|---|
| DRIVE | STARE | |||||||
| Mean | Algorithm | Median | Algorithm | Mean | Algorithm | Median | Algorithm | |
| Sensitivity | 0,009138 | FCM | 0,055646 | - | 0,002169 | FCM | 0,811024 | - |
| Specificity | 0,932436 | - | 0,005960 | FCM | 0,003464 | Kmean | 0,319630 | - |
| Accuracy | 0,002677 | FCM | 0,085654 | - | 0,002857 | FCM | 0,692880 | - |
| AUC | 0,405206 | - | 0,000696 | FCM | 0,066524 | - | 0,002140 | FCM |
Referring to these conditions, the low complexity of k-means will affect faster computing compared to FCM. Along with the development of processors that use Hyper-Threading Technology, the processor can execute multiple threads or instructions at the same time, to improve system performance and response. This makes the difference in the speed of computing k-means with FCM to be insignificant. The performance of both k-means and FCM, can provide performance in the range of 70% -80% based on AUC parameters, or included in the medium category (18). Both methods to achieve the best performance require a different number of clusters. Fuzzy c-mean can give the best performance when the number of clusters is 4, while k-means when the number of clusters is 6 in the DRIVE dataset. Based on the number of clusters, fuzzy c-means require relatively faster computational time than k-means, but the time for FCM convergence is longer, but cumulatively the k-mean is faster than FCM in achieving its best performance. If based on the best performance produced, then FCM is significantly better than k-means. The segmentation performance using FCM better than k-mean is also strengthened in the research of Dehariya et al. (19). That study concluded that the fuzzy-based k-mean algorithm can provide better performance than the k-mean for the case of general imagery. This is also supported in a study conducted by Uslan & Bucak (20), who explained that FCM performance is better than k-means when used for segmentation, but when used for the classification case the two methods do not provide good performance.
6. CONCLUSION
Retinal blood vessel segmentation using the k-mean and fuzzy c-means clustering methods can recognize retinal blood vessels. The best performance of fuzzy c-means for segmentation is included in the medium category. The resulting performance of the two methods is significantly different, both using the threshold determination method with the mean and median. The fuzzy c-means algorithm has better performance than k-means. The fuzzy c-means algorithm has a weakness in terms of computational time required, fuzzy c-means is longer than k-means.
Acknowledgments:
We thank Sebelas Maret University for providing fundamental research grants for the second year with contract number 516.UN27.21/PP/2019. We also say thank you to the number of parties who have helped us complete the research that we did.
Authors contribution:
W.W. made substantial contribution to conception and design, substantial contribution to analysis and interpretation of data and drafting the article. E.S. made substantial contribution to the acquisition of data, critically revising the article for important intellectual content. Final approval of the version to be published of this paper made by the first author.
Conflict of interest:
The article no conflict of interest.
Financial support and sponsorship:
Nil.
REFERENCES
- 1.Gu J, Jiao L, Yang S, Zhao J. Sparse learning based fuzzy C-Means clustering. Knowl-Based Syst. 2017 Mar;119:113–125. [Google Scholar]
- 2.Zhang L, Zhong W, Zhong C, Lu W, Liu X, Pedrycz W. Fuzzy C-Means clustering based on dual expression between cluster prototypes and reconstructed data. Int J Approx Reason. 2017 Nov;90:389–410. [Google Scholar]
- 3.Wiharto W, Suryani E. The Segmentation Analysis of Retinal Image Based on K-means Algorithm for Computer-Aided Diagnosis of Hypertensive Retinopathy. The 3rd International Conference on Electrical, Electronic, Communication and Control Engineering (ICEECC 2018); Johor Bahru, Malaysia. 2018. [Google Scholar]
- 4.Mapayi T, Viriri S, Tapamo JR. Retinal Vessel Segmentation Based on Difference Image and K-Means Clustering. Proceedings of the 2014 Annual Symposium of the Pattern Recognition Association of South Africa (PRASA) 27th; Cape Town, South Africa. 2014. p. 7. [Google Scholar]
- 5.Wiharto W, Suryani E. The Analysis Effect of Cluster Numbers On Fuzzy C-Means Algorithm for Blood Vessel Segmentation of Retinal Fundus Image. IEEE The 2nd International Conference on Information and Communications Technology. IEEE; 2019. pp. 1–4. [Google Scholar]
- 6.Dey N, Roy AB, Pal M, Das A, Bengal W, Bengal W, et al. FCM Based Blood Vessel Segmentation Method for Retinal Images. Int J Comput Sci Netw IJCSN. 2012;1(3):1–5. [Google Scholar]
- 7.Mapayi T, Tapamo JR. Difference image and fuzzy C-means for detection of retinal vessels. Proc IEEE Southwest Symp Image Anal Interpret. 2016. Apr, pp. 169–172. 2016.
- 8.Mapayi T, Tapamo JR, Viriri S. Retinal Vessel Segmentation: A Comparative Study of Fuzzy C-Means and Sum Entropy Information on Phase Congruency. Int J Adv Robot Syst. 2015;12(9):1–11. [Google Scholar]
- 9.Memari N, Ramli AR, Saripan MIB, Mashohor S, Moghbel M. Retinal Blood Vessel Segmentation by Using Matched Filtering and Fuzzy C-means Clustering with Integrated Level Set Method for Diabetic Retinopathy Assessment. J Med Biol Eng [Internet] 2018. (0123456789). Available from: [DOI]
- 10.Wiharto W, Palgunadi YS. Blood Vessels Segmentation in Retinal Fundus Image using Hybrid Method of Frangi Filter, Otsu Thresholding and Morphology. Int J Adv Comput Sci Appl. 2019;10(6):417–422. [Google Scholar]
- 11.Supot S, Thanapong C, Chuchart P, Manas S. Automatic Segmentation of Blood Vessels in Retinal Image Based on Fuzzy K-Median Clustering. 2007 IEEE International Conference on Integration Technology [Internet]; Shenzhen, China: IEEE. 2007. pp. 584–588. Available from: http://ieeexplore.ieee.org/document/4290384/ 2019 Nov 25. [Google Scholar]
- 12.Staal JJ, Abramoff MD, Viergever MA, van Ginneken B, Niemeijer M. DRIVE: Digital Retinal Images for Vessel Extraction. IEEE Trans Med Imaging. 2004;23(4):501–509. doi: 10.1109/TMI.2004.825627. [DOI] [PubMed] [Google Scholar]
- 13.Hoover A. Locating blood vessels in retinal images by piecewise threshold probing of a matched filter response. IEEE Trans Med Imaging. 2000;19(3):203–210. doi: 10.1109/42.845178. [DOI] [PubMed] [Google Scholar]
- 14.Chouhan SS, Kaul A, Singh UP. Vol. 26. Springer Netherlands; 2019. Image Segmentation Using Computational Intelligence Techniques: Review [Internet] pp. 533–596. Available from: [DOI] [Google Scholar]
- 15.Wiharto W, Suryani E, Susilo M. The Hybrid Method of SOM Artificial Neural Network and Median Thresholding for Segmentation of Blood Vessels in the Retina Image Fundus. Int J Fuzzy Log Intell Syst. 2019;19(4):9. [Google Scholar]
- 16.Jipkate BR, Gohokar VV. A Comparative Analysis of Fuzzy C-Means Clustering and K Means Clustering Algorithms. Int J Comput Eng Res. 2012;2(3):737–739. [Google Scholar]
- 17.Panda S, Sahu S, Jena P, Chattopadhyay S. Comparing fuzzy-C means and K-means clustering techniques: A comprehensive study. Adv Intell Soft Comput. 2012;166:451–460. [Google Scholar]
- 18.Gorunescu F. Berlin, Heidelberg: Springer; 2011. Data Mining: Concepts, Models and Techniques (Intelligent Systems Reference Library) [Google Scholar]
- 19.Dehariya VK, Shrivastava SK, Jain RC. Clustering of image data set using k-means and fuzzy k-means algorithms. Proceedings - 2010 International Conference on Computational Intelligence and Communication Networks, CICN 2010; 2010. pp. 386–391. [Google Scholar]
- 20.Uslan V, Bucak IÖ. Clustering-based spot segmentation of cDNA microarray images. 2010 Annu Int Conf IEEE Eng Med Biol Soc EMBC10; 2010. pp. 1828–1831. [DOI] [PubMed] [Google Scholar]


