

Abstract
Objectives:
Self-monitoring is recommended for individuals with bipolar disorder, with numerous technological solutions available. The present study aimed to identify basic components of these solutions that increase engagement with self-monitoring.
Methods:
Participants with bipolar disorder (n=47) monitored their symptoms with a Fitbit and a smartphone app and were randomly assigned to either review or not review recorded symptoms weekly. We tested whether individuals would better adhere to and prefer monitoring with passive monitoring with an activity tracker compared to active monitoring with a smartphone app and whether individuals would better adhere to self-monitoring if their recorded symptoms were reviewed with an interviewer.
Results:
Monitoring with a smartphone app achieved similar adherence and preference to Fitbit (P>0.85). Linear mixed effects modeling found adherence decreased significantly more over the study for the Fitbit (12% more, P<0.001) even though more participants reported they would use the Fitbit over a year compared to the app (72.3% vs 46.8%). Reviewing symptoms weekly did not improve adherence, but most participants reported they would prefer to review symptoms with a clinician (74.5%) and on monthly basis (57.5%) compared to alternatives. Participants endorsed sleep as the most important symptom to monitor, forgetfulness as the largest barrier to self-monitoring, and raising self-awareness as the best reason for self-monitoring.
Conclusions:
We recommend a combined strategy of wearable and mobile monitoring that includes reminders, targets raising self-awareness, and tracks sleep. A clinician may want to review symptoms on a monthly basis.
Trial registration:
Keywords: Bipolar disorder, Smartphone, Fitness Trackers, Monitoring, Physiologic
Introduction
Bipolar disorder (BP) is a mental illness characterized by pathological mood swings, ranging from mania to depression. The course of BP is unpredictable, often severe, and typically causes major disruption in circadian rhythms and cognitive function1,2 which results in chronic impairment in personal, social, and vocational domains. To reduce these risks, the World Health Organization recommends that individuals with BP monitor their mood, such as keeping a daily log to record mood symptoms.3 Monitoring symptoms is also a prerequisite for measuring mood instability in BP and for delivering interventions that address needs of specific individuals in the moment.4,5,6 Many mobile and wearable technologies are available for individuals to self-monitor their symptoms,7,8,9,10 ,11,12 but engagement is a common problem.13,14,15 The present study evaluated engagement strategies for individuals with BP to monitor symptoms longitudinally.
Smartphone apps are the most common technology for interactive self-monitoring symptoms of psychiatric illness. They allow the user to record symptoms at set intervals over time. Individuals with mental illness are generally open to the use of mobile technology, and point to self-awareness and communication between patients and clinicians as reasons for engaging in self-monitoring.7,16,17,18 Visualization of symptom patterns over time may also be considered a specific strategy for increasing engagement.17 Primarily focused on qualitative information, few studies have provided quantitative evidence for engagement strategies in self-monitoring of BP.
One concern is that individuals may engage in self-monitoring less with smartphone apps when compared to monitoring approaches based on sensors and wearable devices. Smartphone apps require that users actively record their symptoms, a burden that may decrease engagement with users preferring more automated ways to record symptoms.7 They also involve subjective measurements, which may lead to less accurate or less biologically relevant markers of symptoms.6,14,16 Sensors and wearable devices allow symptoms to monitored passively and objectively. For example, MONARCA19, PRIORI 20, and Bi-Affect21 use patterns of speech and behavior from recorded calls, keystrokes, number of phone calls, and duration of phone calls to predict mood. Wearable devices, such as activity trackers, also offer direct and indirect measurements of a wide range of clinically important variables of BP such as mood, physical activity, heart rate variability, sleep patterns, and circadian rhythms.6,22,23 Yet, it is unknown whether these passive approaches improve engagement in monitoring compared to active monitoring through smartphone apps.
The present study collected quantitative data on engagement in self-monitoring over six weeks from individuals with BP (n=47). Passive monitoring was compared to active monitoring with participants using a smartphone app to log symptoms and an activity tracker to track sleep, activity, and heart rate. Participants were randomly assigned to either a review or not review self-reported symptoms. Objective measures of engagement were obtained throughout the study, with subjective measurements obtained at study end. We hypothesized that participants will exhibit better adherence rates and prefer passive monitoring of symptoms than active monitoring. We also hypothesized higher adherence rates for individuals who review recorded symptoms.
Materials and methods
The protocol for this study was previously published,24 which contains additional study details. The present paper presents the first analysis of data collected under the protocol and focuses on primary outcomes as listed in the protocol. The data that support the findings of this study are openly available in Mendeley Data at http://doi.org/10.17632/fsy7m755g6.1 under “Engagement in Mobile and Wearable Health Monitoring for Bipolar Disorder”.
Participants
A total of 50 individuals with BP were recruited from the Prechter Longitudinal Study of Bipolar Disorder 25 to participate in a six-week two-arm randomized control trial. In the Prechter Longitudinal Study of Bipolar Disorder, participants are diagnosed using the Diagnostic Interview for Genetic Studies (DIGS) 26 with diagnoses reviewed by two clinicians after initial evaluation and reevaluated when suspected to change based on a clinically relevant event. Each participant used their own smartphone for the study, and no participants were excluded from the study because they did not have a compatible smartphone. This six-week study was approved by Institutional Review Boards at the University of Michigan (HUM126732) and University of Wisconsin (2017-1322). Written consent was obtained on all individuals.
Study Design
Participation involved 7 weekly phone interviews and the use of mobile and wearable technology over 6 weeks. Each participant was provided a Fitbit Alta HR to collect information about physical activity, sleep, and heart rate. They also downloaded a smartphone application which prompted the user to log six symptoms each morning and evening: three for mania (increased energy, rapid speech, irritability) and three for depression (depressed mood, fidgeting, fatigue). In addition to logging symptoms, the app also allowed participants to review and visualize information collected from their answers and from the Fitbit. This information was presented to participants in five graphs: (1) a line graph for tracking depressive symptoms over time, (2) a line graph tracking manic symptoms over time, (3) a combined line graph and bar graph for tracking sleep over time, (4) a combined line and bar graph for tracking resting heartrate and total daily step count over time, and (5) a combined line and bar graph for tracking sleep periods and estimated circadian phase.” See the protocol paper for details on app development. 25 At study start and end, participants were assessed over the phone with a Young Mania Rating Scale (YMRS)27 depressive symptoms were assessed with a Structured Interview Guide for the Hamilton Rating Scale of Depression (SIGHD);28and general health is assessed using the 36-Item Short Form Health Survey (SF-36) developed by RAND.29 At study end, the interviewer also conducted a 17-item survey to assess engagement.24 All participants were interviewed by a trained research technician. In between the start and end of the study, participants were assessed weekly for manic and depressive symptoms using the YMRS and SIGHD. In addition to these assessments, each participant had a 50-50 chance of being randomly assigned to either reviewing data recorded by the Fitbit and app after the weekly assessments (Arm R=Review) or not reviewing this data (Arm NR=No Review). Participants were randomized using block randomization and stratifying by age (< 40 years of age vs ≥ 40 years of age) and sex. Randomization is detailed in the previously published protocol for this study.24
Measures of engagement
Primary measures were identified prior to study start: participant preference at end of study based on whether they state they are more likely to use an activity tracker over an app to monitor their symptoms and overall adherence to monitoring with an activity tracker and app. Overall adherence for the app was measured as the proportion of study days with at least 50% of daily self-reports questions completed. The criterion of 50% was chosen to align with future research and clinical goals that would require at least once-a-day recording of symptoms. Overall adherence for the activity tracker was measured as percent study days with at least 12 hours of activity tracking, determined indirectly using total minutes Fitbit measures heartrate. These primary measures of adherence and engagement were accompanied by other responses on the engagement survey to further examine reasons why an individual might monitor their symptoms with either a smartphone or an activity tracker. Daily adherence was also measured based on the proportion of minutes (out of max 1440 minutes) for which the Fitbit was worn, as determined from heartrate information, and proportion of symptoms (out of max 12) logged on the app.
Statistical tests
Four hypothesis tests were identified prior to study start to be tested. Binomial tests were used to test hypotheses that (1) participants have equal preference for the app as the Fitbit and (2) participants have equal overall adherence to the app as the Fitbit. Two-sample t-tests were used to test hypotheses that mean adherence rate were equal between study arms for the (3) Fitbit and (4) app. In addition, 95% Clopper-Pearson confidence intervals were estimated for estimated proportions using a binomial distribution and 95% confidence intervals were estimated for means using a normal distribution. Linear mixed effects model was constructed for daily adherence. The model included five fixed effects: time (i.e. study day), method (Fitbit vs. app), study arm (Arm R vs. Arm NR), age, and sex. The model included a random intercept and random slope for time to account for repeated measurements on each participant. Based on the constructed model, differences in mean daily adherence was estimated as a function of fixed effects with F-tests used to measure significance. Significance was considered a p-value less than 0.05.
Results
Sample characteristics
The study recruited 50 participants with a diagnosis of BP. Three participants were excluded for not completing the study beyond the first week. One participant died between the consent date and the start of the study, another participant was lost to follow-up between the consent date and study start, and a third participant discontinued participation after the first weekly interview due to discomfort with wearing the Fitbit. The included population were an average (± SD) of 41.9 ± 10.8 years of age and 53.1% female. The majority were white (85.1%), not Hispanic (87.2%), and were diagnosed as Bipolar I (80.0%). Study arms did not differ significantly by race, age, sex, ethnicity, or diagnosis (P>0.2). Sample characteristics are summarized in Table 1.
Table 1.
Characteristics of population included in analysis by study arm. Participants were randomized to either review (Arm R) or not review (Arm NR) recorded over the study. Arms were balanced for age and sex.
| Study arm | |||||
|---|---|---|---|---|---|
| Variable | Review (R) n=24 | No review (NR) n=23 | χ2 | df | P |
| Age, years (mean ± SD) | 41.3 ± 10.7 | 42.4 ± 11.2 | 0.12 | 1 | 0.73 |
| Female (n [%]) | 13 (54.2) | 12 (52.2) | 0.02 | 1 | 0.89 |
| Race (n [%]) | 2.41 | 4 | 0.66 | ||
| White | 21 (87.5) | 19 (82.6) | |||
| Black or African American | 2 (8.3) | 1 (4.3) | |||
| Asian | 1 (4.2) | 1 (4.3) | |||
| American Indian or Alaskan Native | 0 (0) | 1 (4.3) | |||
| More than one | 0 (0) | 1 (4.3) | |||
| Non-Hispanic (n [%]) | 22 (91.7) | 19 (82.6) | 0.87 | 1 | 0.35 |
| Diagnosis (n [%]) | 3.11 | 2 | 0.21 | ||
| Bipolar I | 15 (62.5) | 17 (73.9) | |||
| Bipolar II | 6 (25) | 6 (26.1) | |||
| Bipolar NOS | 3 (12.5) | 0 (0) | |||
Activity tracker vs smartphone app
Because activity trackers may require less effort than smartphone apps, our initial hypothesis was that participants would better adhere to passive monitoring of their symptoms with an activity tracker as opposed to active monitoring with a smartphone app. However, we found the opposite. Participants spent slightly more days engaging with the app than with the Fitbit in terms of overall adherence: recording at least half of their symptoms with the app for an average (95% CI) of 81.8% (73.1-90.4%) days in the study compared to wearing their Fitbit at least half of a day for an average of 77.8% (68.1-87.6%) days in the study (Fig 1A). Based on a binomial test, these differences were not significant (P = 0.75). However, linear mixed effects modeling (see Table A1 in Appendix) found a significant interaction between time and self-monitoring method whereby participants were significantly more likely, by 7.2%, at study start to adhere to monitoring with the Fitbit than with the smartphone app at study start (P<0.001, F[1,3916]=14.1), but 4.9% less likely at study end (P=0.008, F[1,3916]=7.0). Fig 1B illustrates differences in adherence by study day, defined as the percent symptoms logged on the day and for the Fitbit was measured for the Fitbit as the percent time Fitbit is worn in a day. Differences from study start to end are explained by a significant decline of 18.1% in Fitbit adherence over the study (P<0.001, F[1,3916]=23.8) compared to only 6.1% decline in app adherence over the study (P=0.10, F[1,3916]=2.7). Adherence was not significantly influenced by age or sex at either study start or study end (P>0.3), but there was a significant interaction between method, time, and age whereby Fitbit adherence decreased a significant 23.4% for participants at 50 years of age (P<0.001, F[1,3916]=24.1) compared to 10.2% for participants at 30 years of age (P=0.06, F[1,3916]=3.4). Further, app adherence decreased a nonsignificant 5.5% for participants at 50 years of age (P=0.25, F[1,3916]=1.3) and a similar 7.0% for participants at 30 years of age (P=0.21, F[1,3916]=1.6). In sum, these objective measures suggest that except at study start, participants better adhere to active monitoring with a smartphone app over six weeks compared to passive monitoring with an activity tracker.
Figure 1.

Comparison between active monitoring with a smartphone app and passive monitoring with a Fitbit. A) Mean (± SE) overall adherence rates across participants was measured for the app and the Fitbit. B) Mean (± SE) adherence by study day across participants was measured for the app and the Fitbit. C) End of the study preference across participants with 95% confidence intervals was measured between using an app over the Fitbit. D) Participants reported they would use the Fitbit over a year but not the app, and most participants found that the Fitbit and the app were not at all complicated and required little to no effort.
We also hypothesized participants would prefer passive monitoring with an activity tracker as opposed to active monitoring with a smartphone app (Fig 1C). Indeed, based on participant responses at study end, most participants stated that the Fitbit required significantly less effort than the app (78.7% [64.3-89.3%]; P=1e-4) and was slightly less complicated to use (59.6% [44.3-73.6%]; P=0.24). Yet, they were only slightly more likely to state that they would use the Fitbit over than the app (59.6% [44.3-73.6%]; P=0.24). At the same time, participants were slightly more likely to state that they learned less from the Fitbit over the app (44.7% [30.2-59.9%], P=0.56) and that the Fitbit did less to improve their emotional health (38.3% [24.5-53.6%], P=0.14). Thus except for perception of effort required by either self-monitoring method, there were few meaningful differences in participant preference for an activity tracker over a smartphone app.
In addition to head-to-head comparisons, we examined general attitudes towards using the Fitbit and the app (Fig 1D). Interestingly, 72.3% of participants stated they were willing to use the Fitbit over a year compared to 46.8% for the app, even though adherence rates of the Fitbit declined significantly compared to the app. Moreover, while the Fitbit was perceived to require less effort and was less complicated than the app, most participants (>85%) thought each approach required little to no effort and slightly or not complicated.
Reviewing vs not reviewing monitored symptoms
We also hypothesized that reviewing symptoms that a participant recorded over the past week would increase adherence. Based on a 2-sample t-test or linear effects modeling (Table A1), we did not find a main effect of between individuals who were randomly assigned to review their recorded symptoms with an interviewer (Arm R) compared to individuals who did not review their recorded symptoms (Arm NR) (P>0.8, Fig 2A). However, there were significant interactions in the linear mixed effects model that involved arm (R vs NR), method (Fitbit vs app), age, and sex (male vs. female). As a result, reviewing symptoms (arm R) had a significant positive effect only on app adherence and only for younger women (an estimated 43.0% increase in app adherence for women at 30 years; P=0.001, F[1,3916]=10.5). By comparison, reviewing symptoms increased Fitbit adherence by a non-significant 10.1% for women at 30 years of age (P=0.45, F[1,3916]=0.6). Moreover, reviewing symptoms had a slight negative effect in men at 30 years of age: decreased app adherence by an estimated 26.0% (P=0.10, F[1,3916]=2.8) and Fitbit adherence by 24.8% (P=0.11, F[1,3916]=2.5); and in women at 50 years of age: decreased app adherence by 25.7% (P=0.05, F[1,3916]=3.7) and Fitbit adherence by 6.8% (P=0.61, F[1,3916]=0.3). There was a negligible effect on either app or Fitbit adherence for men at 50 years of age (P>0.75). Thus except for younger women, reviewing symptoms does not increase adherence and may even decrease adherence for other individuals.
Figure 2.
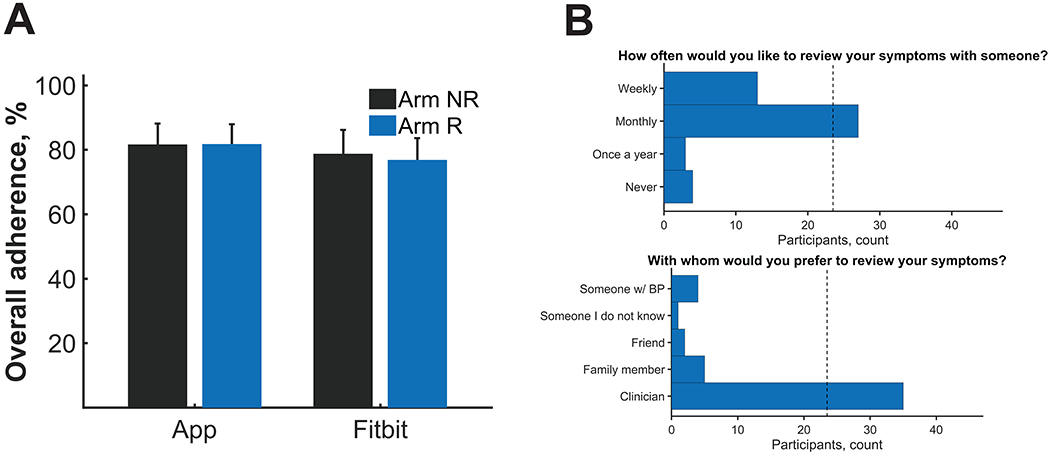
Comparison between reviewing recorded symptoms weekly (Arm R) and not reviewing recorded symptoms weekly (Arm NR). A) Mean (± SE) overall adherence rates across participants were measured by study arm. B) Most individuals stated they would want to review their symptoms on a monthly basis and preferably with a clinician.
Even though reviewing symptoms did not have strong effect on adherence, the majority of participants (57%) reported that they would like to review their recorded symptoms on a monthly basis as opposed to weekly, yearly, or never (Fig 2B). Additionally, the majority of participant (74%) reported that they would like to review their recorded symptoms with a clinician as opposed to a family member, friend, someone with BP, or someone they did not know. These data would suggest that there is a role for a clinician reviewing recorded symptoms with a patient on a monthly basis.
Symptom visualization
The app had provided participants with charts and graphs to visualize symptoms, which we thought would improve engagement in self-monitoring. (Fig 3). Most participants stated they would continue to visualize their symptoms for over a year (70.2%) and thought visualization of symptoms was slightly or not complicated (93.6%). Moreover, most participants (63.8%) thought they learned a fair amount or a lot from visualizing their symptoms.
Figure 3.
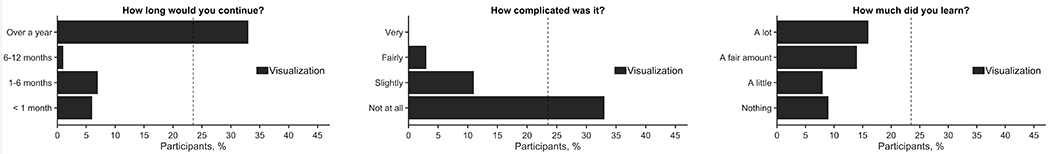
Most participants stated they would continue to visualize their symptoms for over a year and thought visualization of symptoms was not complicated but required a fair amount or a lot of effort.
Top symptoms, barriers, and uses of self-monitoring
We also asked each participant at study end their top three symptoms, top three barriers, and top three reasons for self-monitoring (Fig 4). The top barrier preventing participants from using technology to monitor their symptoms was forgetfulness, with 55.3% of participants placing this barrier in their top 3. Participants were also asked to identify the symptom or pattern that they would most like to be able to monitor, and 70.2% of participants considered sleep to be one of their top 3 symptom or pattern to monitor. Further, participants were asked what they felt the top use of technology for monitoring their symptoms would be, and the majority responded with to raise self-awareness as a top 3 use (78.7%). The least-endorsed use was to alert someone when they are in trouble. Indeed, most participants felt overall that self-monitoring of symptoms helped them learn a fair amount or a lot about their illness (70.2%) but did not improve or improved very little their emotional health (85.1%). Thus, raising self-awareness appears to be an important target for engaging individuals with BP in self-monitoring.
Figure 4.
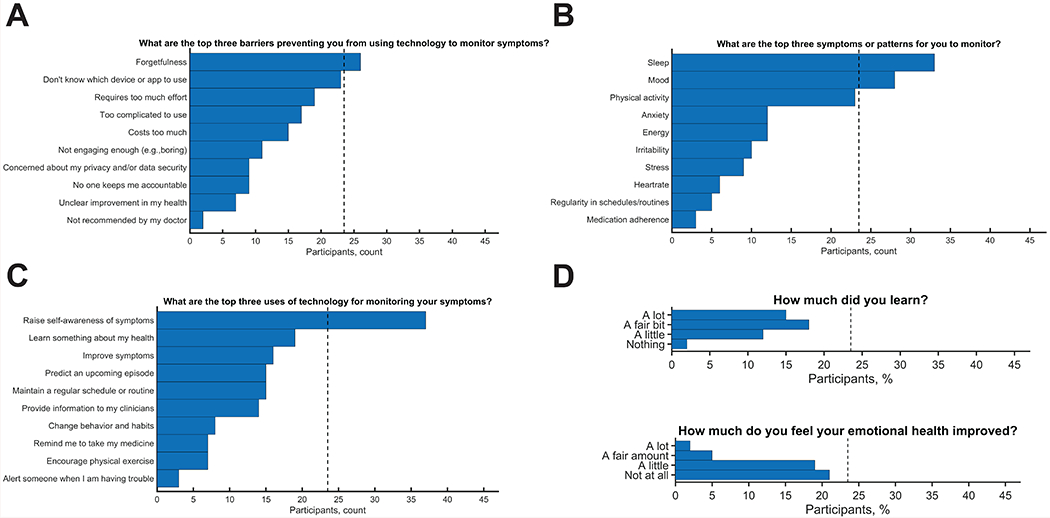
Other insights into participant engagement. Top three A) barriers, B) symptoms, and C) uses for monitoring were collected. Forgetfulness was most commonly endorsed barrier, raising self-awareness was most commonly endorsed use, and sleep was the mostly commonly endorsed symptom. D) General attitudes were also collected, with most participants stating that they learn a fair amount or a lot from monitoring but did not feel their emotional health improved.
Discussion
This study tested engagement of individuals with BP in the use of technology for monitoring daily symptoms. Participants tracked symptoms actively by completing self-report assessments on a smartphone app and passively with a Fitbit activity tracker. About 50% participants were randomly assigned to review their recorded symptoms weekly with an interviewer. Engagement strategies of interest were passive monitoring vs active monitoring, communication of recorded symptoms with an interviewer, visualization, raising self-awareness, among others. In contrast to what we hypothesized, we found mixed reactions and adherence rates between reviewing and not reviewing recorded symptoms and between active and passive monitoring. Reviewing recorded symptoms did not significantly improve adherence rates, but participants still predominately endorsed the idea of reviewing symptoms with a clinician on a monthly basis over alternatives (e.g. friend or family member; yearly, weekly, or never). Adherence was slightly higher for the self-report app, particularly at the end of the study, and participants reported they learned more from the study app and that it did more to improve their emotional health. Yet, participants reported that the Fitbit was easier to use and that they were more likely to use the Fitbit.
An explanation for this passive vs. active conflict lies within the participant’s responses to other questions at study end. Participants reported the main barrier that would prevent them from using technology to monitor their symptoms was forgetfulness. We speculate that individuals were more likely to remember to keep their smartphone close than remember to wear the Fitbit. Many individuals already keep their smartphone with them, but we expect fewer individuals have a similar habit of wearing a Fitbit. Further, provided their smartphone is close, then participants were then reminded via push notifications to respond to self-report symptoms through the app. By contrast, participants were not reminded to wear the Fitbit. They might have taken the Fitbit off to shower or charge the device and forget to put the Fitbit back on. Some may have even taken the Fitbit off at night because it is too uncomfortable to wear during sleep. Although participants found the Fitbit required less effort, the questionnaires were intentionally brief (six questions). The smartphone app also contained graphs of participant symptoms, thus checking this progress may further remind participants to complete the self-report questionnaires.
Meanwhile, the data shows participants felt the top reason for using technology to monitor symptoms was to raise self-awareness, which is consistent with other studies.7,16,17,18 The study app forces participants to reflect on their symptoms. This active monitoring could raise self-awareness, which is important to participants. The app, however, did not ask about sleep, the most popular symptom or pattern participants wanted to monitor. Sleep was monitored by the Fitbit, but many participants reported to study staff that the sleep patterns they saw using the Fitbit contrasted their own recollection of their sleep. Often realizing their sleep was more restless than they recalled.
Clinicians may thus utilize both an active device, such as a smart phone app, and a passive device, such as a Fitbit, to track their patients’ daily symptoms and to review recorded symptoms on a monthly basis. A combined approach provides flexibility depending on the patient’s preferences while increasing patient’s own self-awareness and allowing for some data collection to require minimal effort. A self-report app should also ask questions about sleep, and automated reminders should accompany any form of passive monitoring, since forgetfulness is the greater barrier.
Another meaningful finding was that most participants reported they learned something about their illness but did not feel their mood improved. There are several possible reasons for this finding. Participants were often euthymic, leaving little room for their mood to improve. Participants who were depressed were sometimes disheartened from monitoring. Monitoring might also exacerbate potential feelings of paranoia in hypomanic or manic mood episodes, as previous studies have found.17,18 Another reason may be the short duration of the study. Although monitoring could lead to earlier interventions and a better relationship between the patient and the clinician16,17,18, this study may not have been long enough for improvement to be observed.
However, mobile and wearable monitoring will not benefit all patients the same way. Variation in patient needs calls for flexible systems.17 For example, reviewing symptoms was found to have a positive effect on engagement only for younger women and only for the app, and Fitbit adherence declined significantly more for individuals at 50 years of age compared to individuals at 30 years of age and compared to the app. Future studies may thus want to focus on reviewing symptoms with young women or provide reminders to older individuals to wear an activity tracker. Moreover, some participants shared qualitative feedback in this study that they wanted to provide context to mood ratings which would help them reflect on what was going on in their lives. Similar feedback had been given in a prior study.18 In short, clinicians may want to review with patient after a trial period how they feel about monitoring.
This study has several limitations. The study required participants to utilize mobile and wearable health technology; thus, there was likely a selection bias based on participants’ willingness or interest in using smartphone and wearable technology. Another limitation is that an activity tracker was used for passive monitoring, but there are other forms of passive monitoring such as keystrokes, GPS, acoustics, call patterns,19,20,21 which may achieve better adherence rates than an activity tracker because they are collected directly from a smartphone. Another limitation is all participants were assessed weekly, which may dampen the effect of reviewing recorded symptoms on engagement compared to a situation in which only those who reviewed recorded symptoms interacted with an interviewer. In addition, this study had a small number of subjects in each study arm (Review Arm = 24, No-Review Arm = 23) and the sample was majority white and not Hispanic, limiting study findings to other populations. The duration of the study was also short, only six weeks long which may not have been enough time to fully examine adherence rates to the technologies in this study over time. Some subjects encountered difficulties in initial set up of Fitbit and study app. Problems that encountered were primarily user error, such as not making sure Bluetooth was turned on to sync Fitbit data, forgetting to download the Fitbit app separately, or not adjusting wake and sleep times in the study app when routines changed, which affected the notifications to complete the self-report questionnaires. Although each of these problems were addressed by the research technician, these could present potential problems outside of a research study if an individual does not have someone checking in on their progress with the technologies. We also did not keep track of whether a participant used an iOS or Android device, which may be an important factor in determining participant engagement. Lastly, our study was also not sufficiently powered to look at individual differences in responses to our engagement at study end, leaving questions about whether there are sex or age differences in user preferences related to engagement.
In conclusion, this study investigated how best to engage individuals with BP in mobile and wearable health monitoring. Overall, adherence rates were high, and the reaction to the mobile health technology was predominantly positive. Insights gained should improve patient experience not only with self-monitoring, but also help develop standardized practices for mobile health research in psychiatry30. Insights can also be integrated into treatment solutions that use digital health technology such as creating goals31, increasing access32; and delivering psychosocial interventions.33,34 Furthermore, it may not be beneficial to all patients to use technology 24/7, thus it is important to remain flexible and listen to patients’ preferences because if they do not feel they benefit from the technology, they will have low motivation to use it.
Acknowledgements
This research was supported by Heinz C Prechter Bipolar Research Fund at the University of Michigan Depression Center; the Richard Tam Foundation; and National Institutes of Health (R34 MH100404; K01 MH112876).
Appendix
Table A1.
Results from linear mixed effects modeling of adherence rates as a function of methodology (app vs fitbit), sex, age, study arm (review vs no review), and time. Age was centered around 40 years and has unit decades. Time was scaled to be 0 at study start and 1 at study end. Binary variables were first encoded as Fitbit=1 and App=0 for Method, as Female=1 and Male=0 for Sex, and Review=1 and No review=0 for Arm; and then were centered around their mean.
| 95% CI | |||||||
|---|---|---|---|---|---|---|---|
| Name | Estimate | SE | t | df | P | Lower | Upper |
| (Intercept) | 72.1 | 3.4 | 21.3 | 3916 | 1.4E-95 | 65.5 | 78.8 |
| Time | −12.1 | 3.3 | −3.6 | 3916 | 3.0E-04 | −18.6 | −5.5 |
| Method | 1.1 | 0.9 | 1.2 | 3916 | 0.22 | −0.7 | 3.0 |
| Age | −2.1 | 3.2 | −0.7 | 3916 | 0.51 | −8.5 | 4.2 |
| Sex | −1.3 | 6.8 | −0.2 | 3916 | 0.85 | −14.6 | 12.0 |
| Arm | −4.3 | 6.8 | −0.6 | 3916 | 0.53 | −17.6 | 9.0 |
| Time:Method | −12.0 | 3.2 | −3.7 | 3916 | 2.1E-04 | −18.4 | −5.7 |
| Time:Age | −2.9 | 3.2 | −0.9 | 3916 | 0.36 | −9.2 | 3.3 |
| Method:Age | −0.3 | 0.9 | −0.3 | 3916 | 0.77 | −2.0 | 1.5 |
| Time:Sex | −7.8 | 6.7 | −1.2 | 3916 | 0.24 | −20.9 | 5.3 |
| Method:Sex | 3.9 | 1.9 | 2.1 | 3916 | 0.04 | 0.2 | 7.5 |
| Age:Sex | −4.5 | 6.4 | −0.7 | 3916 | 0.48 | −17.0 | 8.1 |
| Time:Arm | −6.4 | 6.7 | −1.0 | 3916 | 0.34 | −19.5 | 6.7 |
| Method:Arm | 0.8 | 1.9 | 0.4 | 3916 | 0.66 | −2.9 | 4.5 |
| Age:Arm | −5.5 | 6.5 | −0.8 | 3916 | 0.40 | −18.2 | 7.2 |
| Sex:Arm | 11.4 | 13.6 | 0.8 | 3916 | 0.40 | −15.2 | 38.0 |
| Time:Method:Age | −7.3 | 3.1 | −2.4 | 3916 | 0.02 | −13.4 | −1.3 |
| Time:Method:Sex | −3.3 | 6.5 | −0.5 | 3916 | 0.61 | −16.0 | 9.4 |
| Time:Age:Sex | −10.9 | 6.3 | −1.7 | 3916 | 0.08 | −23.3 | 1.5 |
| Method:Age:Sex | −1.8 | 1.8 | −1.0 | 3916 | 0.32 | −5.2 | 1.7 |
| Time:Method:Arm | −17.9 | 6.5 | −2.8 | 3916 | 0.01 | −30.6 | −5.2 |
| Time:Age:Arm | −1.1 | 6.4 | −0.2 | 3916 | 0.86 | −13.6 | 11.4 |
| Method:Age:Arm | 14.9 | 1.8 | 8.3 | 3916 | 1.0E-16 | 11.4 | 18.4 |
| Time:Sex:Arm | −10.3 | 13.4 | −0.8 | 3916 | 0.44 | −36.6 | 15.9 |
| Method:Sex:Arm | −6.2 | 3.7 | −1.7 | 3916 | 0.10 | −13.6 | 1.1 |
| Age:Sex:Arm | −34.1 | 12.8 | −2.7 | 3916 | 0.01 | −59.2 | −9.0 |
| Time:Method:Age:Sex | −6.5 | 6.1 | −1.1 | 3916 | 0.29 | −18.5 | 5.5 |
| Time:Method:Age:Arm | −5.0 | 6.2 | −0.8 | 3916 | 0.42 | −17.1 | 7.1 |
| Time:Method:Sex:Arm | 5.0 | 13.0 | 0.4 | 3916 | 0.70 | −20.4 | 30.5 |
| Time:Age:Sex:Arm | −24.3 | 12.6 | −1.9 | 3916 | 0.05 | −49.1 | 0.5 |
| Method:Age:Sex:Arm | 23.5 | 3.5 | 6.6 | 3916 | 3.3E-11 | 16.6 | 30.5 |
| Time:Method:Age:Sex:Arm | −3.5 | 12.2 | −0.3 | 3916 | 0.77 | −27.6 | 20.5 |
Footnotes
Publisher's Disclaimer: This is the peer reviewed version of the following article: Van Til, K., McInnis, M. G., & Cochran, A. (2019). A comparative study of engagement in mobile and wearable health monitoring for bipolar disorder. Bipolar disorders, which has been published in final form at https://doi.org/10.1111/bdi.12849. This article may be used for non-commercial purposes in accordance with Wiley Terms and Conditions for Use of Self-Archived Versions.
References
- 1.Gitlin MJ, Miklowitz DJ. The difficult lives of individuals with bipolar disorder: A review of functional outcomes and their implications for treatment. J Affect Disord. 2017. February;209:147–154. [DOI] [PMC free article] [PubMed] [Google Scholar]
- 2.Soreca I, Frank E, Kupfer DJ. The phenomenology of bipolar disorder: What drives the high rate of medical burden and determines long-term prognosis? Depress Anxiety. 2009. January;26(1):73–82. [DOI] [PMC free article] [PubMed] [Google Scholar]
- 3.World Health Organization Apps.who.int. mgGAP intervention guide for mental, neurological, and substance use disorders in non-specialized health settings. 2010. https://apps.who.int/iris/bitstream/handle/10665/44406/9789241548069_eng.pdf?sequence=1. Accessed May 18, 2019. [PubMed]
- 4.Miklowitz DJ, Scott J. Psychosocial treatments for bipolar disorder: Cost-effectiveness, mediating mechanisms, and future directions. Bipolar disord. 2009 Jun;11(s2):110–122. [DOI] [PubMed] [Google Scholar]
- 5.Oud M, Mayo-Wilson E, Braidwood R, Schulte P, Jones SH, Morriss R, Kupka R, Cuijpers P, Kendall T. Psychological interventions for adults with bipolar disorder: systematic review and meta-analysis. Br J Psychiatry. 2016. March;208(3):213–222. [DOI] [PubMed] [Google Scholar]
- 6.Malhi GS, Hamilton A, Morris G, Mannie Z, Das P, Outhred T. The promise of digital mood tracking technologies: Are we heading on the right track? EBMH. 2017;20(4):102–106. [DOI] [PMC free article] [PubMed] [Google Scholar]
- 7.Murnane EL , Cosley D , Chang P , Guha S , Frank E , Gay G , Matthews M . Self-monitoring practices, attitudes, and needs of individuals with bipolar disorder: Implications for the design of technologies to manage mental health. J Am Med Inform Assoc. 2016. January 23;20(3):477–484. [DOI] [PMC free article] [PubMed] [Google Scholar]
- 8.Lawles-Wickwar S, McBain H, Mulligan K. Application and effectiveness of telehealth to support severe mental illness management: Systematic review. JMIR Ment Health. 2018. November 21;5(4);e62. [DOI] [PMC free article] [PubMed] [Google Scholar]
- 9.Appelboom G, Camacho E, Abraham ME, Bruce SS, Dumont ELP, Zacharia BE, D’Amico R, Slomian J, Reginster JY, Bruyère O, Connolly ES Jr.. Smart wearable body sensors for patient self-assessment and monitoring. Arch Public Health. 2014. August 22;72(28). [DOI] [PMC free article] [PubMed] [Google Scholar]
- 10.Klasnja P, Pratt W. Healthcare in the pocket: Mapping the space of mobile health interventions. J Biomed Inform. 2010. February;45(1):184–198. [DOI] [PMC free article] [PubMed] [Google Scholar]
- 11.Nicholas J, Larsen ME, Proudfoot J, Christensen H. Mobile apps for bipolar disorder: A systematic review of features and content quality. J Med Internet Res. 2015;17(8)e198. [DOI] [PMC free article] [PubMed] [Google Scholar]
- 12.Osmani V, Maxhuni A, Grünerbl A, Lukowicz P, Haring C, Mayora O. Monitoring activity of patients with bipolar disorder using smart phones. Presented at: 11th International Conference on Advances in Mobile Computing & Multimedia; December 2–4, 2013; Vienna, Austria. [Google Scholar]
- 13.Melville KM, Casey LM, & Kavanagh DJ. Dropout from internet-based treatment for psychological disorders. Br J Clin Psychol. 2010. November:49(4):455–471. [DOI] [PubMed] [Google Scholar]
- 14.Yeager CM, Benight CC If we build it, will they come? Issues of engagement with digital health interventions for trauma recovery. mHealth. 2018. September11;4(37). [DOI] [PMC free article] [PubMed] [Google Scholar]
- 15.Killikelly C, Zhimin H, Reeder C, Til W. Improving adherence to web-based and mobile technologies for people with psychosis: Systematic review of new potential predictors of adherence. JMIR mHealth uHealth. 2017;5(7):e94. [DOI] [PMC free article] [PubMed] [Google Scholar]
- 16.Doherty K, Barry M, Marcano-Belisario J, Arnaud B, Morrison C, Doherty G. A mobile app for the self-report of psychological well-being during pregnancy (BrightSelf): Qualitative design study. JMIR Ment Health. 2018;5(4):e10007. [DOI] [PMC free article] [PubMed] [Google Scholar]
- 17.Daus H, Kislicyn N, Heuer S, Backenstrass M. Disease management apps and technical assistance systems for bipolar disorder: Investigating the patients’ point of view. J Affect Disord. 2018. March 15;229(15); 351–357. [DOI] [PubMed] [Google Scholar]
- 18.Saunders KEA, Bilderbeck AC, Panchal P, Atkinson LZ, Geddes JR, Goodwin GM Experiences of a remote mood study and activity monitoring in bipolar disorder: A qualitative study. Eur Psychiatry. 2017. March;41:115–121. [DOI] [PMC free article] [PubMed] [Google Scholar]
- 19.Faurholt-Jepsen M, Vinberg M, Christensen EM, Frost M, Bardram J, Kessing LV. Daily electronic self-monitoring of subjective and objective symptoms in bipolar disorder-the MONARCA trial protocol (MONitoring, treAtment and pRediCtion of bipolAr disorder episodes): a randomised controlled single-blind trial. BMJ Open. 2013;3:e003353. [DOI] [PMC free article] [PubMed] [Google Scholar]
- 20.Gideon J, Provost EM, McInnis M. Mood state of prediction from speech of varying acoustic quality for individuals with bipolar disorder. Proc IEEE Int Conf Acoust Speech Signal Process 2018;2359–2363. [DOI] [PMC free article] [PubMed] [Google Scholar]
- 21.Zulueta J, Piscitello A, Rasic M, Easter R, Babu P, Langenecker SA, McInnis M, Ajilore O, Nelson PC, Ryan K, Leow A. Predicting mood disturbance severity with mobile phone keystroke metadata: A BiAffect digital phenotyping study. JMIR. 2018. July 20;20(7):e241. [DOI] [PMC free article] [PubMed] [Google Scholar]
- 22.McClung CA. How might circadian rhythms control mood? Let me count the ways. Biol Psychiatry. 2013. August 15;74(4):242–249. [DOI] [PMC free article] [PubMed] [Google Scholar]
- 23.Rohani DA, Faurholt-Jepsen M, Vedel Kessing L, Bardram JE. Correlations between objective behavioral features collected from mobile and wearable devices and depressive mood symptoms in patients with affective disorders: Systematic review. JMIR Mhealth Uhealth. 2018. August 13;6(8):e165. [DOI] [PMC free article] [PubMed] [Google Scholar]
- 24.Cochran A, Belman-Wells L, McInnis M. Engagement strategies for self-monitoring symptoms of bipolar disorder with mobile and wearable technology: Protocol for a randomized controlled trial. JMIR Res Protoc. 2018. May;7(5):e130. [DOI] [PMC free article] [PubMed] [Google Scholar]
- 25.McInnis M G, Assari S, Kamali M, Ryan K, Langenecker S A, Saunders E F, Versha K, Evans S, O’Shea K S, Mower Provost E, Marshall D, Forger D, Deldin P, Zoellner S. Cohort profile: The Heinz C Prechter longitudinal study of bipolar disorder. Int J Epidemiol. 2017. December 02;47(1):28−28n. [DOI] [PMC free article] [PubMed] [Google Scholar]
- 26.Nurnberger J I Jr, Blehar M C, Kaufmann C A, et al. Diagnostic Interview for Genetic Studies: Rationale, unique features, and training. Arch Gen Psychiatry. 1994. November;54(11):849–859. [DOI] [PubMed] [Google Scholar]
- 27.Young R C, Biggs J T, Ziegler V E, Meyer D A. A rating scale for mania: Reliability, validity and sensitivity. Br J Psychiatry. 1978. November;133(5):429–435. [DOI] [PubMed] [Google Scholar]
- 28.Williams J B W A structured interview guide for the Hamilton Depression Rating Scale. Arch Gen Psychiatry. 1988;45(8):742–747. [DOI] [PubMed] [Google Scholar]
- 29.Ware J E, Sherbourne C D. The MOS 36-item short-form health survey (SF-36). I. Conceptual framework and item selection. Med Care. 1992. June;30(6):473–483. [PubMed] [Google Scholar]
- 30.Chan S, Luming L, Torous J, Gratzer D, Yellowlees P M. Review of the use of asynchronous technologies incorporated in mental health care. Curr Psychiatry Rep. 2018;20:85. [DOI] [PubMed] [Google Scholar]
- 31.Cristol S Patient’s perspective on using mobile technology as an aid to psychotherapy. JMIR Ment Health. 2018. October 24;5(4):e10015. [DOI] [PMC free article] [PubMed] [Google Scholar]
- 32.Fauholot-Jepsen M, Geddes JR, Goodwin GM, Bauer M, Duffy A, Kessing LV, Saunders K. Reporting guidelines on remotely collected electronic data in mood disorder (eMOOD)-recommendations. Transl Psychiatry. 2019. June 07;9(162). [DOI] [PMC free article] [PubMed] [Google Scholar]
- 33.Doherty G, Coyle D, Sharry J. Engagement with online mental health interventions: An exploratory clinical study of a treatment for depression. Presented at: SIGCHI Conference on Human Factors in Computing Systems; May, 2012; Austin, TX. [Google Scholar]
- 34.Koffel E, Kuhn E, Petsoulis N, Erbes CR, Anders S, Hoffman JE, Ruzek JI, Polusny MA. A randomized controlled pilot study to CBT-I Coach: Feasibility, acceptability, and potential impact of a mobile phone application for patients in cognitive behavioral therapy for insomnia. Health Inform J. 2018;24(1):3–13. [DOI] [PubMed] [Google Scholar]