

Abstract
To identify novel genes in castration-resistant prostate cancer (CRPC), we downloaded three microarray datasets containing CRPC and primary prostate cancer in Gene Expression Omnibus (GEO). R packages affy and limma were performed to identify differentially expressed genes (DEGs) between primary prostate cancer and CRPC. After that, we performed functional enrichment analysis including gene ontology (GO) and Kyoto encyclopedia of genes and genomes (KEGG) pathway. In addition, protein–protein interaction (PPI) analysis was used to search for hub genes. Finally, to validate the significance of these genes, we performed survival analysis. As a result, we identified 53 upregulated genes and 58 downregulated genes that changed in at least two datasets. Functional enrichment analysis showed significant changes in the positive regulation of osteoblast differentiation pathway and aldosterone-regulated sodium reabsorption pathway. PPI network identified hub genes like cortactin-binding protein 2 (CTTNBP2), Rho family guanosine triphosphatase (GTPase) 3 (RND3), protein tyrosine phosphatase receptor-type R (PTPRR), Jagged1 (JAG1), and lumican (LUM). Based on PPI network analysis and functional enrichment analysis, we identified two genes (PTPRR and JAG1) as key genes. Further survival analysis indicated a relationship between high expression of the two genes and poor prognosis of prostate cancer. In conclusion, PTPRR and JAG1 are key genes in the CRPC, which may serve as promising biomarkers of diagnosis and prognosis of CRPC.
Keywords: Bioinformatics, Protein tyrosine phosphatase receptor-type R (PTPRR), Jagged1 (JAG1), Differentially expressed genes (DEGs), Castration-resistant prostate cancer (CRPC), Functional enrichment
1. Introduction
Prostate cancer (PCa) is one of the most commonly diagnosed cancers in the world. According to Cancer Statistics 2019, PCa became the first among estimated new cases of cancer in men and the second among estimated reasons behind deaths in men (Siegel et al., 2019). Similarly, the incidence rates and mortality rates of PCa have been continuously rising in China (Chen et al., 2016). Thus, PCa has received considerable critical attention. One of the main challenges of PCa is its treatment, especially the treatment of castration-resistant PCa (CRPC). CRPC has poor prognosis due to its aggressive behavior. It has been found that even PCa patients who initially responded well to the androgen deprivation therapy, they will eventually develop CRPC and the outcomes are not satisfactory (Heidenreich et al., 2014). Thus, a key issue in PCa is the identification of biomarkers and treatment targets for CRPC.
Recently, many mechanisms of castration resistance have been proposed, including de novo or cytochrome P450 family-induced synthesis of androgen, upregulation of androgen metabolism-related genes, and dysregulation of tumor microenvironment (Watson et al., 2015). Despite acknowledgement of these mechanisms, treatment of CRPC remains a challenge (Heidenreich et al., 2014). Thus, a better understanding of CRPC and identification of its biomarkers or targets, which may open a new window of opportunity for combating the disease, are urgently needed (Attard et al., 2016). Previous studies have identified numerous biomarkers and targets in CRPC by microarrays. For example, D'Antonio et al. (2008) compared androgen-independent PCa cells with androgen-dependent LNCaP cells, to identify pathways to androgen independence. Terada et al. (2010) compared gene expression between a mouse xenograft model of PCa with its later CRPC and identified prostaglandin E2 receptor subtype 4 (EP4) as a central gene of CRPC. These microarray data led us to think the possibility of using combined datasets and integrated bioinformatics to explore the molecular and cellular characteristics of CRPC. To our knowledge, there are few studies that have used bioinformatics to identify gene alterations between primary PCa and CRPC.
In this study, we used three microarray datasets in Gene Expression Omnibus (GEO, https://www.ncbi. nlm.nih.gov/geo) with the R packages affy and limma to identify differentially expressed genes (DEGs) between CRPC and primary PCa. Furthermore, functional enrichment analysis, protein–protein interaction (PPI) network, and survival analysis provided us with more information about CRPC. In brief, we identified protein tyrosine phosphatase receptor-type R (PTPRR) and Jagged1 (JAG1) as key genes in CRPC, which may serve as promising biomarkers for diagnosis and prognosis, even as therapeutic targets of CRPC.
2. Materials and methods
2.1. Microarray data
Three gene expression profiles (GSE8702, GSE21887, and GSE33316) were obtained from the GEO. These gene expression profiles include cell line (LNCaP from GSE8702) (D'Antonio et al., 2008) and xenograft models (KUCaP-2 from GSE21887 and LuCaP35 from GSE33316) (Terada et al., 2010; Sun et al., 2012), which could mimic CRPC (Table 1). In addition, the platform of the three datasets was GPL570, which means that these microarrays detected the same gene pools, providing the comparability of these datasets.
Table 1.
Characteristics of the microarray datasets from GEO database
| Accession/ID | PMID | CRPC group | Control group |
| GSE8702 | 18302219 (D'Antonio et al., 2008) | Androgen deprived for 11 or 12 months | Androgen deprived for three weeks or one month |
| GSE21887 | 20145136 (Terada et al., 2010) | Castration resistance in xenograft mice | Androgen-dependent xenograft mice |
| GSE33316 | 22108827 (Sun et al., 2012) | Androgen-deprived LuCaP35 xenografts in castrated mice | LuCaP35 xenografts from non-treated mice |
GEO: Gene Expression Omnibus; PMID: PubMed unique identifier; CRPC: castration-resistant prostate cancer
2.2. Identification of DEGs
R software (Version 3.5.1; https://www.r-project. org) was used for the identification of DEGs. We downloaded the raw data from GEO (GSE8702, GSE21887, and GSE33316), normalized them, and transformed them into expression values by the affy package of Bioconductor (http://www.bioconductor.org) (Gautier et al., 2004). Then we used empirical Bayes methods to identify DEGs between CRPC and primary androgen-dependent PCa with limma package (Ritchie et al., 2015). The criteria of DEGs were false discovery rate (FDR)<0.05 and |log2(fold change)|>1 (Su et al., 2018). Then we used Venn diagrams to find the common altered genes (including increased and decreased genes) in the three datasets.
2.3. Functional enrichment analysis of the DEGs
The Database for Annotation, Visualization, and Integrated Discovery (DAVID; http://www.david.niaid. nih.gov) (Dennis et al., 2003) is a useful tool for functional annotation of DEGs via four web-based analysis modules including gene ontology (GO) charts (Gene Ontology Consortium, 2004) and Kyoto encyclopedia of genes and genomes (KEGG) charts (Kanehisa and Goto, 2000; Zhu et al., 2019). We used the DAVID database to perform GO and KEGG pathway analyses on DEGs that were upregulated or downregulated in at least two datasets.
2.4. PPI network construction and analysis
Search Tool for the Retrieval of Interacting Genes/Proteins (STRING; https://string-db.org) is used to construct PPI network, which shows physical and functional interactions (Szklarczyk et al., 2017; Lin et al., 2018). In this study, the protein pairs with combined scores of >0.15 were selected for the PPI network construction. Further, the Cytoscape software (Version 3.6.1) (Shannon et al., 2003) was utilized to calculate the node degree by Network Analyzer app and draw the PPI network with different colors and sizes, which present the regulation (up or down) and node degree, respectively.
2.5. Expression validation and survival analysis of the key genes
Expression validation was performed in another GEO dataset (GSE70770-GPL10558), which contains 13 patients with CRPC and 206 patients with primary PCa (the clinical and pathological characteristics were shown in Table S1). Survival analysis was performed in Gene Expression Profiling Interactive Analysis (GEPIA; http://gepia.cancer-pku.cn/index.html) (Tang et al., 2017), an interactive web application for gene expression and survival analysis based on The Cancer Genome Atlas (TCGA; http://www. cancergenome.nih.gov) database (Weinstein et al., 2013), which offers abundant clinical information from a huge PCa sample size (Guo et al., 2018).
3. Results
3.1. DEG identification
After performing DEG analysis with R package, we identified the DEGs in the CRPC samples compared with the primary PCa samples. The GSE8702 dataset harbors 616 upregulated genes and 1828 downregulated genes. The GSE21887 dataset identified 481 increased genes and 25 decreased genes, while the GSE33316 dataset found 149 genes with enhanced expression and 534 genes with suppressed expression. These DEGs are shown in volcano maps and heat maps (Figs. 1 and 2).
Fig. 1.

Volcano plots of all genes in GSE8702, GSE21887, and GSE33316
Red dots represent genes with fold change≥2 and P<0.05, green dots represent genes with fold change≤−2 and P<0.05, and the other dots represent the rest of genes with no statistically significant change in expression. FC, fold change
Fig. 2.

Heat maps of differential expressed genes (DEGs) in GSE8702, GSE21887, and GSE33316
Red color represents upregulated genes (fold change≥2 and P<0.05) and green color represents downregulated genes (fold change≤−2 and P<0.05)
Then, we performed Venn diagrams, which extracted 53 upregulated genes and 58 downregulated genes that changed in at least two datasets (Fig. 3 and Table 2). In addition, the expression of Rho family guanosine triphosphatase (GTPase) 3 (RND3), neuroligin 4 X-linked (NLGN4X), and cyclic adenosine monophosphate (cAMP)-dependent protein kinase inhibitor α (PKIA) was enhanced, while only ephrin-B2 (EFNB2) was decreased in all datasets.
Fig. 3.
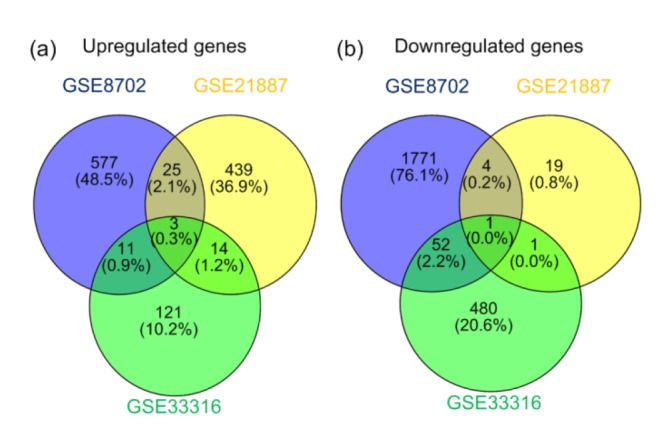
Venn diagram of differential expressed gene (DEG) selection in three datasets
(a) Venn diagram of upregulated genes (fold change≥2 and P<0.05). (b) Venn diagram of downregulated genes (fold change≤−2 and P<0.05)
Table 2.
Differential expressed genes (DEGs) in at least two datasets
| Alternation | Genes |
| Upregulated | RND3, NLGN4X, PKIA, FOXQ1, CMPK2, TMEM45A, C1orf168, HLA-DRA, TPBG, MASTL, SPIN4, SPDL1, PSRC1, SKA1, LUM, RFWD3, SACS, WBP5, NUDT11, SLC1A1, ELOVL6, ITM2A, NHS, SSTR5-AS1, PVRL3, CHAC2, RHOBTB1, DNAH5, XDH, PTPRR, PTPRB, JAG1, HAGLROS, TLR3, NBEA, ZNF423, MAP2, SI, AGPAT9, ADD3, HOXA13, DACH1, FAM102B, CLUL1, LINGO1, SCGB1D2, CTTNBP2, RGS2, CYP4X1, APELA, ZBED9, LOC286052, FOXD1 |
| Downregulated | EFNB2, TWIST1, GUCY1A3, CTBP1-AS, ADAMTS1, CMTR2, HSD11B2, ABHD2, FAM110C, SLC25A21, PP14571, CEBPD, SLC2A10, HSPA2, GCNT2, SCNN1B, ACOT9, NPNT, HIST1H2BE, TRIM6, NR3C2, LINC01139, HHEX, CYB5B, KRT20, ERO1LB, HIST1H4H, FZD3, HIST1H1C, ZNF883, PDLIM5, RRN3, CCNB3, PFN2, SLC16A9, VLDLR, ZBTB16, MAN2A1, ADRB2, GCHFR, RBPMS2, KCTD9, ELOVL2-AS1, GADD45G, LOC100288675, SLC16A6, AIFM2, ENDOD1, ABAT, ZFYVE21, GBA3, BMPR1B, MAK, H2BFS, NANOS1, EOGT, FXYD3, CUX2 |
3.2. GO and KEGG pathway enrichment
To explore the functional enrichment of the identified DEGs, we submitted the upregulated genes and downregulated genes, as described in Table 2, to the DAVID for functional pathway analysis including GO and KEGG, and the results are presented in Table 3.
Table 3.
Functional enrichment analysis
| Pathway ID | Pathway description | Count | P-value | Genes |
| GO-BP | ||||
| GO:0045669 | Positive regulation of osteoblast differentiation | 4 | 0.004 615 969 | CEBPD, NPNT, JAG1, BMPR1B |
| GO:0001701 | In utero embryonic development | 5 | 0.020 901 560 | MAN2A1, HHEX, RRN3, PTPRR, TWIST1 |
| GO:0045892 | Negative regulation of DNA-templated transcription | 8 | 0.021 870 896 | HHEX, CEBPD, TRIM6, DACH1, ZBTB16, FOXD1, TWIST1, ZNF423 |
| GO:0006334 | Nucleosome assembly | 4 | 0.029 188 620 | H2BFS, HIST1H1C, HIST1H2BE, HIST1H4H |
| GO:0060087 | Relaxation of vascular smooth muscle | 2 | 0.033 125 732 | RGS2, GUCY1A3 |
| GO:0010389 | Regulation of G2/M transition of mitotic cell cycle | 2 | 0.049 279 109 | CCNB3, PKIA |
| GO:2000737 | Negative regulation of stem cell differentiation | 2 | 0.049 279 109 | TRIM6, JAG1 |
| GO-CC | ||||
| GO:0016324 | Apical plasma membrane | 7 | 0.004 174 384 | ADRB2, SI, FZD3, JAG1, SCNN1B, NHS, SLC1A1 |
| GO:0043235 | Receptor complex | 5 | 0.004 393 425 | PTPRB, ADRB2, NR3C2, BMPR1B, VLDLR |
| GO:0005887 | Integral component of plasma membrane | 14 | 0.031 795 756 | PTPRB, FXYD3, SLC2A10, EFNB2, TLR3, JAG1, TPBG, ADRB2, SLC16A6, NLGN4X, SCNN1B, BMPR1B, SLC1A1, HLA-DRA |
| GO:0000940 | Condensed chromosome outer kinetochore | 2 | 0.040 957 971 | SPDL1, SKA1 |
| GO-MF | ||||
| GO:0015293 | Symporter activity | 3 | 0.030 268 219 | SLC16A6, SLC16A9, SLC1A1 |
| GO:0042803 | Protein homodimerization activity | 9 | 0.040 796 847 | RBPMS2, XDH, HHEX, ADRB2, CEBPD, NLGN4X, ABAT, ZBTB16, TWIST1 |
| KEGG | ||||
| hsa04960 | Aldosterone-regulated sodium reabsorption | 3 | 0.019 200 921 | NR3C2, HSD11B2, SCNN1B |
GO-BP: gene ontology-biological process; GO-CC: gene ontology-cellular component; GO-MF: gene ontology-molecular function; KEGG: Kyoto encyclopedia of genes and genomes
The most significantly altered pathway was positive regulation of osteoblast differentiation pathway. The other significant pathways included: in utero embryonic development, negative regulation of stem cell differentiation, nucleosome assembly, regulation of G2/M transition of mitotic cell cycle, negative regulation of DNA-templated transcription (Table 3). In addition, the KEGG pathway analysis indicated that the aldosterone-regulated sodium reabsorption played an essential role in CRPC. Regarding molecular function, symporter activity and protein homodimerization activity were essential.
3.3. Construction of PPI network
To explore the protein–protein interaction of the DEGs, we used STRING, a web-based analysis of protein interaction. Under the criteria as described in methods, a total of 82 DEGs among 111 commonly changed DEGs were filtered into the PPI network. The PPI network contained 82 nodes and 201 edges (Fig. 4), which was further analyzed in Cytoscape, with Network Analyzer app for calculating the node degree. The genes cortactin-binding protein 2 (CTTNBP2), RND3, lumican (LUM), Toll-like receptor 3 (TLR3), zinc finger protein 423 (ZNF423), Rho-related BTB domain containing protein 1 (RhoBTB1), leucine-rich repeat and immunoglobulin domain-containing protein 1 (LINGO1), trophoblast glycoprotein (TPBG), JAG1, PTPRR, Nance-Horan Syndrome (NHS), protein tyrosine phosphatase receptor type β (PTPRB), zinc finger and BTB domain containing 16 (ZBTB16), heat shock protein family A member 2 (HSPA2), cyclin B3 (CCNB3), PDZ and LIM domain protein 5 (PDLIM5), twist homolog 1 (TWIST1), histone cluster 1 H4 family member h (HIST1H4H), nuclear receptor subfamily 3 group C member 2 (NR3C2), and guanylate cyclase 1 soluble subunit α3 (GUCY1A3) were the most significant 20 node degree genes, which were regarded as the hub nodes, since they may be responsible for CRPC progression.
Fig. 4.

Construction of protein–protein interaction (PPI) network of differential expressed genes (DEGs)
Red circles are upregulated genes in PPI network, while green ones are downregulated genes
3.4. Identification of key gene signatures in CRPC and survival analysis
Based on PPI network and GO pathway, we identified two genes (PTPRR and JAG1) among the top 20 nodes in the PPI network as key genes (Fig. 4). Further, we applied expression validation and survival analysis on the two genes to evaluate their roles in prognosis. Both genes were upregulated in the CRPC compared with primary PCa (Fig. 5), and the high expression was associated with shorter disease-free survival (Fig. 6). Interestingly, the expression of PTPRR and JAG1 did not differ between primary PCa and normal prostate tissues (Fig. 7), which led us to hypothesize that these genes may have a role in the progression of PCa rather than in the initiation of PCa.
Fig. 5.

Expression of key genes (JAG1 and PTPRR) in the GEO datasets
(a–c) Expression of JAG1 mRNA in GSE8702, GSE33316, and GSE70770-GPL10558, respectively; (d–f) Expression of PTPRR mRNA in GSE8702, GSE33316, and GSE70770-GPL10558, respectively. Blue represents primary PCa and red represents CRPC. PCa: prostate cancer; JAG1: Jagged1; PTPRR: protein tyrosine phosphatase receptor-type R; GEO: Gene Expression Omnibus; CRPC: castration-resistant prostate cancer
Fig. 6.

Disease-free survival in relation to the expression of the key genes (JAG1 and PTPRR) in TCGA
(a) JAG1, P=0.049; (b) PTPRR, P=0.0067. Red line represents cases with high expression of the genes; blue line represents cases with low expression of the genes. JAG1: Jagged1; PTPRR: protein tyrosine phosphatase receptor-type R; TCGA: The Cancer Genome Atlas; TPM: transcripts per kilobase of exon model per million mapped reads; HR: hazard ratio
Fig. 7.
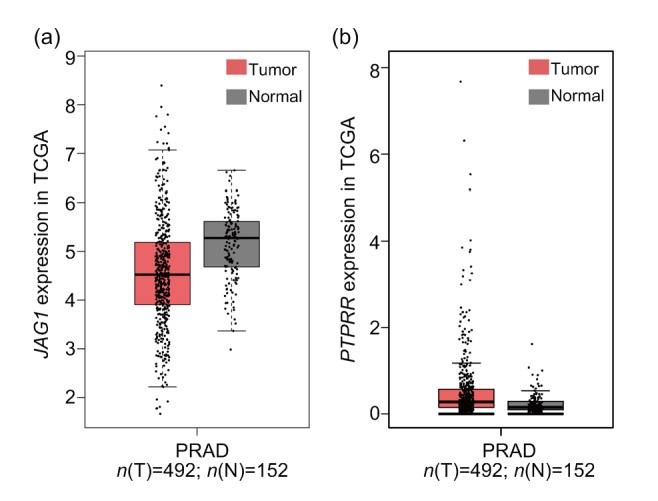
Expression of the key genes JAG1 and PTPRR in TCGA with GEPIA
(a) JAG1; (b) PTPRR. Red represents prostate cancer tissues and grey represents normal tissues. JAG1: Jagged1; PTPRR: protein tyrosine phosphatase receptor-type R; TCGA: The Cancer Genome Atlas; GEPIA: Gene Expression Profiling Interactive Analysis; PRAD: prostate adenocarcinoma
4. Discussion
In the present study, we identified two significant genes JAG1 and PTPRR, which participate in various pathways including positive regulation of osteoblast differentiation, stem cell differentiation, and embryonic development. The expression of these genes is robustly upregulated in CRPC rather than in primary PCa. Owing to the importance of these pathways in the progression and metastasis in PCa, we hypothesized that these two genes (JAG1 and PTPRR) play a critical role in the progression of PCa.
In line with our finding, a number of seminal papers have reported that JAG1 has an essential role in cancers including PCa (Santagata et al., 2004; Zhu et al., 2013; Li et al., 2014; Su et al., 2017). JAG1 encodes the protein Jagged1, which is regarded as a major Notch ligand. Previous studies have revealed that Notch signaling pathway is an evolutionarily conserved pathway, which contributes to the regulation of tissue homeostasis and carcinogenesis as well as stem cell function, developmental cell fate decisions, and cellular differentiation (Artavanis-Tsakonas et al., 1999). Consistent with its significant role in the development, the Notch signaling pathway has an active role in cancer development (Espinoza et al., 2013). The Notch ligand Jagged1 has also served as a potential therapeutic of cancer (Li et al., 2014). In this study, we found that JAG1 is upregulated in CRPC, and its high expression is related to poor outcome. This is not the only study demonstrating the important role of JAG1. Some reports have shown that JAG1 is increased in PCa and is associated with metastasis and recurrence (Santagata et al., 2004; Zhu et al., 2013; Su et al., 2017). Further, it has been shown that inhibition of Notch signaling weakens growth, proliferation, and migration in PCa (Shou et al., 2001; Yong et al., 2011; Kwon et al., 2016), suggesting the critical role of JAG1 and Notch signaling in PCa. Mechanistically, Jagged1-mediated Notch activation can induce epithelial-mesenchymal transition (EMT), thus contributing to cancer cell motility (Sethi et al., 2011). All in all, JAG1 and Notch signaling plays a critical role in PCa development. Given the role of JAG1 and Notch signaling in osteoblast differentiation and the frequent osteoblastic bone metastases (bone forming) in CRPC (Logothetis and Lin, 2005), we hypothesized that JAG1 may be involved in the bone metastasis of CRPC. Thus, JAG1 might serve as a therapeutic target for bone metastasis in CRPC.
One unanticipated finding was regarding the gene PTPRR, which is considered a tumor suppressor in several cancers. It was found to be overexpressed in CRPC and the high expression was related to poor prognosis. This is extremely striking because PTPRR belongs to the family of protein tyrosine phosphatases (PTPs), which regulates proliferation, differentiation, and function of cancer cells by dephosphorylating tyrosine (for example, tyrosine in mitogen-activated protein kinase (MAPK)) (Noordman et al., 2006; Schmitt et al., 2009). Several studies have shown that the expression of PTPRR is decreased in several cancers including colorectal carcinomas, cervical cancer, and oral squamous cell carcinoma due to high methylation (Laczmanska et al., 2013; Su et al., 2013; Chang et al., 2014; Woźniak et al., 2014), suggesting a tumor suppressive role for PTPRR (Menigatti et al., 2009; Su et al., 2013; Duś-Szachniewicz et al., 2015). These in vitro studies have also shown that overexpression of PTPRR inhibits migration and invasion in these cancers. Further, a study has shown that PTPRR is suppressed by androgen in PCa, and negatively regulates the RAS/extracellular signal-regulated protein kinases 1 and 2 (ERK1/2) pathway, thus reducing cell proliferation in response to androgen (Munkley et al., 2015). However, our results strongly indicate that patients with CRPC have higher expression of PTPRR and there is a relationship between higher expression of PTPRR and poorer outcomes, suggesting a survival advantage for cancer cells overexpressing PTPRR. Additionally, we found that the Grasso Prostate dataset also showed that PTPRR is upregulated in CRPC (Fig. S1). There are two explanations for this difference. One explanation is that upregulation of PTPRR is a mechanism to combat cancers, which means that high expression of PTPRR suggests war against cancer cells, and thus the patients may have a poor prognosis. The other explanation is that PTPRR, in contrast to other PTP family members, serves as an oncogene. Thus, further study regarding PTPRR is necessary to identify the functions of this gene. In summary, PTPRR may serve as a prognosis biomarker for PCa.
Although this study is first to identify the two significant genes (JAG1 and PTPRR) in CRPC by integrated bioinformatics analysis, we still need to recognize some limitations. Firstly, the sample we used to identify DEGs was from cell lines and xenograft models, and the sample size was small. Although we used the human sample tissue from another GEO dataset and TCGA to validate our results, the total sample size was still small due to the difficulty of obtaining CRPC sample. Secondly, our results have not been validated by experiments like quantitive real-time polymerase chain reaction (qRT-PCR), western blot, or functional in vitro experiments. Further studies on human tissue samples are needed to validate our results.
5. Conclusions
We identified two essential genes (JAG1 and PTPRR) that contribute to CRPC possibly by regulating key pathways like positive regulation of osteoblast differentiation, stem cell differentiation, and embryonic development. The two genes can be used as biomarkers of aggressive PCa and prognosis, even serve as therapeutic targets. Furthermore, we should take into consideration that these genes are altered in progressing PCa rather than in primary PCa, which may robustly affect cancer progression.
Data availability
The data that support the findings of this study are openly available in Gene Expression Omnibus (GEO, https://www. ncbi.nlm.nih.gov/geo), and the code for analysis in this article can be obtained by emailing the corresponding author.
Acknowledgments
The authors would like to thank The Cancer Genome Atlas (TCGA) and the Gene Expression Omnibus (GEO) programs for providing high quality data.
List of electronic supplementary materials
Clinical characteristics of samples in this study
Expression of the PTPRR in Grasso PCa
Footnotes
Contributors: Guo-ping REN and Ji-li WANG conceived and designed the study. Ji-li WANG and Yan WANG collected the data and analyzed the data. Ji-li WANG wrote the original draft. Guo-ping REN and Yan WANG reviewed and edited the manuscript. All authors have read and approved the final manuscript. All authors have full access to all the data in the study and have responsibility for the integrity and security of the data.
Electronic supplementary materials: The online version of this article (https://doi.org/10.1631/jzus.B1900329) contains supplementary materials, which are available to authorized users
Compliance with ethics guidelines: Ji-li WANG, Yan WANG, and Guo-ping REN declare that they have no conflict of interest.
This article does not contain any studies with human or animal subjects performed by any of the authors.
References
- 1.Artavanis-Tsakonas S, Rand MD, Lake RJ. Notch signaling: cell fate control and signal integration in development. Science. 1999;284(5415):770–776. doi: 10.1126/science.284.5415.770. [DOI] [PubMed] [Google Scholar]
- 2.Attard G, Parker C, Eeles RA, et al. Prostate cancer. Lancet. 2016;387(10013):70–82. doi: 10.1016/S0140-6736(14)61947-4. [DOI] [PubMed] [Google Scholar]
- 3.Chang CC, Huang RL, Wang HC, et al. High methylation rate of LMX1A, NKX6-1, PAX1, PTPRR, SOX1, and ZNF582 genes in cervical adenocarcinoma. Int J Gynecol Cancer. 2014;24(2):201–209. doi: 10.1097/igc.0000000000000054. [DOI] [PubMed] [Google Scholar]
- 4.Chen WQ, Zheng RS, Baade PD, et al. Cancer statistics in China, 2015. CA Cancer J Clin. 2016;66(2):115–132. doi: 10.3322/caac.21338. [DOI] [PubMed] [Google Scholar]
- 5.D'Antonio JM, Ma CQ, Monzon FA, et al. Longitudinal analysis of androgen deprivation of prostate cancer cells identifies pathways to androgen independence. Prostate. 2008;68(7):698–714. doi: 10.1002/pros.20677. [DOI] [PubMed] [Google Scholar]
- 6.Dennis G, Jr, Sherman BT, Hosack DA, et al. DAVID: Database for Annotation, Visualization, and Integrated Discovery. Genome Biol. 2003;4(5):P3. doi: 10.1186/gb-2003-4-5-p3. [DOI] [PubMed] [Google Scholar]
- 7.Duś-Szachniewicz K, Woźniak M, Nelke K, et al. Protein tyrosine phosphatase receptor R and Z1 expression as independent prognostic indicators in oral squamous cell carcinoma. Head Neck. 2015;37(12):1816–1822. doi: 10.1002/hed.23835. [DOI] [PubMed] [Google Scholar]
- 8.Espinoza I, Pochampally R, Xing F, et al. Notch signaling: targeting cancer stem cells and epithelial-to-mesenchymal transition. Onco Targets Ther. 2013;6:1249–1259. doi: 10.2147/ott.s36162. [DOI] [PMC free article] [PubMed] [Google Scholar]
- 9.Gautier L, Cope L, Bolstad BM, et al. affy–analysis of Affymetrix GeneChip data at the probe level. Bioinformatics. 2004;20(3):307–315. doi: 10.1093/bioinformatics/btg405. [DOI] [PubMed] [Google Scholar]
- 10.Gene Ontology Consortium. The Gene Ontology (GO) database and informatics resource. Nucleic Acids Res. 2004;32(S1):D258–D261. doi: 10.1093/nar/gkh036. [DOI] [PMC free article] [PubMed] [Google Scholar]
- 11.Guo YZ, Sun HH, Wang XT, et al. Transcriptomic analysis reveals key lncRNAs associated with ribosomal biogenesis and epidermis differentiation in head and neck squamous cell carcinoma. J Zhejiang Univ-Sci B (Biomed & Biotechnol) 2018;19(9):674–688. doi: 10.1631/jzus.B1700319. [DOI] [PMC free article] [PubMed] [Google Scholar]
- 12.Heidenreich A, Bastian PJ, Bellmunt J, et al. EAU guidelines on prostate cancer. Part II: treatment of advanced, relapsing, and castration-resistant prostate cancer. Eur Urol. 2014;65(2):467–479. doi: 10.1016/j.eururo.2013.11.002. [DOI] [PubMed] [Google Scholar]
- 13.Kanehisa M, Goto S. KEGG: Kyoto Encyclopedia of Genes and Genomes. Nucleic Acids Res. 2000;28(1):27–30. doi: 10.1093/nar/28.1.27. [DOI] [PMC free article] [PubMed] [Google Scholar]
- 14.Kwon OJ, Zhang L, Wang JH, et al. Notch promotes tumor metastasis in a prostate-specific Pten-null mouse model. J Clin Invest. 2016;126(7):2626–2641. doi: 10.1172/jci84637. [DOI] [PMC free article] [PubMed] [Google Scholar]
- 15.Laczmanska I, Karpinski P, Bebenek M, et al. Protein tyrosine phosphatase receptor-like genes are frequently hypermethylated in sporadic colorectal cancer. J Hum Genet. 2013;58(1):11–15. doi: 10.1038/jhg.2012.119. [DOI] [PubMed] [Google Scholar]
- 16.Li DM, Masiero M, Banham AH, et al. The Notch ligand Jagged1 as a target for anti-tumor therapy. Front Oncol, 4:254. 2014 doi: 10.3389/fonc.2014.00254. [DOI] [PMC free article] [PubMed] [Google Scholar]
- 17.Lin Y, Shen Z, Song X, et al. Comparative transcriptomic analysis reveals adriamycin-induced apoptosis via p53 signaling pathway in retinal pigment epithelial cells. J Zhejiang Univ-Sci B (Biomed & Biotechnol) 2018;19(12):895–909. doi: 10.1631/jzus.B1800408. [DOI] [PMC free article] [PubMed] [Google Scholar]
- 18.Logothetis CJ, Lin SH. Osteoblasts in prostate cancer metastasis to bone. Nat Rev Cancer. 2005;5(1):21–28. doi: 10.1038/nrc1528. [DOI] [PubMed] [Google Scholar]
- 19.Menigatti M, Cattaneo E, Sabates-Bellver J, et al. The protein tyrosine phosphatase receptor type R gene is an early and frequent target of silencing in human colorectal tumorigenesis. Mol Cancer, 8:124. 2009 doi: 10.1186/1476-4598-8-124. [DOI] [PMC free article] [PubMed] [Google Scholar]
- 20.Munkley J, Lafferty NP, Kalna G, et al. Androgen-regulation of the protein tyrosine phosphatase PTPRR activates ERK1/2 signalling in prostate cancer cells. BMC Cancer, 15:9. 2015 doi: 10.1186/s12885-015-1012-8. [DOI] [PMC free article] [PubMed] [Google Scholar]
- 21.Noordman YE, Jansen PAM, Hendriks WJAJ. Tyrosine-specific MAPK phosphatases and the control of ERK signaling in PC12 cells. J Mol Signal, 1:4. 2006 doi: 10.1186/1750-2187-1-4. [DOI] [PMC free article] [PubMed] [Google Scholar]
- 22.Ritchie ME, Phipson B, Wu D, et al. limma powers differential expression analyses for RNA-sequencing and microarray studies. Nucleic Acids Res. 2015;43(7):e47. doi: 10.1093/nar/gkv007. [DOI] [PMC free article] [PubMed] [Google Scholar]
- 23.Santagata S, Demichelis F, Riva A, et al. JAGGED1 expression is associated with prostate cancer metastasis and recurrence. Cancer Res. 2004;64(19):6854–6857. doi: 10.1158/0008-5472.can-04-2500. [DOI] [PubMed] [Google Scholar]
- 24.Schmitt I, Bitoun E, Manto M. PTPRR, cerebellum, and motor coordination. Cerebellum. 2009;8(2):71–73. doi: 10.1007/s12311-009-0118-4. [DOI] [PubMed] [Google Scholar]
- 25.Sethi N, Dai XD, Winter CG, et al. Tumor-derived Jagged1 promotes osteolytic bone metastasis of breast cancer by engaging Notch signaling in bone cells. Cancer Cell. 2011;19(2):192–205. doi: 10.1016/j.ccr.2010.12.022. [DOI] [PMC free article] [PubMed] [Google Scholar]
- 26.Shannon P, Markiel A, Ozier O, et al. Cytoscape: a software environment for integrated models of biomolecular interaction networks. Genome Res. 2003;13(11):2498–2504. doi: 10.1101/gr.1239303. [DOI] [PMC free article] [PubMed] [Google Scholar]
- 27.Shou JY, Ross S, Koeppen H, et al. Dynamics of Notch expression during murine prostate development and tumorigenesis. Cancer Res. 2001;61(19):7291–7297. [PubMed] [Google Scholar]
- 28.Siegel RL, Miller KD, Jemal A. Cancer statistics, 2019. CA Cancer J Clin. 2019;69(1):7–34. doi: 10.3322/caac.21551. [DOI] [PubMed] [Google Scholar]
- 29.Su L, Song X, Xue Z, et al. Network analysis of microRNAs, transcription factors, and target genes involved in axon regeneration. J Zhejiang Univ-Sci B (Biomed & Biotechnol) 2018;19(4):293–304. doi: 10.1631/jzus.B1700179. [DOI] [PMC free article] [PubMed] [Google Scholar]
- 30.Su PH, Lin YW, Huang RL, et al. Epigenetic silencing of PTPRR activates MAPK signaling, promotes metastasis and serves as a biomarker of invasive cervical cancer. Oncogene. 2013;32(1):15–26. doi: 10.1038/onc.2012.29. [DOI] [PubMed] [Google Scholar]
- 31.Su Q, Zhang B, Zhang L, et al. Jagged1 upregulation in prostate epithelial cells promotes formation of reactive stroma in the Pten null mouse model for prostate cancer. Oncogene. 2017;36(5):618–627. doi: 10.1038/onc.2016.232. [DOI] [PMC free article] [PubMed] [Google Scholar]
- 32.Sun YT, Wang BE, Leong KG, et al. Androgen deprivation causes epithelial-mesenchymal transition in the prostate: implications for androgen-deprivation therapy. Cancer Res. 2012;72(2):527–536. doi: 10.1158/0008-5472.can-11-3004. [DOI] [PubMed] [Google Scholar]
- 33.Szklarczyk D, Morris JH, Cook H, et al. The STRING database in 2017: quality-controlled protein–protein association networks, made broadly accessible. Nucleic Acids Res. 2017;45(D1):D362–D368. doi: 10.1093/nar/gkw937. [DOI] [PMC free article] [PubMed] [Google Scholar]
- 34.Tang ZF, Li CW, Kang BX, et al. GEPIA: a web server for cancer and normal gene expression profiling and interactive analyses. Nucleic Acids Res. 2017;45(W1):W98–W102. doi: 10.1093/nar/gkx247. [DOI] [PMC free article] [PubMed] [Google Scholar]
- 35.Terada N, Shimizu Y, Kamba T, et al. Identification of EP4 as a potential target for the treatment of castration-resistant prostate cancer using a novel xenograft model. Cancer Res. 2010;70(4):1606–1615. doi: 10.1158/0008-5472.can-09-2984. [DOI] [PubMed] [Google Scholar]
- 36.Watson PA, Arora VK, Sawyers CL. Emerging mechanisms of resistance to androgen receptor inhibitors in prostate cancer. Nat Rev Cancer. 2015;15(12):701–711. doi: 10.1038/nrc4016. [DOI] [PMC free article] [PubMed] [Google Scholar]
- 37.Weinstein JN, Collisson EA, Mills GB, et al. The Cancer Genome Atlas Pan-Cancer analysis project. Nat Genet. 2013;45(10):1113–1120. doi: 10.1038/ng.2764. [DOI] [PMC free article] [PubMed] [Google Scholar]
- 38.Woźniak M, Gamian E, Łaczmańska I, et al. Immunohistochemical and Western blot analysis of two protein tyrosine phosphatase receptors, R and Z1, in colorectal carcinoma, colon adenoma and normal colon tissues. Histol Histopathol. 2014;29(5):635–639. doi: 10.14670/HH-29.10.635. [DOI] [PubMed] [Google Scholar]
- 39.Yong T, Sun A, Henry MD, et al. Down regulation of CSL activity inhibits cell proliferation in prostate and breast cancer cells. J Cell Biochem. 2011;112(9):2340–2351. doi: 10.1002/jcb.23157. [DOI] [PubMed] [Google Scholar]
- 40.Zhu H, Zhou XC, Redfield S, et al. Elevated Jagged-1 and Notch-1 expression in high grade and metastatic prostate cancers. Am J Transl Res. 2013;5(3):368–378. [PMC free article] [PubMed] [Google Scholar]
- 41.Zhu H, Li Y, Wang M, et al. Analysis of cardiovascular disease-related NF-κB-regulated genes and microRNAs in TNFα-treated primary mouse vascular endothelial cells. J Zhejiang Univ-Sci B (Biomed & Biotechnol) 2019;20(10):803–815. doi: 10.1631/jzus.B1800631. [DOI] [PMC free article] [PubMed] [Google Scholar]
Associated Data
This section collects any data citations, data availability statements, or supplementary materials included in this article.
Supplementary Materials
Clinical characteristics of samples in this study
Expression of the PTPRR in Grasso PCa
Data Availability Statement
The data that support the findings of this study are openly available in Gene Expression Omnibus (GEO, https://www. ncbi.nlm.nih.gov/geo), and the code for analysis in this article can be obtained by emailing the corresponding author.