

Abstract
Genomic methodologies offer unprecedented opportunities for statistically robust studies of species broadly distributed in environments conducive to high gene flow, providing valuable information for wildlife conservation and management. Here, we sequence restriction site‐associated DNA to characterize genome‐wide single nucleotide polymorphisms (SNPs) in a broadly distributed and highly migratory large pelagic fish, striped marlin (Kajikia audax). Assessment of over 4,000 SNPs resolved spatiotemporal patterns of genetic connectivity throughout the species range in the Pacific and, for the first time, Indian oceans. Individual‐based cluster analyses identified six genetically distinct populations corresponding with the western Indian, eastern Indian, western South Pacific, and eastern central Pacific oceans, as well as two populations in the North Pacific Ocean (F ST = 0.0137–0.0819). F ST outlier analyses identified a subset of SNPs (n = 59) putatively under the influence of natural selection and capable of resolving populations separated by comparatively high degrees of genetic differentiation. Temporal collections available for some regions demonstrated the stability of allele frequencies over three to five generations of striped marlin. Relative migration rates reflected lower levels of genetic connectivity between Indian Ocean populations (m R ≤ 0.37) compared with most populations in the Pacific Ocean (m R ≥ 0.57) and highlight the importance of the western South Pacific in facilitating gene flow between ocean basins. Collectively, our results provide novel insights into rangewide population structure for striped marlin and highlight substantial inconsistencies between genetically distinct populations and stocks currently recognized for fisheries management. More broadly, we demonstrate that species capable of long‐distance dispersal in environments lacking obvious physical barriers to movement can display substantial population subdivision that persists over multiple generations and that may be facilitated by both neutral and adaptive processes. Importantly, surveys of genome‐wide markers enable inference of population‐level relationships using sample sizes practical for large pelagic fishes of conservation concern.
Keywords: DArT, genetic connectivity, highly migratory, large pelagic fish, population genomics, SNPs, striped marlin, temporal stability
1. INTRODUCTION
Genetic studies of wild populations have assisted the development of scientifically informed management and conservation efforts over the past five decades (Frankel, 1974; Franklin, 1980; Simberloff, 1988; Soulé, 1985). However, for many species of conservation concern, information on spatiotemporal patterns of genetic connectivity remains limited, challenging the ability of resource managers to develop recovery plans that consider genetic attributes of distinct populations (Frankham, 2010; Funk, McKay, Hohenlohe, & Allendorf, 2012; Palsbøll, Bérubé, & Allendorf, 2006). This is frequently the case for large pelagic fishes, which display broad spatial distributions and highly migratory life histories, and seasonally occupy multiple domestic and international management jurisdictions (Meltzer, 1994). The advent of next‐generation sequencing (NGS; e.g., Mardis, 2008) represents a particularly important advancement in genetic insights possible with sampling designs practicable for large pelagic fishes, especially those that also occur in low frequency. Surveys of genome‐wide variation are capable of providing new information on population structure and movement patterns to improve conservation and management efforts for these species.
The now widespread availability of NGS enables rapid and cost‐effective surveys of thousands to hundreds of thousands of molecular markers across entire genomes, facilitating statistically robust assessments of neutral and adaptive genomic variation in nonmodel systems. Though such assessments have progressed toward unraveling complex relationships between fitness‐related traits and underlying genomic architectures in more easily accessible systems (e.g., Pacific salmonids [Oncorhynchus spp., Salmo spp.]; Ayllon et al., 2015; Barson et al., 2015; Prince et al., 2017; Thompson et al., 2019), applications of NGS to large pelagic fishes are just getting started, and recent studies illustrate the utility of genomic methods for resolving spatial patterns of connectivity in pelagic systems. For example, results from early comparisons of traditional markers (e.g., allozymes, mtDNA, microsatellites) in yellowfin tuna (Thunnus albacares) from the Atlantic, Pacific, and Indian oceans were either consistent with genetic homogeneity or offered only preliminary evidence for population subdivision (Appleyard, Grewe, Innes, & Ward, 2001; Dammannagoda, Hurwood, & Mather, 2008; Díaz‐Jaimes & Uribe‐Alcocer, 2003, 2006; Ely et al., 2005; Scoles & Graves, 1993; Ward, Eiliott, Grewe, Smolenski, & Sea, 1994; Wu et al., 2010). In comparison, recent surveys of genome‐wide single nucleotide polymorphisms (SNPs) provide definitive evidence for genetically distinct populations of yellowfin tuna within and between ocean basins (Barth, Damerau, Matschiner, Jentoft, & Hanel, 2017; Grewe et al., 2015; Mullins, McKeown, Sauer, & Shaw, 2018; Pecoraro et al., 2016), supplying important information to improve management efforts for this commercially harvested species. Applications of NGS to large pelagic fishes have so far prioritized species of high commercial value that also occur in large numbers (e.g., schooling species). Considerable potential exists for genomic surveys to provide valuable information for additional large pelagic fishes of conservation concern, including those found at comparatively lower frequencies or of lesser commercial value.
Striped marlin (Kajikia audax) is a large pelagic fish broadly distributed in temperate, subtropical, and tropical waters of the Pacific and Indian oceans (Nakamura, 1985), and supports valuable recreational and commercial fisheries throughout the species range. Tagging studies demonstrate that striped marlin is capable of long‐distance movements spanning hundreds to thousands of kilometers over periods less than one year (Domeier, 2006; Holdsworth, Sippel, & Block, 2009; Ortiz et al., 2003; Sippel, Davie, Holdsworth, & Block, 2007), presumably to exploit seasonal spawning and feeding grounds. Despite such high dispersal capabilities, striped marlin display some degree of site fidelity to regions largely corresponding with known spawning grounds (Domeier, 2006; Ortiz et al., 2003). Genetic studies based on microsatellites and mtDNA provide evidence for at least four genetically distinct populations of striped marlin in the Pacific Ocean (McDowell & Graves, 2008; Purcell & Edmands, 2011), and these results are generally consistent with available information on seasonal movements and spawning behavior. However, incongruities in results between genetic studies reflect uncertain population‐level relationships for striped marlin in the central North Pacific and eastern central Pacific oceans, complicating the delineation of biologically relevant management units in these regions. Additionally, population structure for striped marlin in the Indian Ocean remains unexplored, and the degree of genetic connectivity between ocean basins is unknown.
Practical challenges to implementing biologically representative sampling designs have impeded rangewide studies of biological and genetic relationships in striped marlin. Catches of striped marlin outside of seasonal feeding or spawning assemblages are typically low, and known assemblages are often difficult to access. The location and timing of striped marlin spawning are also poorly understood, and few efforts exist to sample larvae or reproductively active adults. These challenges have resulted in a lack of information on spatial genetic variation across the full range of striped marlin, leading to mismatches between populations characterized by distinct biological processes and stocks recognized by regional fisheries management organizations (RFMOs). For example, a single ocean‐wide stock is presently recognized in RFMO assessment and management efforts in the Indian Ocean due to insufficient information on population structure. Additionally, uncertain population structure in some regions of the Pacific Ocean is further complicated by continued use of stock boundaries inconsistent with populations evident from available genetic and biological information. Such mismatches may be especially problematic for striped marlin because this species is estimated to be overfished or experiencing unsustainable levels of fishing effort in regions across the Indo‐Pacific (IATTC, 2018; WCPFC, 2012, 2018). Studies that provide information to improve rangewide management and conservation efforts for striped marlin are timely not only because of the unsustainable status of most stocks (Collette et al., 2011; Cullis‐Suzuki & Pauly, 2010), but also because habitat utilization and seasonal movements of striped marlin and other large pelagic fishes rely on environmental cues progressively influenced by a changing global climate (Carlisle et al., 2017; Dell'Apa, Carney, Davenport, & Vernon, 2018; Duery, Bopp, & Maury, 2014; Hazen et al., 2012; Mislan, Deutsch, Brill, Dunne, & Sarmiento, 2017; Muhling, Lee, Lamkin, & Liu, 2011; Pentz, Klenk, Ogle, & Fisher, 2018).
Here, we employ NGS of restriction site‐associated DNA (Andrews, Good, Miller, Luikart, & Hohenlohe, 2016; Baird et al., 2008) to assess spatiotemporal patterns of genetic variation in striped marlin across the Pacific and Indian oceans. Relative to previous genetic studies of striped marlin, NGS‐based methodology facilitates statistically robust assessment of genome‐wide variation (Helyar et al., 2011; Luikart, England, Tallmon, Jordan, & Taberlet, 2003; Nielsen, Hemmer‐Hansen, Larsen, & Bekkevold, 2009) despite pragmatic constraints on sampling efforts for this species. The primary objectives of this study were to: (a) determine the number and geographic extent of striped marlin populations in the Pacific and Indian oceans, (b) evaluate whether genetically distinct populations correspond with genetic variation potentially influenced by natural selection, and (c) assess the multigenerational stability of observed genomic variation. This work represents the first genomic assessment of striped marlin, and results provide novel insights into genetic connectivity within and between ocean basins, the role of putatively neutral and adaptive processes in facilitating population subdivision, and the stability of allele frequencies over decadal time periods.
2. METHODS
2.1. Sample collection and DNA isolation
Striped marlin tissue samples were opportunistically collected during the period 1992 through 2017 from locations across the species range, including waters off South Africa (SAF), Kenya (KEN), and northwestern Australia (WAUS) in the Indian Ocean, and eastern Australia (EAUS), New Zealand (NZ), Japan (JAP), Taiwan (TAI), Hawaii (HAW), southern California (CAL), Baja California (BAJA), Ecuador (ECU), and Peru (PERU) in the Pacific Ocean (Table 1; Figure 1). Samples consisted of fin tissue from striped marlin released alive following capture by recreational anglers or from striped marlin caught incidentally by commercial pelagic longline vessels targeting tunas and swordfish. Additional samples consisting of muscle tissue were obtained from local markets. All samples were preserved in 95% ethanol or a 10% dimethyl sulfoxide solution (Seutin, White, & Boag, 1991) and maintained at room temperature until DNA isolation. Total genomic DNA was isolated from tissues using a DNeasy Blood & Tissue Kit (Qiagen) or a ZR‐96 Genomic DNA Kit (Zymo Research). DNA from each sample was visualized on 1.5% agarose gels, and isolations that recovered high molecular weight DNA were quantified using a Qubit 2 fluorometer and dsDNA BR assays (Thermo Fisher Scientific). Isolations with sufficient DNA for NGS were normalized to 700 ng total DNA at 50 ng per µL and stabilized in GenTegra‐DNA (GenTegra LLC). Stabilized high‐quality DNA was submitted to Diversity Arrays Technology Pty. Ltd. (DArT PL; Canberra, Australia) for DArTseq™ 1.0 genotyping.
Table 1.
Details for striped marlin (Kajikia audax) samples analyzed in this study
| Sampling region | Code | Year | No. of individuals | Total |
|---|---|---|---|---|
| Indian Ocean | ||||
| South Africa | SAF | 2017 | 1 | 11 |
| 2016 | 3 | |||
| 2015 | 7 | |||
| Kenya | KEN | 2016 | 13 | 27 |
| 2015 | 14 | |||
| Western Australia | WAUS | 2016 | 8 | 8 |
| Total | 46 | |||
| Pacific Ocean | ||||
| Eastern Australia | EAUS | 2015 | 3 | 35 |
| 2012 | 3 | |||
| 2011 | 7 | |||
| 2010 | 6 | |||
| 1994 | 16 | |||
| New Zealand | NZ | 2017 | 22 | 22 |
| Japan | JAP | 2015 | 18 | 18 |
| Taiwan | TAI | 2016 | 4 | 11 |
| 2015 | 5 | |||
| 2014 | 2 | |||
| Hawaii | HAW | 2015 | 21 | 21 |
| California | CAL | 2016 | 2 | 15 |
| 2000 | 13 | |||
| Baja California | BAJA | 2015 | 21 | 21 |
| Ecuador | ECU | 2016 | 22 | 37 |
| 1992 | 15 | |||
| Peru | PERU | 2016 | 19 | 19 |
| Total | 199 | |||
| Grand total | 245 | |||
Figure 1.
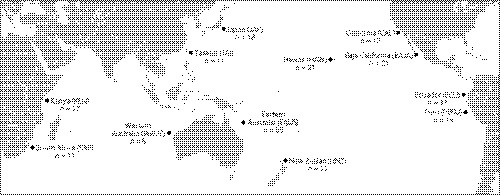
Map displaying sampling locations and sample sizes for striped marlin (Kajikia audax) evaluated in this study. Points correspond with representative sampling region
2.2. DArTseq™ 1.0 genotyping
DArTseq™ genotyping (Sansaloni et al., 2011) involves genomic complexity reduction followed by NGS and is similar to other commonly utilized approaches for NGS of reduced genomic representations (e.g., double‐digest restriction site‐associated DNA sequencing; Peterson, Weber, Kay, Fisher, & Hoekstra, 2012). Genomic complexity reduction was principally performed as described in Kilian et al. (2012), but with a double restriction enzyme (RE) digestion and ligation with RE‐specific adapters. Four RE combinations were tested at the DArT PL facility, and digestion with PstI and SphI was selected based on the size of the representation and the fraction of the genome selected. Custom proprietary adapters used in ligation reactions were similar to those described by Elshire et al. (2011) and Kilian et al. (2012) (see Appendix S1 for detailed information). Samples were normalized and pooled at equimolar ratios into multiplex libraries each comprising 94 samples and two controls, and sequenced for 77 cycles of single‐end sequencing on single lanes of an Illumina HiSeq 2500 platform (Illumina, Inc.). Resulting sequence data were analyzed in a proprietary DArTseq™ analytical software pipeline, wherein demultiplexing, quality filtering, variant calling, and generation of final genotypes were performed in sequential primary and secondary workflows (see Appendix S1). DArT PL supplied a final genotype matrix containing 61,908 SNP loci and metadata associated with each locus.
2.3. SNP quality filtering
Additional quality filtering of SNP data received from DArT PL was performed in R version 3.3.1 (R Core Team, 2017) using the dartR v0.93 package (Gruber, Unmack, Berry, & Georges, 2018). Loci missing ≥10% of genotype calls were excluded from the dataset. Samples missing ≥20% of genotype calls were also excluded. To retain only high‐quality SNPs with reliable genotype calls, loci with average reproducibility <95% were removed. All monomorphic loci were also removed. In instances where more than one SNP originated from a read alignment, a single SNP was randomly retained to reduce the probability of linked loci in the final dataset. Finally, any locus with a minor allele frequency <0.05 across all samples was removed to reduce the probability of PCR error or ascertainment bias resulting from nonrandom sampling of a gene pool (Bradbury et al., 2011; Roesti, Salzburger, & Berner, 2012).
2.4. Statistical analyses
2.4.1. Identification of genetically distinct populations
We employed multivariate analyses and Bayesian‐based simulations to infer the number and geographic extent of genetically distinct populations of striped marlin represented in our dataset. Multivariate methods were selected for exploring population structure because these methods are computationally efficient and unconstrained by assumptions of Hardy–Weinberg equilibrium (HWE; Jombart, Pontier, & Dufour, 2009). Principal coordinate analysis (PCoA) and discriminant analysis of principal components (DAPC; Jombart, Devillard, & Balloux, 2010) were performed using the R packages dartR and adegenet v2.0.1 (Jombart, 2008), respectively. Individuals were assigned to groups prior to DAPC using successive K‐means clustering. The most likely values for K were determined by generating a Bayesian information criterion (BIC) score for each K scenario and selecting those scenarios with the lowest BIC scores to assess with DAPC.
Population structure was also evaluated using the Bayesian simulation algorithm implemented in STRUCTURE v2.3.4 (Falush, Stephens, & Pritchard, 2003; Hubisz, Falush, Stephens, & Pritchard, 2009; Pritchard, Stephens, & Donnelly, 2000). Because STRUCTURE assumes loci conform to the expectations of HWE, we first identified loci that violated these expectations using the exact methodological approach described by Wigginton, Cutler, and Abecasis (2005). HWE was evaluated within sample collections organized by sampling location, and statistical significance of HWE comparisons was determined using a critical value corrected by a modified false discovery rate (Benjamini & Yekutieli, 2001; Narum, 2006). Loci that did not conform to the expectations of HWE in more than one sample collection were removed. All STRUCTURE analyses were performed using an admixture model of ancestry (Falush et al., 2003), a burn‐in of 50,000 followed by 500,000 Markov chain Monte Carlo simulations, and three iterations of each K. Default values were used for all other STRUCTURE settings, including the lack of a location prior. Previous evaluations of STRUCTURE performance demonstrate that the presence of strongly differentiated genetic clusters may obfuscate resolution of weakly differentiated clusters (Janes et al., 2017; Vähä & Primmer, 2006; Waples & Gaggiotti, 2006). In preliminary analyses of our data, the highest levels of genetic differentiation were observed between striped marlin sampled from the western Indian Ocean and the northern and eastern Pacific Ocean. Thus, to improve resolution of more weakly differentiated clusters, we performed STRUCTURE analyses on three datasets: (a) all sample collections, (b) all Pacific Ocean and eastern Indian Ocean sample collections, and (c) all Indian Ocean and western South Pacific Ocean sample collections. Scenarios with K equal to two through eight were evaluated for each dataset. Results for each dataset were summarized in CLUMPP v1.1.2 (Jakobsson & Rosenberg, 2007) and visualized in DISTRUCT v1.1 (Rosenberg, 2004). The most likely K for each dataset was identified using Structure Harvester v0.6.94 (Earl & vonHoldt, 2012; Evanno, Regnaut, & Goudet, 2005). Results from multivariate analyses and STRUCTURE simulations were collectively evaluated to determine the most likely scenario of spatial population structure for the striped marlin represented in our dataset. Based on this information, sample collections were combined into groups representing genetically distinct populations.
2.4.2. SNPs putatively influenced by natural selection
To reduce the probability of committing type I or type II statistical errors (Lotterhos & Whitlock, 2014; Narum & Hess, 2011), we employed two approaches for identifying SNPs putatively under the influence of natural selection using a dataset in which loci not conforming to the expectations of HWE were removed. BayeScan v2.1 (Foll & Gaggiotti, 2008) implements a Bayesian‐based algorithm that compares allele frequencies among populations to directly estimate the probability that each locus is exposed to natural selection (Beaumont & Balding, 2004; Foll & Gaggiotti, 2008). We performed BayeScan analyses using 10,000 iterations each for the burn‐in, pilot runs, and final runs. We also used conservative prior odds for the neutral model (100:1) to reduce the probability of false positives in BayeScan results (Lotterhos & Whitlock, 2014). F ST outlier loci were identified from BayeScan output using a false discovery rate of 0.10. Loci putatively under the influence of natural selection were also identified using the FDIST2 outlier detection method (Beaumont & Nichols, 1996; Excoffier, Hofer, & Foll, 2009) implemented in Arlequin v3.5 (Excoffier & Lischer, 2010). This method assumes a finite island model of migration to obtain a distribution of F ST values across loci as a function of average heterozygosity within populations. Arlequin outlier detection analyses were performed with 500,000 simulations, and statistical significance was assessed using a p‐value of .05. A final list of SNPs putatively under the influence of natural selection included only those loci identified as outliers in both analyses. Because accurately distinguishing between loci exhibiting low levels of divergence due to balancing selection rather than neutral processes is challenging (Lotterhos & Whitlock, 2014; Whitlock & Lotterhos, 2015), particularly in high gene flow species, SNPs identified as putatively experiencing balancing selection were excluded from the final list of outlier loci. Sequences corresponding with final outlier loci were queried in an NCBI GenBank BLASTn v2.8.1 (Zhang, Schwartz, Wagner, & Miller, 2000) search to identify putative functions (search performed 17 March 2019). We only considered BLASTn hits with expect values <10−10.
To assess the relative contribution of SNPs putatively influenced by natural selection to observed population structure, we performed additional multivariate analyses using a dataset limited to F ST outlier loci. We also performed multivariate analyses using a subset of putatively neutral loci that contributed the most information to DAPC clustering. These loci were identified by performing DAPC using the full dataset, then scaling locus loadings, and calculating locus rank percentiles for discriminant functions one and two. Loci with rank percentiles ≥98.7% for each discriminant function were selected to produce a set of putatively neutral loci that corresponded with a similar number of markers as those identified in F ST outlier analyses. Any F ST outlier loci occurring in this putatively neutral set of markers were removed. For both datasets, PCoA and K‐means clustering followed by DAPC were performed as described above.
2.4.3. Genetic attributes of striped marlin populations
Populations of striped marlin resolved in multivariate and STRUCTURE analyses were characterized by assessing genetic diversity and the presence of SNPs exhibiting fixed differences among populations (i.e., private alleles) using a dataset in which loci not conforming to the expectations of HWE were removed. Observed and expected heterozygosities were calculated in the R packages poppR v2.5.0 (Kamvar, Tabima, & Grünwald, 2014) and dartR, respectively. We used the R package PopGenReport v3.0.0 (Adamack & Gruber, 2014) to calculate rarefaction allelic richness. dartR was used to evaluate populations for the presence of private alleles.
Because inferences of demographic relationships may be biased by loci that deviate from a neutral model of evolution (Beaumont & Nichols, 1996; Luikart et al., 2003), SNPs previously identified as F ST outliers were removed prior to calculating pairwise levels of genetic differentiation and population‐level inbreeding coefficients. Levels of genetic differentiation among populations were determined by calculating pairwise measures of F ST in Arlequin. Statistical significance of F ST values was assessed based on 10,000 permutations and a critical value corrected by a modified false discovery rate (Benjamini & Yekutieli, 2001; Narum, 2006). Inbreeding within populations was evaluated by calculating F IS in the R package diveRsity v1.9 (Keenan, McGinnity, Cross, Crozier, & Prodöhl, 2013). Confidence intervals (95%) for estimates of F IS were calculated based on 10,000 bootstrap iterations.
A putatively neutral dataset was also used to infer the degree of genetic connectivity among populations and to identify populations that serve as sources or sinks (Crowder & Norse, 2008; Howe, Davis, & Mosca, 1991), by calculating directional relative migration rates using the divMigrate function (Sundqvist, Keenan, Zackrisson, Prodohl, & Kleinhans, 2016) in the R package diveRsity. This approach provides relative bidirectional estimates of gene flow based on measures of genetic differentiation between populations, and is considerably less computationally intensive than maximum‐likelihood or Bayesian methods (e.g., Beerli & Palczewski, 2010; Hey, 2010) for estimating migration rates from large genomic datasets. We performed divMigrate calculations using all available measures of genetic differentiation so that the consistency of estimates among metrics could be assessed. Confidence intervals (95%) of relative migration estimates were calculated based on 10,000 bootstrap iterations.
2.4.4. Temporal stability of population structure
To evaluate the temporal stability of allele frequencies within geographically distant regions, we used collections with sample sizes ≥15 individuals per sampling period, and for which temporally spaced collections spanned at least one generation of striped marlin (average generation time estimated to be 4.4 years; Collette et al., 2011). These included striped marlin sampled off Ecuador in the years 1992 (ECU 1992, n = 15; Table 1) and 2016 (ECU 2016, n = 22), spanning approximately five generations of striped marlin. We also evaluated striped marlin sampled off eastern Australia in the year 1994 (EAUS 1994, n = 16) and in the years 2010, 2011, 2012, and 2015 (EAUS 2010–2015, n = 19), the latter of which were pooled to facilitate the valuable comparison of sample collections spanning 16–21 years (approximately three to five generations of striped marlin). Multigenerational stability of allele frequencies for temporally spaced sample collections was assessed by performing multivariate analyses (PCoA and DAPC) using the full dataset as described above, except only a scenario of K = 2 was evaluated with DAPC for each geographic region. This clustering scenario comprised groups of samples corresponding with each sampling period. F ST values were also calculated between temporally spaced collections as described above using a dataset in which loci not conforming to the expectations of HWE and selective neutrality were removed.
2.4.5. Population assignment
We assessed the ability of SNPs resolved in this study to accurately assign individuals to populations and to identify a minimum subset of loci for population assignment, using the R package assigner (Gosselin, Benestan, & Bernatchez, 2015). Assignment analyses were performed using a dataset in which loci not conforming to the expectations of HWE were removed. The methodological approach described by Anderson (2010) was implemented by randomly selecting 80% and 20% of samples from each population for training and holdout datasets, respectively. Training samples were used to rank loci based on F ST, and holdout samples were assigned to populations using DAPC as implemented in adegenet. Within DAPC assignment analyses, the function predict.dapc was used to predict posterior membership probabilities to each population for each individual. We evaluated scenarios where 100–1,000 markers (in increments of 100) were used for population assignment. Analyses were repeated five times for each marker subset, and final results were produced by averaging across iterations.
3. RESULTS
3.1. SNP quality filtering
The original DArT PL dataset consisted of 61,908 SNP loci (Table 2). A total of 4,206 SNPs remained after quality filtering based on percent missing genotype calls, average reproducibility, monomorphic loci, the presence of more than one SNP per read alignment, and minor allele frequencies <0.05 across all samples. Four samples were missing genotype calls at ≥20% of loci and were excluded from further analyses. Collectively, these filtering steps resulted in a dataset comprising 245 individuals (Table 1) genotyped across 4,206 SNPs (Table 2). This dataset is hereafter referred to as the “full dataset.”
Table 2.
Number of single nucleotide polymorphism (SNP) loci retained after each filtering step
| Filter | No. of loci retained |
|---|---|
| Loci received from Diversity Arrays Technology Pty. Ltd. | 61,908 |
| Quality filter | |
| Loci missing ≥ 10% genotypes | 41,613 |
| Samples missing ≥ 20% genotypes | 11,896 |
| Locus average reproducibility < 95% | 11,831 |
| Monomorphic loci | 11,831 |
| More than one SNP per read alignment | 10,220 |
| Locus minor allele frequency < 0.05 | 4,206 |
| Hardy–Weinberg equilibrium | |
| p < .006 in more than one sample collection | 4,165 |
| Outlier identification | |
| Putatively neutral | 4,106 |
| Putatively adaptive | 59 |
3.2. Identification of genetically distinct populations
Multivariate analyses and Bayesian simulations were used to delineate populations of striped marlin using the full dataset and a dataset in which loci not conforming to the expectations of HWE were removed, respectively. At least five distinct clusters were resolved on PCoA axes one and two, which collectively explained 6.61% of total genetic variation (Figure 2). These clusters corresponded with striped marlin from the eastern central Pacific Ocean (BAJA, ECU, and PERU), North Pacific Ocean (JAP, TAI, HAW, and CAL), western South Pacific Ocean (EAUS and NZ), eastern Indian Ocean (WAUS), and western Indian Ocean (SAF and KEN). These clusters were also resolved on additional PCoA axes (Figures S1 and S2). Eight striped marlin grouped with collections geographically distant from their sampling location, including four fish sampled off Hawaii and three fish sampled off Ecuador that clustered with striped marlin from the western South Pacific Ocean (EAUS and NZ). Similarly, one fish sampled off California grouped with striped marlin collected from the eastern central Pacific Ocean (BAJA, ECU, and PERU). These eight individuals are presumed to reflect movements between geographically distant regions and are hereafter referred to as putative migrants.
Figure 2.
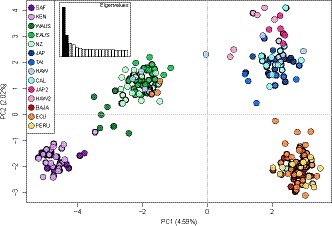
Axes one and two resulting from principal coordinate analysis (PCoA) of the full dataset (n = 4,206 SNPs). Percentage of total variation explained by each axis is shown. Sample collections are labeled as in Table 1 and colored according to the legend. Similar colors are used to highlight regional populations. Inset at top left shows eigenvalues associated with the PCoA; black bars correspond with plotted axes
Results from DAPC of SNP genotypes revealed hierarchical relationships among multiple genetically distinct groups of striped marlin. BICs generated for K values of one through twelve ranged from 1,279.44 to 1,307.55 and were lowest for the scenario with K equal to two (BIC = 1,274.45), but were also low for K equal to three through six (BIC = 1,275.47–1,283.90). In the scenario with K equal to two, one cluster comprised all Indian Ocean collections plus EAUS and NZ, and a second cluster comprised all remaining Pacific Ocean collections. The scenario with K equal to three also resolved a cluster comprising EAUS, NZ, and Indian Ocean collections, as well as clusters corresponding with striped marlin from the North Pacific Ocean (JAP, TAI, HAW, and CAL) and from the eastern central Pacific Ocean (BAJA, ECU, and PERU). These clusters were again resolved in the scenario with K equal to four (Figure 3a), except striped marlin from Oceania (WAUS, EAUS, and NZ) formed a cluster distinct from western Indian Ocean collections (SAF and KEN). These four clusters were resolved in the scenario with K equal to five, except a subset of fish sampled off Japan (n = 6) and Hawaii (n = 6; hereafter referred to as JAP2 and HAW2, respectively) comprised a fifth cluster also apparent in results from PCoA (Figures 2, S1 and S2). For K equal to six, an additional cluster corresponding with the eastern Indian Ocean (WAUS) was resolved, though in some iterations of K‐means clustering this cluster was not apparent until K increased to seven (Figure S3). Scenarios corresponding with larger K values resulted in high degrees of admixture within groups, indicating overfitting of the DAPC statistical model (Figure 3). For each of the scenarios described here, DAPC produced clusters that were clearly resolved (i.e., nonoverlapping) in two‐dimensional plots (Figures 3b and S3b), except for the cluster comprising JAP2 and HAW2, which partially overlapped with the cluster containing remaining collections from the North Pacific Ocean (JAP, TAI, HAW, and CAL). Across K scenarios, the single putative migrant sampled off California consistently assigned to the cluster corresponding with striped marlin from the eastern central Pacific Ocean (BAJA, ECU, and PERU). The four putative migrants sampled off Hawaii and three putative migrants sampled off Ecuador consistently assigned to the cluster comprising striped marlin from the western South Pacific Ocean (EAUS and NZ).
Figure 3.
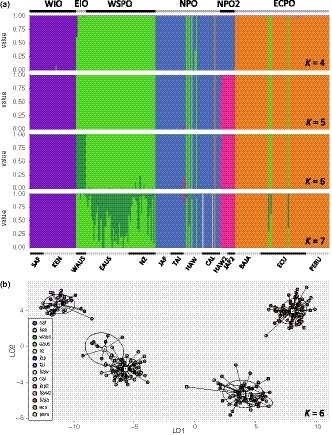
Results from discriminant analysis of principal components (DAPC) using the full dataset (n = 4,206 SNPs). (a) Bar plots colored to show posterior probabilities of assignment to a cluster. Scenarios for K equal to four through seven are shown. Horizontal bar at bottom delineates sample collections labeled as in Table 1. Horizontal bar at top delineates clusters corresponding with regional populations. (b) Scatter plot of discriminant functions one and two for scenario with K equal to six from (a). Samples are colored according to the legend. Inertia ellipses for each group are also shown
The groups of striped marlin resolved in multivariate analyses were also apparent in results from STRUCTURE. Testing of SNPs for conformance to HWE identified 41 loci that violated the expectations of HWE in more than one sample collection; these loci were excluded from STRUCTURE analyses. For STRUCTURE analyses performed with all sample collections, multiple distinct clusters were consistently resolved across scenarios of K equal to two through seven (Figure S4). These included a cluster corresponding with striped marlin from the western Indian Ocean (SAF, KEN) characterized by low degrees of shared ancestry with striped marlin from the Pacific Ocean. A second cluster comprising striped marlin from Oceania (WAUS, EAUS, NZ) was also evident. This cluster corresponded with high degrees of shared ancestry with striped marlin from elsewhere in both the Pacific and Indian oceans. Clusters representing striped marlin from the eastern central Pacific Ocean and the North Pacific Ocean were also apparent and were characterized by low degrees of shared ancestry with Indian Ocean fish. The putative migrants sampled off Hawaii and Ecuador displayed admixture proportions consistent with striped marlin from Oceania (Figure S4). Results from Structure Harvester indicated that the most likely K for this dataset was five. Examination of Q values estimated in the K equal five scenario revealed that in addition to distinct groups corresponding with the western Indian Ocean, Oceania, North Pacific Ocean, and eastern central Pacific Ocean, a fifth group corresponded with a subset of striped marlin from the North Pacific Ocean (JAP2, HAW2).
Similar groups of striped marlin were resolved in STRUCTURE analyses performed on datasets where highly differentiated sample collections were excluded. STRUCTURE analyses limited to striped marlin from the Pacific Ocean and eastern Indian Ocean revealed distinct clusters corresponding with Oceania (WAUS, EAUS, and NZ), the eastern central Pacific Ocean (BAJA, ECU, and PERU), and two regions of the North Pacific Ocean (JAP, TAI, HAW, CAL, JAP2, and HAW2; Figure S5b). Structure Harvester identified the most likely K for this dataset as four. STRUCTURE analyses limited to samples collected from the Indian Ocean and western South Pacific Ocean resolved at least two distinct clusters (Figure S5a). Two of these clusters corresponded with the western Indian Ocean (SAF and KEN) and western South Pacific Ocean (EAUS and NZ). Admixture proportions for striped marlin from the eastern Indian Ocean (WAUS) were intermediate to these clusters, and Structure Harvester identified the most likely K for this dataset as three. Results from STRUCTURE analyses performed without an admixture model of ancestry are included in the Appendix S1 (Figures S6 and S7).
We compared results from multivariate and STRUCTURE analyses to inform the grouping of sample collections into larger regional assemblages representing genetically distinct populations of striped marlin. Distinct clusters comprising striped marlin from the western Indian Ocean (WIO; sample collections SAF and KEN), eastern Indian Ocean (EIO; sample collection WAUS), western South Pacific Ocean (WSPO; sample collections EAUS and NZ), and eastern central Pacific Ocean (ECPO; sample collections BAJA, ECU, and PERU) were resolved by PCoA, DAPC, and STRUCTURE analyses, and these regions were recognized as distinct populations in subsequent analyses. Striped marlin from the North Pacific Ocean (NPO; sample collections JAP, TAI, HAW, and CAL) were also consistently identified as genetically distinct, as was a second group in the North Pacific Ocean (NPO2) corresponding with JAP2 and HAW2. Population‐level calculations were performed using these six populations of striped marlin. The eight fish identified as putative migrants were retained with their original sample collections so that biologically realistic assemblages of striped marlin could be characterized; however, some calculations were performed a second time with these samples excluded (described below).
3.3. SNPs putatively influenced by natural selection
From the 4,165 SNPs remaining after quality filtering and HWE testing, a genome scan performed using BayeScan identified 61 loci (1.46%) as outliers putatively under the influence of natural selection (Figure S8). F ST values associated with these SNPs ranged from 0.086 to 0.461, and all loci were candidates for divergent selection (α = .49–2.97). Results from outlier detection analyses performed using Arlequin included the identification of 229 SNPs (5.49%) as putatively under selection (Figure S9). Of those loci, 74 were candidates for balancing selection (per locus F ST no different from zero) and 155 were candidates for directional selection (per locus F ST = 0.089–0.679). Fifty‐nine of the SNPs identified as F ST outliers by BayeScan were identified by Arlequin as SNPs likely experiencing directional selection; these SNPs comprised a final list of outlier loci. Six of these loci produced BLASTn hits with expect values <10–10, but annotations for specific genes or gene functions were not returned (results not shown).
Multivariate analyses performed using a dataset limited to SNPs putatively under the influence of natural selection (n = 59) resolved populations that displayed comparatively large degrees of genetic differentiation based on the full dataset (WIO, WSPO, NPO, and ECPO), but failed to resolve weakly differentiated populations (EIO and NPO2; Figure 4; results from PCoA not shown). A total of 96 SNPs corresponded with rank percentiles ≥98.7% for DAPC discriminant functions one and two based on results from the full dataset. Fifty of these loci were previously identified as F ST outliers and excluded from multivariate analyses performed using remaining putatively neutral markers (n = 46). These analyses resolved populations that were separated by comparatively large degrees of genetic differentiation based on the full dataset (WIO, WSPO, NPO, and ECPO; Figure 4).
Figure 4.
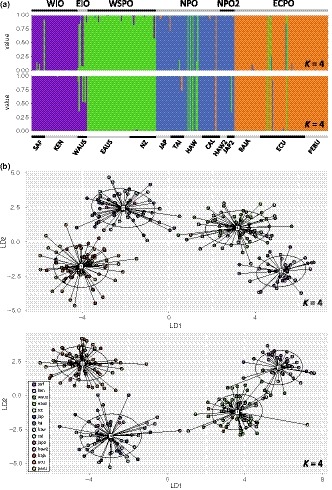
Results from discriminant analysis of principal components (DAPC) using datasets limited to a subset of putatively neutral loci (n = 46 SNPs; Panels a and b top) or loci putatively influenced by natural selection (n = 59 SNPs; Panels a and b bottom). Results from K equal to four are shown. (a) Bar plots colored to show posterior probabilities of assignment to a cluster. Horizontal bar at bottom delineates sample collections labeled as in Table 1. Horizontal bar at top delineates clusters corresponding with regional populations. (b) Scatter plots of discriminant functions one and two. Samples are colored according to the legend. Inertia ellipses for each group are also shown
3.4. Genetic attributes of striped marlin populations
To characterize basic genetic attributes of the striped marlin populations resolved in this study, we calculated population‐level diversity and assessed populations for the presence of private alleles. Genetic diversity metrics were calculated using the dataset in which loci not conforming to the expectations of HWE were removed (n = 4,165 SNPs). Rarefaction allelic richness and expected heterozygosity were highest for NPO2 (a R = 1.410, H E = 0.199; Table 3) and lowest for EIO (a R = 1.321, H E = 0.148); these populations correspond with the smallest sample sizes employed in this study (n = 8 and 12 samples, respectively). Measures of genetic diversity for EIO were comparable to those for WIO (a R = 1.332, H E = 0.149), which comprised a larger sample size (n = 38). This result indicates that the low levels of genetic diversity observed for EIO may reflect low genetic diversity for striped marlin across the Indian Ocean, rather than an artifact of the small sample size for this population. High levels of genetic diversity estimated for NPO2 may accurately reflect elevated genetic heterogeneity for this population, including relative to NPO (a R = 1.355, H E = 0.158); however, a larger number of samples for NPO2 are necessary to evaluate this hypothesis. Additional samples for this population are also necessary to assess mechanisms underlying the large difference between observed and expected heterozygosities (H O = 0.293, H E = 0.199). We did not observe any private alleles indicating fixed differences between populations, regardless of whether putative migrants were excluded from calculations. Genetic diversity metrics were also calculated for each sampling location (Table S1).
Table 3.
Genetic metrics calculated for striped marlin (Kajikia audax) populations resolved in this study
| Population | Sample collections | N | a R | H E | H O | F IS | F IS CI |
|---|---|---|---|---|---|---|---|
| WIO | SAF, KEN | 38 | 1.332 | 0.149 | 0.143 | 0.060 | 0.040–0.064 |
| EIO | WAUS | 8 | 1.321 | 0.148 | 0.137 | 0.060 | −0.078–0.052 |
| WSPO | EAUS, NZ | 57 | 1.356 | 0.16 | 0.164 | 0.013 | −0.015–0.025 |
| NPO | JAP, TAI, HAW, CAL | 53 | 1.355 | 0.158 | 0.157 | 0.068 | 0.042–0.080 |
| NPO2 | JAP2, HAW2 | 12 | 1.410 | 0.199 | 0.293 | −0.404 | −0.519– −0.374 |
| ECPO | BAJA, ECU, PERU | 77 | 1.349 | 0.157 | 0.160 | 0.041 | 0.017–0.054 |
Abbreviations: a R, rarefaction allelic richness; F IS, inbreeding coefficient; F IS CI, inbreeding coefficient 95% confidence intervals; H E, expected heterozygosity; H O, observed heterozygosity; N, population sample size.
Note: Values for diversity metrics are colored as a heat map where darker colors correspond with higher values.
Loci previously found to deviate from a neutral model of evolution (n = 59; described above) were excluded to produce a putatively neutral dataset prior to calculating pairwise measures of genetic differentiation, inbreeding coefficients, and relative migration rates. Pairwise F ST values ranged from 0.0137 between EIO and WSPO, to 0.0819 between WIO and NPO2 (Table 4). All F ST values were statistically significant at p = .000. Pairwise F ST values were also calculated for sampling locations (Table S2). Inbreeding coefficients ranged from −0.404 (95% CI = −0.519 to −0.374) in NPO2 to 0.068 (95% CI = 0.042–0.080) in NPO, indicating negligible levels of inbreeding within populations of striped marlin (Table 3). Relationships of genetic connectivity among populations inferred by calculating bidirectional relative migration rates (m R) were similar across all three metrics of genetic differentiation (Jost's D, GST, and NM; Alcala, Goudet, & Vuilleumier, 2014; Jost, 2008; Nei, 1973), except the magnitude of these relationships was lower for calculations based on Jost's D. We therefore describe results for only one of these metrics (NM; Figure 5). The largest relative migration rates (m R > 0.90) corresponded with gene flow in both directions between ECPO and NPO. High levels of genetic connectivity were also observed in both directions between NPO and WSPO (m R > 0.80), and from WIO to WSPO (m R = 0.71). Relative migration rates between WIO and EIO (m R = 0.28 for WIO to EIO; m R = 0.37 for EIO to WIO) were lower than migration rates between most Pacific Ocean populations. Additionally, relative migration rates between WIO and WSPO (m R ≥ 0.58) were higher than those between EIO and WSPO (m R ≤ 0.54), despite the closer geographic proximity of EIO to WSPO. Accurate inference of relative migration rates is difficult under scenarios of high gene flow (Sundqvist et al., 2016); this may be particularly so for EIO and WSPO, especially given the small sample size for EIO (n = 8). Migration rates calculated between Indian Ocean and Pacific Ocean populations of striped marlin indicate that genetic connectivity between ocean basins is primarily facilitated by WSPO. Relative migration rates calculated with putative migrants excluded from analyses produced relationships similar to those described here (Figure S10).
Table 4.
Pairwise F ST values (below diagonal) and corresponding p‐values (above diagonal) calculated between striped marlin (Kajikia audax) populations resolved in this study
| WIO | EIO | WSPO | NPO | NPO2 | ECPO | |
|---|---|---|---|---|---|---|
| WIO | – | 0.000 | 0.000 | 0.000 | 0.000 | 0.000 |
| EIO | 0.0241 | – | 0.000 | 0.000 | 0.000 | 0.000 |
| WSPO | 0.0284 | 0.0137 | – | 0.000 | 0.000 | 0.000 |
| NPO | 0.0516 | 0.0329 | 0.0214 | – | 0.000 | 0.000 |
| NPO2 | 0.0819 | 0.0707 | 0.0523 | 0.0361 | – | 0.000 |
| ECPO | 0.0614 | 0.0480 | 0.0359 | 0.0191 | 0.0524 | – |
F ST values are colored as a heat map where darker colors correspond with higher values. p‐values associated with each pairwise comparison are shown above diagonal.
Figure 5.
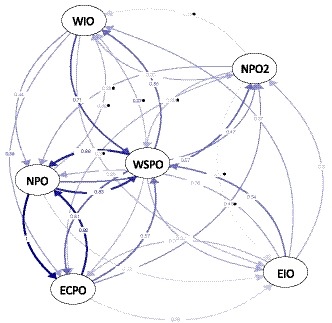
Bidirectional relative migration rates among striped marlin (Kajikia audax) populations calculated using a dataset where loci not conforming to Hardy–Weinberg equilibrium and selective neutrality were removed (n = 4,106 SNPs). Open circles represent populations and lines connecting circles are weighted according to relative migration rate. Relative migration rates with 95% confidence intervals larger than 0.00 are denoted with an asterisk. Values shown here were calculated with putative migrants included
3.5. Temporal stability of population structure
We assessed the multigenerational stability of allele frequencies within two geographically distant regions by comparing striped marlin sampled from the eastern central Pacific Ocean in 1992 and 2016, and from the western South Pacific Ocean in 1994 and 2010–2015, using the full dataset. PCoA of collections from the eastern central Pacific Ocean resolved a large cluster of fish comprising both sampling periods, except for three individuals positioned adjacent to this cluster (Figure 6a). These three samples comprised fish from both the 1992 and 2016 collections. Posterior probabilities of assignment resulting from DAPC for the two groups of striped marlin corresponding with each sampling period were similar across all individuals (Figure 6b). For temporally spaced collections from the western South Pacific Ocean, PCoA resolved a single cluster of striped marlin; however, DAPC performed for groups corresponding with each sampling period revealed two striped marlin with assignment probabilities distinct from other fish. These two individuals were sampled in 2012, but a third fish sampled in the same year displayed assignment probabilities consistent with striped marlin from all other years.
Figure 6.
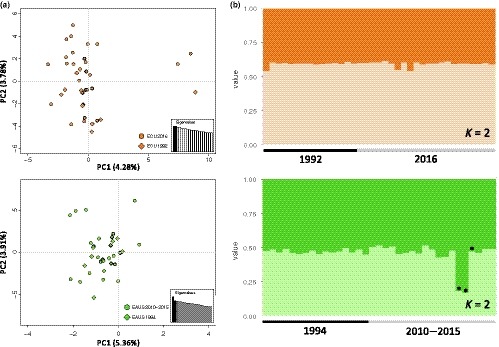
Results from principal coordinate analysis (PCoA; a) and discriminant analysis of principal components (DAPC; b) for temporal collections comprising striped marlin (Kajikia audax) sampled off Ecuador (top row; years 1992 and 2016) and eastern Australia (bottom row; years 1994 and 2010–2015). Analyses were performed using the full dataset (n = 4,206 SNPs). (a) Plot of PCoA axes one and two. Percentage of total variation explained by each axis is shown. Temporal collections are distinguished by plotting symbols (circles, diamonds). Insets show eigenvalues associated with the PCoA; black bars correspond with plotted axes. (b) Bar plots colored to show posterior probabilities of assignment to one of two clusters defined according to sampling period. Asterisks distinguish striped marlin sampled off eastern Australia in 2016 (n = 3)
Genetic differentiation calculated between temporally spaced collections using a dataset in which loci not conforming to the expectations of HWE and selective neutrality were removed resulted in F ST values that were low but statistically significant for both geographic regions (eastern central Pacific: F ST = 0.0029, p = .002; western South Pacific: F ST = 0.0042, p = .000). These levels of genetic differentiation are considerably lower than those observed for population‐level comparisons (F ST = 0.0137–0.0819), in several instances by a full order of magnitude. Additionally, multivariate analyses performed with all samples resolved temporally spaced collections as comprising single groups within the eastern central Pacific and western South Pacific oceans. Collectively, results from comparisons of temporal collections are consistent with the stability of allele frequencies for a minimum of three to five generations of striped marlin in the eastern central Pacific and western South Pacific oceans.
3.6. Population assignment
Overall assignment success was ≥90% (SE ± 2.29–4.55) when subsets of ≥200 SNPs were used to assign individuals to populations. Within populations, ≥90% assignment success was possible for ECPO (SE ± 1.40–2.60), WSPO (SE ± 0.00–1.80), and WIO (SE ± 0.00–6.12) across all SNP subsets (Figure 7). Population assignment success for EIO was consistently ≥90% only when larger subsets of loci were used (≥ 500 SNPs). In the North Pacific Ocean, assignment success was comparatively low, ranging from 82% to 87% (SE ± 2.20–4.02) for NPO and 60 to 80% (SE ± 10.00–18.71) for NPO2. Low assignment success and high standard errors for NPO2 may result from a comparatively high degree of genetic heterogeneity for this population (see results above). A larger sample size for NPO2 is necessary to improve assignment accuracy for this population.
Figure 7.
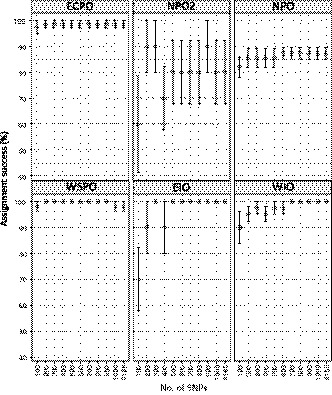
Average assignment accuracy of striped marlin (Kajikia audax) individuals to populations based on locus subsets comprising 100–1,000 SNPs. Results from tests performed using the full dataset (n = 4,165 SNPs) are also shown
4. DISCUSSION
The primary goal of this study was to resolve spatiotemporal patterns of genomic variation across the full range of a broadly distributed and highly migratory large pelagic species, providing practical information for species conservation and fisheries management, and advancing our understanding of genetic connectivity in pelagic environments. To accomplish this goal, we surveyed over 4,000 SNPs in striped marlin sampled across the Pacific and Indian oceans and analyzed resulting data to assess spatial population structure, the presence of genetic variation potentially influenced by natural selection, and the temporal stability of allele frequencies. Individual‐based cluster analyses resolved six genetically distinct populations of striped marlin corresponding with the western Indian, eastern Indian, western South Pacific, and eastern central Pacific oceans, as well as two populations in the North Pacific Ocean. Populations separated by comparatively large degrees of genetic differentiation were resolved using loci putatively under the influence of natural selection or using a subset of putatively neutral loci. Allele frequencies for temporal replicates from the western South Pacific and eastern central Pacific oceans were stable for periods of three to five generations of striped marlin. Collectively, these results demonstrate that species capable of long‐distance dispersal in environments lacking obvious physical barriers to movement can display substantial population subdivision that persists over multiple generations and is putatively facilitated by both neutral and adaptive processes. Our results also highlight substantial inconsistencies between genetically distinct populations of striped marlin and stock boundaries currently recognized by RFMOs.
4.1. Biological context of genetically distinct populations
This study represents the first assessment of spatial genetic variation for striped marlin in the Indian Ocean and provides evidence for genetically distinct populations in the western Indian and eastern Indian oceans. Seasonal movements and spawning behavior are poorly understood for striped marlin in the Indian Ocean, but tagging efforts in the western Indian Ocean reflect movements restricted to this region, with the exception of a fish recaptured off Western Australia (Roy Bealey, African Billfish Foundation, personal communication). Striped marlin larvae have been collected from both western and eastern regions of the Indian Ocean during seasons that at least partially overlap between regions (Bromhead, Pepperell, Wise, & Findlay, 2003; Jones & Kumaran, 1964; Nakamura, 1983; Nishikawa, Kikawa, Honma, & Ueyanagi, 1978; Pillai & Ueyanagi, 1978; Ueyanagi, 1974). Our results demonstrate low degrees of shared ancestry and high levels of genetic differentiation between the population of striped marlin in the western Indian Ocean and populations in the Pacific Ocean. In comparison, eastern Indian Ocean striped marlin exhibited a close genetic relationship with striped marlin in the western South Pacific Ocean; genetic differentiation between these regions was also lower than that between Indian Ocean populations. Relative migration rates reflect levels of gene flow from the Indian Ocean to the western South Pacific Ocean that are greater than those in the opposite direction, highlighting the role of the western South Pacific in facilitating genetic connectivity from Indian Ocean to Pacific Ocean populations of striped marlin. Possible mechanisms facilitating interoceanic gene flow include passive drift of eggs and larvae, and dispersal of adult fish. Pelagic larval duration is not known for striped marlin or other closely related species, but can strongly influence population‐level patterns of genetic connectivity in marine systems (Selkoe & Toonen, 2011). Movements of adult striped marlin between the Pacific and Indian oceans have not been reported, although tagging and reporting efforts have been limited in regions across the Indo‐Pacific. The temperate waters typically inhabited by striped marlin (20–25°C sea surface temperature; Howard & Ueyanagi, 1965; Sippel et al., 2007) and occurrence of seasonal assemblages in waters as far south as Tasmania (Bromhead et al., 2003) suggest interoceanic movements of striped marlin around the Australian continent may be possible in at least some years.
Our results clarify previously ambiguous population‐level relationships for striped marlin in the Pacific Ocean and are generally consistent with biological information available for this region. We confirm the presence of two genetically distinct populations of striped marlin in the North Pacific Ocean, one of which corresponds with a subset of fish sampled off Japan and Hawaii. The possibility of two biologically distinct assemblages of striped marlin in waters off Hawaii was initially proposed by Bromhead et al. (2003) based on a bimodal size distribution in catches reported from this region and high seasonal abundances of juvenile fish. A subsequent genetic study reported statistically significant genetic differentiation between reproductively immature and mature striped marlin off Hawaii (Purcell & Edmands, 2011); however, that result was based on microsatellite data corrected for null alleles, and comparisons with uncorrected data were not significant. Incomplete biological information for samples comprising NPO2 prohibits comparisons of demographic characteristics (e.g., size class) between the North Pacific Ocean populations resolved in this study. Spawning activity has been observed for two geographically distant regions of the North Pacific Ocean (Hyde, Humphreys, Musyl, Lynn, & Vetter, 2006; Sun et al., 2011) and for areas corresponding with additional populations of striped marlin in the Pacific Ocean (Eldridge & Wares, 1974; González‐Armas, Klett‐Traulsen, & Hernández‐Herrera, 2006; Kopf, Davie, Bromhead, & Young, 2012; Kume & Joseph, 1969). Regional movements of striped marlin generally correspond with the genetically distinct populations described here (Domeier, 2006; Holdsworth et al., 2009; Ortiz et al., 2003; Sippel et al., 2007). The putative migrants identified in genomic analyses represent movements between the western South Pacific Ocean and the North Pacific and eastern central Pacific oceans that have not been reported from tagging efforts, demonstrating the utility of genetic information in clarifying ocean‐wide migration patterns. Whether movements of these putative migrants are accompanied by gene flow is not known, but the presence of genetically distinct populations in these regions suggests that genetic connectivity between regions is low, and these fish likely represent vagrants exploiting geographically distant foraging grounds.
Surveys of genome‐wide variation in highly migratory large pelagic fishes with spatial distributions spanning the Pacific or Indian oceans are presently limited, but available studies report patterns of population subdivision similar to those observed here. Analyses of neutral and putatively adaptive markers identified from over 7,000 SNPs in the near‐threatened Galapagos shark (Carcharhinus galapagensis) revealed the presence of genetically distinct populations in the western Indian, western South Pacific, central North Pacific, eastern North Pacific, and eastern central Pacific oceans (Pazmiño et al., 2018). For sampling locations represented in both that and the present study, regions corresponding with genetically distinct populations were identical, except we resolved striped marlin sampled from waters off Central America and South America as belonging to the same population. Assessment of over 6,000 SNPs for yellowfin tuna in the Pacific Ocean resolved genetically distinct populations in the western South Pacific, central Pacific, and eastern North Pacific oceans (Grewe et al., 2015), demonstrating regional population structure similar to that observed in the present study. In contrast, analyses of over 1,500 SNPs in black marlin (Istiompax indica) identified a single population spanning eastern and western regions of the Indian Ocean; a second population spanning the western South Pacific, central North Pacific, and eastern central Pacific oceans; and a third population in the South China Sea (Williams, 2018). Identifying mechanisms underlying differences in ocean‐wide patterns of genetic connectivity among large pelagic fishes requires improved knowledge of species' biological characteristics (e.g., thermal preferences, dispersal capabilities, degree of fidelity to natal spawning grounds) and sensitivity to obvious or cryptic barriers to movement.
4.2. Biological significance of statistically significant comparisons
The populations of striped marlin resolved in this study were separated by levels of genetic differentiation that were also highly statistically significant. However, in some instances, comparatively low levels of genetic differentiation were also statistically significant. Low but statistically significant F ST values (F ST = 0.0018–0.0065, p = .001–.009) were observed for five comparisons between sample collections within a population. An additional statistically significant comparison was observed within NPO2 (F ST = 0.0182, p = .000), but in this case, the level of genetic differentiation was nearly three times higher than other statistically significant comparisons within populations. Low but statistically significant F ST values were also observed within temporal collections (eastern central Pacific: F ST = 0.0029, p = .002; western South Pacific: F ST = 0.0042, p = .000). Aside from the comparison within NPO2, F ST values associated with statistically significant comparisons within populations or temporal collections were less than half of those calculated between populations of striped marlin. This observation suggests that such low levels of genetic differentiation may not be biologically meaningful and may instead represent random sampling error due to the high level of statistical power associated with surveying a large number of genome‐wide molecular markers, but comparatively low power corresponding with relatively small sample sizes per sample collection.
Genetic differentiation between populations of marine fishes is expected to be lower than in freshwater and anadromous fishes (Ward, Woodwark, & Skibinski, 1994), presumably due to greater opportunities for dispersal in marine environments. Distinguishing biologically meaningful levels of genetic differentiation from stochastic noise is therefore challenging in marine fishes (Waples, 1998) and may be particularly so for species with enhanced dispersal capabilities, such as large pelagic fishes. Under these circumstances, determining whether a statistically significant test result is also of biological significance may be context‐dependent (Waples, 1998). Further exploration of the levels of genetic differentiation expected for varying experimental designs, species life histories, and genome‐wide markers (e.g., Alcala & Rosenberg, 2017; Jost et al., 2018) is necessary for assisting the interpretation of results from genomic studies of broadly distributed and highly migratory large pelagic fishes.
4.3. Relative contributions of neutral and adaptive processes to population structure
Population census sizes (Nc) for many marine fishes are very large relative to terrestrial or freshwater species and may also correspond with comparatively large effective population sizes (Ne; Laconcha et al., 2015; Waples, Grewe, Bravington, Hillary, & Feutry, 2018; but see Hauser & Carvalho, 2008; Palstra & Ruzzante, 2008). For marine populations with large Ne, accumulation of allele frequency differences between populations due to neutral processes may be slow and counteracted by individuals that stray and reproduce in non‐natal populations. This may be a greater possibility in marine fishes that are broadly distributed in pelagic environments and have high dispersal capabilities. It is therefore likely that additional mechanisms, such as those corresponding with regional selective pressures, contribute to the accumulation of genetic differences among populations of pelagic marine fishes (Hauser & Carvalho, 2008). In this study, we resolved striped marlin populations separated by comparatively high degrees of genetic differentiation using datasets limited to either SNPs putatively under the influence of natural selection or a subset of putatively neutral SNPs. These results indicate that both neutral and adaptive processes may be important in facilitating population subdivision in striped marlin. In comparison, Grewe et al. (2015) resolved Pacific Ocean populations of yellowfin tuna using SNPs putatively under the influence of natural selection (n = 215), but those populations were not apparent in analyses based on putatively neutral loci (n = 5,054). Further investigation is necessary to characterize mechanisms (e.g., Ne:Nc, demographic history, selection strength) underlying the relative capabilities of neutral genomic variation and variation influenced by natural selection to resolve populations of highly migratory large pelagic fishes. Such studies will ultimately inform our presently limited understanding of ecological and environmental variables, phenotypes, and loci involved in regional adaptive processes for large pelagic species.
4.4. Sampling designs for studies of large pelagic fishes
For many highly migratory large pelagic fishes of conservation concern, implementing biologically informed sampling designs that target seasonal aggregations across the species range within the same year is complicated by incomplete information on species life histories and limited opportunities to sample pelagic environments. Sampling efforts are further challenged by species that occur at relatively low frequencies. These difficulties typically result in experimental designs where species are opportunistically sampled across several years, producing sample collections that may be small, represent only a portion of the species range, or lack sizeable temporal replicates. The opportunistic sampling design implemented in this study facilitated genomic evaluation of striped marlin across the full species range; however, sample sizes for some populations (EIO and NPO2) are small and may contribute uncertainty to estimates of population‐level relationships (e.g., genetic diversity, migration rates, population assignment). Similarly, temporal replicates for striped marlin from some locations (EAUS and ECU) facilitated evaluation of the multigenerational stability of allele frequencies for populations in these regions (WSPO and ECPO). However, a lack of replicate collections for other regions prohibited exploration of temporal patterns for additional populations. Though these limitations reflect persistent challenges to implementing biologically representative sampling designs for large pelagic fishes, surveys of genome‐wide variation enable robust assessments of population‐level relationships using sample sizes that are more tractable than those required of traditional markers. Additionally, results from genomic surveys such as that implemented in this study can inform targeted spatiotemporal sampling efforts for future studies of large pelagic fishes.
4.5. Implications for species conservation and fisheries management
A prerequisite for sustainably managing wild populations is delineating management units that correspond with biologically distinct assemblages (Reiss, Hoarau, Dickey‐Collas, & Wolff, 2009) and should therefore represent a primary goal of fisheries management. Failure to recognize biologically distinct populations in management plans can result in decreased Ne and corresponding losses of genetic diversity (Allendorf, Berry, & Ryman, 2014; Allendorf, England, Luikart, Ritchie, & Ryman, 2008; Gaggiotti & Vetter, 1999; Pinsky & Palumbi, 2014), leading to reduced overall productivity of fish stocks and the depletion or loss of more vulnerable populations (e.g., those characterized by lower levels of recruitment). However, current management units for several actively managed marine fishes are primarily based on socioeconomic and political factors rather than species biology (Campana, 2016; Pons, Melnychuk, & Hilborn, 2018). Identifying strategies to balance pragmatic constraints on fisheries management with information derived from genetic and other scientific studies is increasingly important for promoting the long‐term sustainability of wild populations (Garner et al., 2016; Ovenden, Berry, Welch, Buckworth, & Dichmont, 2015; Waples, Punt, & Cope, 2008).
In the case of striped marlin, considerable mismatch exists between stocks recognized for fisheries management and what is known regarding the life history and spatial genetic structure of this species (Figure 8). In the Pacific Ocean, three management units corresponding with the western South Pacific, western and central North Pacific, and eastern Pacific oceans are currently recognized. Results from this study indicate that changes to the number and spatial extent of management units in the North Pacific Ocean are necessary, and are especially important given that striped marlin are considered overfished and experiencing unsustainable levels of fishing effort in this region (WCPFC, 2018). Additionally, fisheries in the central North Pacific and western North Pacific (at least in waters off Hawaii and Japan) may seasonally interact with more than one stock, and approaches that account for mixed‐stock fisheries (Crozier et al., 2004) are necessary in these regions. In the Indian Ocean, management units corresponding with the eastern Indian and western Indian oceans should be implemented and are critical given the excessive levels of fishing effort and heavily overfished status estimated for striped marlin in this region (IOTC, 2017). These efforts are also important given the comparatively low levels of genetic diversity observed for Indian Ocean populations in this study and the relative genetic isolation of the western Indian Ocean compared with other populations. Collectively, these changes will reduce mismatches between biologically distinct populations of striped marlin and stocks recognized for fisheries management, improving the effectiveness of management efforts for this commercially and recreationally important species. Implementation of such efforts may be assisted by genetic stock identification (e.g., Larson, Seeb, Pascal, Templin, & Seeb, 2014; McKinney, Seeb, & Seeb, 2017) using the informative subsets of SNPs identified through assignment analyses in this study.
Figure 8.
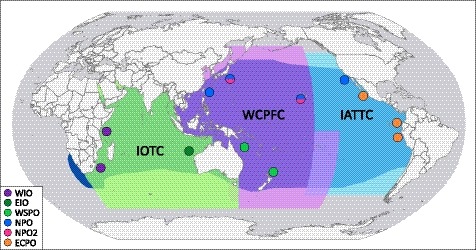
Genetically distinct populations of striped marlin (Kajikia audax) overlaid with spatial jurisdictions of regional fisheries management organizations for highly migratory large pelagic fishes (Indian Ocean Tuna Commission [IOTC], Western and Central Pacific Fisheries Commission [WCPFC], and Inter‐American Tropical Tuna Commission [IATTC]). Circles correspond with striped marlin sampling locations and are colored by population; circles composed of two colors represent regions utilized by two populations
Results from this and other similar studies equip resource managers to incorporate information on genomic variation into evolutionary‐based management plans for highly migratory large pelagic fishes. Preservation of both neutral and adaptive genomic variation is essential to maintaining the adaptive potential of populations and their ability to withstand fluctuations in ecological and environmental conditions (Funk, Forester, Converse, Darst, & Morey, 2018; Funk et al., 2012). Characterizing spatiotemporal patterns of genetic connectivity in pelagic species is also a necessary first step toward enabling spatially explicit investigations to identify drivers of genomic variation in pelagic systems. Such seascape genomic studies (Grummer et al., 2019; Selkoe et al., 2016) have lagged behind that in terrestrial systems, limiting our understanding of demogenetic and evolutionary processes dominating marine environments. Combined with continually improving geospatial resources, newly developed genomic resources will facilitate predictions of the impacts of future ecological and environmental conditions on population health and adaptive potential (Grummer et al., 2019). Information resulting from such studies will further enable evolutionary‐based management efforts that promote resilient populations of highly migratory large pelagic fishes.
4.6. Future directions and concluding remarks
This and other recent surveys of genome‐wide variation in highly migratory large pelagic fishes present some of the first genomic resources for these species, particularly for those found at comparatively lower frequencies or of lesser commercial value. Results from this study provide evidence for six genetically distinct populations of striped marlin in the Indo‐Pacific and are valuable for improving rangewide conservation and management efforts for this species. Additional work that employs fine‐scale spatiotemporal sampling is necessary for identifying regional stock boundaries and whether these boundaries are seasonally dynamic. Such efforts will also help determine the contributions of distinct stocks to mixed‐stock fisheries. Studies that implement tagging technology capable of monitoring detailed movements over periods longer than 1 year are presently lacking, but necessary for elucidating seasonal movement patterns within and between ocean basins, and for determining the degree to which populations of striped marlin display spawning site fidelity. Equivalent genomic and tagging efforts across large pelagic fishes will provide valuable insights into broad‐scale patterns of connectivity within and between ocean basins, and ecological and evolutionary factors influencing genetic connectivity in pelagic communities (Hand, Lowe, Kovach, Muhlfeld, & Luikart, 2015; Raeymaekers et al., 2017). The genomics era represents an important opportunity to provide novel information that improves management and conservation initiatives for wild populations (Meek & Larson, 2019), including those of large pelagic fishes, promoting the sustainable use of these ecologically and economically valuable resources.
CONFLICT OF INTEREST
None declared.
Supporting information
ACKNOWLEDGEMENTS
We thank several recreational anglers across the Indo‐Pacific for providing tissue samples for this study, especially Trevor Hansen, Morgan O'Kennedy, and Johan Smal. We also thank multiple scientists and conservation groups for facilitating sample collection, including Sofía Ortega‐García, Wei‐Chuan Chiang, Jérôme Bourjea, Evgeny Romanov, Catherine Purcell, Sam Williams, John Holdsworth, The Museum of New Zealand, and the NOAA Pacific Islands Fisheries Science Center longline fishery observer program. In particular, efforts from the African Billfish Foundation (Roy Bealey), International Game Fish Association (Rob Kramer, Jason Schratweiser, and several international representatives), and Japan Game Fish Association (Tomonori Higashi) were essential to the success of this project. We are grateful to three anonymous reviewers for their comments on this manuscript. This study was supported by a research grant from the National Marine Fisheries Service (NA17NMF4720328) awarded to JEG and JRM. Funding was also provided by the Gottwald Marine Science Endowment. NRM was supported by a Virginia Sea Grant Graduate Research Fellowship. This paper is Contribution No. 3848 of the Virginia Institute of Marine Science, William & Mary.
Mamoozadeh NR, Graves JE, McDowell JR. Genome‐wide SNPs resolve spatiotemporal patterns of connectivity within striped marlin (Kajikia audax), a broadly distributed and highly migratory pelagic species. Evol Appl. 2020;13:678–699. 10.1111/eva.12892
DATA AVAILABILITY STATEMENT
Data available from the Dryad Digital Repository: https://doi.org/10.5061/dryad.3j9kd51cp (Mamoozadeh, Graves, & McDowell, 2019).
REFERENCES
- Adamack, A. , & Gruber, B. (2014). PopGenReport: Simplifying basic population genetic analyses in R. Methods in Ecology and Evolution, 5, 384–387. 10.1111/2041-210X.12158 [DOI] [Google Scholar]
- Alcala, N. , Goudet, J. , & Vuilleumier, S. (2014). On the transition of genetic differentiation from isolation to panmixia: What we can learn from GST and D. Theoretical Population Biology, 93, 75–84. 10.1016/j.tpb.2014.02.003 [DOI] [PubMed] [Google Scholar]
- Alcala, N. , & Rosenberg, N. (2017). Mathematical constraints on Fst: Biallelic markers in arbitrarily many populations. Genetics, 206, 1581–1600. 10.1534/genetics.116.199141 [DOI] [PMC free article] [PubMed] [Google Scholar]
- Allendorf, F. , Berry, O. , & Ryman, N. (2014). So long to genetic diversity, and thanks for all the fish. Molecular Ecology, 23, 23–25. 10.1111/mec.12574 [DOI] [PubMed] [Google Scholar]
- Allendorf, F. , England, P. , Luikart, G. , Ritchie, P. , & Ryman, N. (2008). Genetic effects of harvest on wild animal populations. Trends in Ecology and Evolution, 23, 327–337. 10.1016/j.tree.2008.02.008 [DOI] [PubMed] [Google Scholar]
- Anderson, E. (2010). Assessing the power of informative subsets of loci for population assignment: Standard methods are upwardly biased. Molecular Ecology Resources, 10, 701–710. 10.1111/j.1755-0998.2010.02846.x [DOI] [PubMed] [Google Scholar]
- Andrews, K. , Good, J. , Miller, M. , Luikart, G. , & Hohenlohe, P. (2016). Harnessing the power of RADseq for ecological and evolutionary genomics. Nature Reviews Genetics, 17, 81–92. 10.1038/nrg.2015.28 [DOI] [PMC free article] [PubMed] [Google Scholar]
- Appleyard, A. , Grewe, M. , Innes, H. , & Ward, D. (2001). Population structure of yellowfin tuna (Thunnus albacares) in the western Pacific Ocean, inferred from microsatellite loci. Marine Biology, 139, 383–393. 10.1007/s002270100578 [DOI] [Google Scholar]
- Ayllon, F. , Kjærner‐Semb, E. , Furmanek, T. , Wennevik, V. , Solberg, M. F. , Dahle, G. , … Wargelius, A. (2015). The vgll3 locus controls age at maturity in wild and domesticated Atlantic Salmon (Salmo salar L.) Males. PLoS Genetics, 11, 1–15. 10.1371/journal.pgen.1005628 [DOI] [PMC free article] [PubMed] [Google Scholar]
- Baird, N. A. , Etter, P. D. , Atwood, T. S. , Currey, M. C. , Shiver, A. L. , Lewis, Z. A. , … Johnson, E. A. (2008). Rapid SNP discovery and genetic mapping using sequenced RAD markers. PLoS ONE, 3, e3376 10.1371/journal.pone.0003376 [DOI] [PMC free article] [PubMed] [Google Scholar]
- Barson, N. J. , Aykanat, T. , Hindar, K. , Baranski, M. , Bolstad, G. H. , Fiske, P. , … Primmer, C. R. (2015). Sex‐dependent dominance at a single locus maintains variation in age at maturity in salmon. Nature, 528, 405–408. 10.1038/nature16062 [DOI] [PubMed] [Google Scholar]
- Barth, J. , Damerau, M. , Matschiner, M. , Jentoft, S. , & Hanel, R. (2017). Genomic differentiation and demographic histories of Atlantic and Indo‐Pacific yellowfin tuna (Thunnus albacares) Populations. Genome Biology and Evolution, 9, 1084–1098. 10.1093/gbe/evx067 [DOI] [PMC free article] [PubMed] [Google Scholar]
- Beaumont, M. , & Balding, D. (2004). Identifying adaptive genetic divergence among populations from genome scans. Molecular Ecology, 13, 969–980. 10.1111/j.1365-294X.2004.02125.x [DOI] [PubMed] [Google Scholar]
- Beaumont, M. , & Nichols, R. (1996). Evaluating loci for use in the genetic analysis of population structure. Proceedings of the Royal Society of London B, 263, 1619–1626. [Google Scholar]
- Beerli, P. , & Palczewski, M. (2010). Unified framework to evaluate panmixia and migration direction among multiple sampling locations. Genetics, 185, 313–326. 10.1534/genetics.109.112532 [DOI] [PMC free article] [PubMed] [Google Scholar]
- Benjamini, Y. , & Yekutieli, D. (2001). The control of the false discovery rate in multiple testing under dependency. Annals of Statistics, 29, 1165–1188. 10.1214/aos/1013699998 [DOI] [Google Scholar]
- Bradbury, I. , Hubert, S. , Higgins, B. , Bowman, S. , Paterson, I. , Snelgrove, P. , … Bentzen, P. (2011). Evaluating SNP ascertainment bias and its impact on population assignment in Atlantic cod, Gadus morhua . Molecular Ecology Resources, 11, 218–225. 10.1111/j.1755-0998.2010.02949.x [DOI] [PubMed] [Google Scholar]
- Bromhead, D. , Pepperell, J. , Wise, B. , & Findlay, J. (2003). Striped marlin: Biology and fisheries. Canberra, Australia: Bureau of Rural Sciences. [Google Scholar]
- Campana, S. (2016). Transboundary movements, unmonitored fishing mortality, and ineffective international fisheries management pose risks for pelagic sharks in the Northwest. Atlantic, 73, 1599–1607. 10.1139/cjfas-2015-0502 [DOI] [Google Scholar]
- Carlisle, A. , Kochevar, R. , Arostegui, M. , Ganong, J. , Castleton, M. , Schratwieser, J. , & Block, B. (2017). Influence of temperature and oxygen on the distribution of blue marlin (Makaira nigricans) in the Central Pacific. Fisheries Oceanography, 26, 34–48. 10.1111/fog.12183 [DOI] [Google Scholar]
- Collette, B. B. , Carpenter, K. E. , Polidoro, B. A. , Juan‐Jordá, M. J. , Boustany, A. , Die, D. J. , … Yáñez, E. (2011). High value and long life—Double jeopardy for tunas and billfishes. Science, 333, 291–292. 10.1126/science.1208730 [DOI] [PubMed] [Google Scholar]
- Crowder, L. , & Norse, E. (2008). Essential ecological insights for marine ecosystem‐based management and marine spatial planning. Marine Policy, 32, 772–778. 10.1016/j.marpol.2008.03.012 [DOI] [Google Scholar]
- Crozier, W. , Schön, P. , Chaput, G. , Potter, E. , Maoiléidigh, N. Ó. , & MacLean, J. C. (2004). Managing Atlantic salmon (Salmo salar L.) in the mixed stock environment: Challenges and considerations. ICES Journal of Marine Science, 61, 1344–1358. 10.1016/j.icesjms.2004.08.013 [DOI] [Google Scholar]
- Cullis‐Suzuki, S. , & Pauly, D. (2010). Failing the high seas: A global evaluation of regional fisheries management organizations. Marine Policy, 34, 1036–1042. 10.1016/j.marpol.2010.03.002 [DOI] [Google Scholar]
- Dammannagoda, S. , Hurwood, D. , & Mather, P. (2008). Evidence for fine geographical scale heterogeneity in gene frequencies in yellowfin tuna (Thunnus albacares) from the north Indian Ocean around Sri Lanka. Fisheries Research, 90, 147–157. 10.1016/j.fishres.2007.10.006 [DOI] [Google Scholar]
- Dell'Apa, A. , Carney, K. , Davenport, T. , & Vernon, M. (2018). Potential medium‐term impacts of climate change on tuna and billfish in the Gulf of Mexico: A qualitative framework for management and conservation. Marine Environmental Research, 141, 1–11. 10.1016/j.marenvres.2018.07.017 [DOI] [PubMed] [Google Scholar]
- Díaz‐Jaimes, P. , & Uribe‐Alcocer, M. (2003). Allozyme and RAPD variation in the eastern Pacific yellowfin tuna (Thunnus albacares). Fishery Bulletin, 101, 769–777. [Google Scholar]
- Díaz‐Jaimes, P. , & Uribe‐Alcocer, M. (2006). Spatial differentiation in the eastern Pacific yellowfin tuna revealed by microsatellite variation. Fisheries Science, 72, 590–596. 10.1111/j.1444-2906.2006.01188.x [DOI] [Google Scholar]
- Domeier, M. (2006). An analysis of Pacific striped marlin (Tetrapturus audax) horizontal movement patterns using pop‐up satellite archival tags. Bulletin of Marine Science, 79, 811–825. [Google Scholar]
- Duery, S. , Bopp, L. , & Maury, O. (2014). Projecting the impacts of climate change on skipjack tuna abundance and spatial distribution. Global Change Biology, 20(3), 742–753. 10.1111/gcb.12460 [DOI] [PubMed] [Google Scholar]
- Earl, D. , & VonHoldt, B. (2012). STRUCTURE HARVESTER: A website and program for visualizing STRUCTURE output and implementing the Evanno method. Conservation Genetics Resources, 4, 359–361. 10.1007/s12686-011-9548-7 [DOI] [Google Scholar]
- Eldridge, M. , & Wares, P. (1974). Some biological observations of billfishes taken in the eastern Pacific Ocean, 1967–1970 In Shomura R., & Williams F. (Eds.), Proceedings of the international billfish symposium Kailua‐Kona, Hawaii, 9–12 August 1972. Part 2. Review and contributed papers (pp. 89–101). [Google Scholar]
- Elshire, R. , Glaubitz, J. , Sun, Q. , Poland, J. , Kawamoto, K. , Buckler, E. , & Mitchell, S. (2011). A robust, simple genotyping‐by‐sequencing (GBS) approach for high diversity species. PLoS ONE, 6, e19379 10.1371/journal.pone.0019379 [DOI] [PMC free article] [PubMed] [Google Scholar]
- Ely, B. , Viñas, J. , Alvarado Bremer, J. , Black, D. , Lucas, L. , Covello, K. , … Thelen, E. (2005). Consequences of the historical demography on the global population structure of two highly migratory cosmopolitan marine fishes: The yellowfin tuna (Thunnus albacares) and the skipjack tuna (Katsuwonus pelamis). BMC Evolutionary Biology, 5, 1–9. 10.1186/1471-2148-5-19 [DOI] [PMC free article] [PubMed] [Google Scholar]
- Evanno, G. , Regnaut, S. , & Goudet, J. (2005). Detecting the number of clusters of individuals using the software STRUCTURE: A simulation study. Molecular Ecology, 14, 2611–2620. 10.1111/j.1365-294X.2005.02553.x [DOI] [PubMed] [Google Scholar]
- Excoffier, L. , Hofer, T. , & Foll, M. (2009). Detecting loci under selection in a hierarchically structured population. Heredity, 103, 285–298. 10.1038/hdy.2009.74 [DOI] [PubMed] [Google Scholar]
- Excoffier, L. , & Lischer, H. (2010). Arlequin suite ver 3.5: A new series of programs to perform population genetics analyses under Linux and Windows. Molecular Ecology Resources, 10, 564–567. 10.1111/j.1755-0998.2010.02847.x [DOI] [PubMed] [Google Scholar]
- Falush, D. , Stephens, M. , & Pritchard, J. (2003). Inference of population structure using multilocus genotype data: Linked loci and correlated allele frequencies. Genetics, 164, 1567–1587. [DOI] [PMC free article] [PubMed] [Google Scholar]
- Foll, M. , & Gaggiotti, O. (2008). A genome‐scan method to identify selected loci appropriate for both dominant and codominant markers: A Bayesian perspective. Genetics, 180, 977–993. 10.1534/genetics.108.092221 [DOI] [PMC free article] [PubMed] [Google Scholar]
- Frankel, O. H. (1974). Genetic conservation: Our evolutionary responsibility. Genetics, 78, 53–65. [DOI] [PMC free article] [PubMed] [Google Scholar]
- Frankham, R. (2010). Challenges and opportunities of genetic approaches to biological conservation. Biological Conservation, 143, 1919–1927. 10.1016/j.biocon.2010.05.011 [DOI] [Google Scholar]
- Franklin, I. (1980). Evolutionary change in small populations In Soulé M., & Wilcox B. A. (Eds.), Conservation biology – An evolutionary‐ecological perspective (pp. 135–149). Sunderland, MA: Sinauer Associates. [Google Scholar]
- Funk, W. , Forester, B. , Converse, S. , Darst, C. , & Morey, S. (2018). Improving conservation policy with genomics: A guide to integrating adaptive potential into U.S. Endangered Species Act decisions for conservation practitioners and geneticists. Conservation Genetics, 20, 115–134. 10.1007/s10592-018-1096-1 [DOI] [Google Scholar]
- Funk, W. , McKay, J. , Hohenlohe, P. , & Allendorf, F. (2012). Harnessing genomics for delineating conservation units. Trends in Ecology & Evolution, 27, 489–496. 10.1016/j.tree.2012.05.012 [DOI] [PMC free article] [PubMed] [Google Scholar]
- Gaggiotti, O. , & Vetter, R. (1999). Effect of life history strategy, environmental variability, and overexploitation on the genetic diversity of pelagic fish populations. Canadian Journal of Fisheries & Aquatic Sciences, 56, 1376–1388. 10.1139/f99-060 [DOI] [Google Scholar]
- Garner, B. A. , Hand, B. K. , Amish, S. J. , Bernatchez, L. , Foster, J. T. , Miller, K. M. , … Luikart, G. (2016). Genomics in conservation: Case studies and bridging the gap between data and application. Trends in Ecology & Evolution, 31, 81–83. 10.1016/j.tree.2015.10.009 [DOI] [PubMed] [Google Scholar]
- González‐Armas, R. , Klett‐Traulsen, A. , & Hernández‐Herrera, A. (2006). Evidence of billfish reproduction in the southern Gulf of California, Mexico. Bulletin of Marine Science, 79, 705–717. [Google Scholar]
- Gosselin, T. , Benestan, L. , & Bernatchez, L. (2015). assigner: Assignment analysis with GBS/RAD data using R. R package version 0.1.4. Retrieved from https://github.com/thierrygosselin/assigner. 10.5281/zenodo.46723. [DOI] [Google Scholar]
- Grewe, P. M. , Feutry, P. , Hill, P. L. , Gunasekera, R. M. , Schaefer, K. M. , Itano, D. G. , … Davies, C. R. (2015). Evidence of discrete yellowfin tuna (Thunnus albacares) populations demands rethink of management for this globally important resource. Scientific Reports, 5, 16916 10.1038/srep16916 [DOI] [PMC free article] [PubMed] [Google Scholar]
- Gruber, B. , Unmack, P. , Berry, O. , & Georges, A. (2018). dartR: An R package to facilitate analysis of SNP data generated from reduced representation genome sequencing. Molecular Ecology Resources, 18, 1–9. 10.1111/1755-0998.12745 [DOI] [PubMed] [Google Scholar]
- Grummer, J. , Beheregaray, L. , Bernatchez, L. , Hand, B. , Luikart, G. , Narum, S. , & Taylor, E. (2019). Aquatic landscape genomics and environmental effects on genetic variation. Trends in Ecology & Evolution, 34, 1–14. 10.1016/j.tree.2019.02.013 [DOI] [PubMed] [Google Scholar]
- Hand, B. , Lowe, W. , Kovach, R. , Muhlfeld, C. , & Luikart, G. (2015). Landscape community genomics: Understanding eco‐evolutionary processes in complex environments. Trends in Ecology and Evolution, 30, 161–168. 10.1016/j.tree.2015.01.005 [DOI] [PubMed] [Google Scholar]
- Hauser, L. , & Carvalho, G. (2008). Paradigm shifts in marine fisheries genetics: Ugly hypotheses slain by beautiful facts. Fish and Fisheries, 9, 333–362. 10.1111/j.1467-2979.2008.00299.x [DOI] [Google Scholar]
- Hazen, E. L. , Jorgensen, S. , Rykaczewski, R. R. , Bograd, S. J. , Foley, D. G. , Jonsen, I. D. , … Block, B. A. (2012). Predicted habitat shifts of Pacific top predators in a changing climate. Nature Climate Change, 3, 234–238. 10.1038/NCLIMATE1686 [DOI] [Google Scholar]
- Helyar, S. J. , Hemmer‐hansen, J. , Bekkevold, D. , Taylor, M. I. , Ogden, R. , Limborg, M. T. , … Nielsen, E. E. (2011). Application of SNPs for population genetics of nonmodel organisms: New opportunities and challenges. Molecular Ecology Resources, 11(Suppl. 1), 123–136. 10.1111/j.1755-0998.2010.02943.x [DOI] [PubMed] [Google Scholar]
- Hey, J. (2010). Isolation with migration models for more than two populations. Molecular Biology and Evolution, 27, 905–920. 10.1093/molbev/msp296 [DOI] [PMC free article] [PubMed] [Google Scholar]
- Holdsworth, J. , Sippel, T. , & Block, B. (2009). Near real time satellite tracking of striped marlin (Kajikia audax) movements in the Pacific Ocean. Marine Biology, 156, 505–514. 10.1007/s00227-008-1104-y [DOI] [Google Scholar]
- Howard, J. , & Ueyanagi, S. (1965). Distribution and relative abundance of billfishes (Istiophoridae) of the Pacific Ocean. Studies in Tropical Oceanography, 2, 1–134. [Google Scholar]
- Howe, R. , Davis, J. , & Mosca, V. (1991). The demographic significance of “sink” populations. Biological Conservation, 57, 239–255. 10.1016/0006-3207(91)90071-G [DOI] [Google Scholar]
- Hubisz, M. , Falush, D. , Stephens, M. , & Pritchard, J. (2009). Inferring weak population structure with the assistance of sample group information. Molecular Ecology Resources, 9, 1322–1332. 10.1111/j.1755-0998.2009.02591.x [DOI] [PMC free article] [PubMed] [Google Scholar]
- Hyde, J. , Humphreys, R. , Musyl, M. , Lynn, E. , & Vetter, R. (2006). A central North Pacific spawning ground for striped marlin, Tetrapturus audax . Bulletin of Marine Science, 79, 683–690. [Google Scholar]
- IATTC (2018). Status of the tuna and billfish stocks in 2017 (Stock Assessment Report 19). La Jolla, CA: Inter‐American Tropical Tuna Commission. [Google Scholar]
- IOTC (2017). Report of the 15th session of the IOTC working party on billfish. Victoria, Seychelles: Indian Ocean Tuna Commission. [Google Scholar]
- Jakobsson, M. , & Rosenberg, N. A. (2007). CLUMPP: A cluster matching and permutation program for dealing with label switching and multimodality in analysis of population structure. Bioinformatics, 23, 1801–1806. 10.1093/bioinformatics/btm233 [DOI] [PubMed] [Google Scholar]
- Janes, J. , Malenfant, M. , Andrew, R. , Miller, J. , Dupuis, J. , Gorrell, J. , & Cullingham, C. (2017). The K = 2 conundrum. Molecular Ecology, 26, 3594–3602. 10.1111/mec.14187 [DOI] [PubMed] [Google Scholar]
- Jombart, T. (2008). Adegenet: A R package for the multivariate analysis of genetic markers. Bioinformatics, 24, 1403–1405. 10.1093/bioinformatics/btn129 [DOI] [PubMed] [Google Scholar]
- Jombart, T. , Devillard, S. , & Balloux, F. (2010). Discriminant analysis of principal components: A new method for the analysis of genetically structured populations. BMC Genetics, 11, 94 10.1186/1471-2156-11-94 [DOI] [PMC free article] [PubMed] [Google Scholar]
- Jombart, T. , Pontier, D. , & Dufour, A.‐B. (2009). Genetic markers in the playground of multivariate analysis. Heredity, 102, 330–341. 10.1038/hdy.2008.130 [DOI] [PubMed] [Google Scholar]
- Jones, S. , & Kumaran, M. (1964). Distribution of larval billfishes (Xiphiidae and Istiophoridae) in the Indo‐Pacific with special reference to the collections made by the Danish Dana Expedition In Proceedings of the symposium on scombroid fishes, Part 1. Mandapam, India, 1962. Cochin, India: Marine Biological Association of India. [Google Scholar]
- Jost, L. (2008). GST and its relatives do not measure differentiation. Molecular Ecology, 17, 4015–4026. 10.1111/j.1365-294X.2008.03887.x [DOI] [PubMed] [Google Scholar]
- Jost, L. , Archer, F. , Flanagan, S. , Gaggiotti, O. , Hoban, S. , & Latch, E. (2018). Differentiation measures for conservation genetics. Evolutionary Applications, 11, 1139–1148. 10.1111/eva.12590 [DOI] [PMC free article] [PubMed] [Google Scholar]
- Kamvar, Z. , Tabima, J. , & Grünwald, N. (2014). Poppr: An R package for genetic analysis of populations with clonal, partially clonal, and/or sexual reproduction. PeerJ, e281, 1–15. 10.7717/peerj.281 [DOI] [PMC free article] [PubMed] [Google Scholar]
- Keenan, K. , Mcginnity, P. , Cross, T. , Crozier, W. , & Prodöhl, P. (2013). DiveRsity: An R package for the estimation and exploration of population genetics parameters and their associated errors. Methods in Ecology and Evolution, 4, 782–788. 10.1111/2041-210X.12067 [DOI] [Google Scholar]
- Kilian, A. , Wenzl, P. , Huttner, E. , Carling, J. , Xia, L. , Caig, V. , … Uszynski, G. (2012). Diversity arrays technology: A generic genome profiling technology on open platforms In Pompanon F., & Bonin A. (Eds.), Data production and analysis in population genomics: Methods and protocols (Vol. 888, pp. 67–89). New York, NY: Humana Press; 10.1007/978-1-61779-870-2 [DOI] [PubMed] [Google Scholar]
- Kopf, R. , Davie, P. , Bromhead, D. , & Young, J. (2012). Reproductive biology and spatiotemporal patterns of spawning in striped marlin Kajikia audax . Journal of Fish Biology, 81, 1834–1858. [DOI] [PubMed] [Google Scholar]
- Kume, S. , & Joseph, J. (1969). Size composition and sexual maturity of billfish caught by the Japanese longline fishery in the Pacific Ocean east of 130W. Bulletin of the Far Seas Fisheries Research Laboratory, 2, 115–162. [Google Scholar]
- Laconcha, U. , Iriondo, M. , Arrizabalaga, H. , Manzano, C. , Markaide, P. , Montes, I. , … Estonba, A. (2015). New nuclear SNP markers unravel the genetic structure and effective population size of albacore tuna (Thunnus alalunga). PLoS ONE, 10, e0128247 10.1371/journal.pone.0128247 [DOI] [PMC free article] [PubMed] [Google Scholar]
- Larson, W. , Seeb, J. , Pascal, C. , Templin, W. , & Seeb, L. (2014). SNPs identified through genotyping‐by‐sequencing improve genetic stock identification of Chinook salmon (Oncorhynchus tshawytscha) from western Alaska. Canadian Journal of Fisheries and Aquatic Sciences, 71, 1–11. 10.1139/cjfas-2013-0502 [DOI] [Google Scholar]
- Lotterhos, K. , & Whitlock, M. (2014). Evaluation of demographic history and neutral parameterization on the performance of FST outlier tests. Molecular Ecology, 23, 2178–2192. 10.1111/mec.12725 [DOI] [PMC free article] [PubMed] [Google Scholar]
- Luikart, G. , England, P. , Tallmon, D. , Jordan, S. , & Taberlet, P. (2003). The power and promise of population genomics: From genotyping to genome typing. Nature Reviews Genetics, 4, 981–994. 10.1038/nrg1226 [DOI] [PubMed] [Google Scholar]
- Mamoozadeh, N. , Graves, J. , & McDowell, J. (2019). Genome‐wide SNPs resolve spatiotemporal patterns of connectivity within striped marlin (Kajikia audax), a broadly distributed and highly migratory pelagic species Dryad Digital Repository, 10.5061/dryad.3j9kd51cp [DOI] [PMC free article] [PubMed]
- Mardis, E. (2008). Next‐generation DNA sequencing methods. Annual Review of Genomics and Human Genetics, 9, 387–402. 10.1146/annurev.genom.9.081307.164359 [DOI] [PubMed] [Google Scholar]
- McDowell, J. , & Graves, J. (2008). Population structure of striped marlin (Kajikia audax) in the Pacific Ocean based on analysis of microsatellite and mitochondrial DNA. Canadian Journal of Fisheries and Aquatic Sciences, 65, 1307–1320. 10.1139/F08-054 [DOI] [Google Scholar]
- McKinney, G. , Seeb, J. , & Seeb, L. (2017). Managing mixed‐stock fisheries: Genotyping multi‐SNP haplotypes increases power for genetic stock identification. Canadian Journal of Fisheries and Aquatic Sciences, 74, 429–434. 10.1139/cjfas-2016-0443 [DOI] [Google Scholar]
- Meek, M. , & Larson, W. (2019). The future is now: Amplicon sequencing and sequence capture usher in the conservation genomics era. Molecular Ecology Resources, 19, 795–803. 10.1111/1755-0998.12998 [DOI] [PubMed] [Google Scholar]
- Meltzer, E. (1994). Global overview of straddling and highly migratory fish stocks: The nonsustainable nature of high seas fisheries. Ocean Development and International Law, 25, 255–344. 10.1080/00908329409546036 [DOI] [Google Scholar]
- Mislan, K. , Deutsch, C. , Brill, R. , Dunne, J. , & Sarmiento, J. (2017). Projections of climate‐driven changes in tuna vertical habitat based on species‐specific differences in blood oxygen affinity. Global Change Biology, 23, 4019–4028. 10.1111/gcb.13799 [DOI] [PubMed] [Google Scholar]
- Muhling, B. , Lee, S. , Lamkin, J. , & Liu, Y. (2011). Predicting the effects of climate change on bluefin tuna (Thunnus thynnus) spawning habitat in the Gulf of Mexico. ICES Journal of Marine Science, 68, 1051–1062. 10.1093/icesjms/fsr008 [DOI] [Google Scholar]
- Mullins, R. , McKeown, N. , Sauer, W. , & Shaw, P. (2018). Genomic analysis reveals multiple mismatches between biological and management units in yellowfin tuna (Thunnus albacares). ICES Journal of Marine Science, 75, 2145–2152. 10.1093/icesjms/fsy102 [DOI] [Google Scholar]
- Nakamura, I. (1983). Systematics of billfishes (Xiphiidae and Istiophoridae). Publications of the Seto Marine Biological Laboratory, 28, 255–396. [Google Scholar]
- Nakamura, I. (1985). FAO species catalogue. Vol. 5. Billfishes of the world. Rome, Italy: Food and Agriculture Organization of the United Nations. [Google Scholar]
- Narum, S. (2006). Beyond Bonferroni: Less conservative analyses for conservation genetics. Conservation Genetics, 7, 783–787. 10.1007/s10592-005-9056-y [DOI] [Google Scholar]
- Narum, S. , & Hess, J. (2011). Comparison of FST outlier tests for SNP loci under selection. Molecular Ecology Resources, 11(Suppl. 1), 184–194. 10.1111/j.1755-0998.2011.02987.x [DOI] [PubMed] [Google Scholar]
- Nei, M. (1973). Analysis of gene diversity in subdivided populations. Proceedings of the National Academy of Sciences of the United States of America, 70, 3321–3323. 10.1073/pnas.70.12.3321 [DOI] [PMC free article] [PubMed] [Google Scholar]
- Nielsen, E. , Hemmer‐Hansen, J. , Larsen, P. , & Bekkevold, D. (2009). Population genomics of marine fishes: Identifying adaptive variation in space and time. Molecular Ecology, 18, 3128–3150. 10.1111/j.1365-294X.2009.04272.x [DOI] [PubMed] [Google Scholar]
- Nishikawa, Y. , Kikawa, S. , Honma, M. , & Ueyanagi, S. (1978). Distribution atlas of larval tunas, billfishes and related species. Results of larval surveys by R/V Shunyo Maru, and Shoyo Maru, 1956–1975. Bulletin of the Far Seas Fisheries Research Laboratory, 9, 1–99. [Google Scholar]
- Ortiz, M. , Prince, E. D. , Serafy, J. E. , Holts, D. B. , Davy, K. B. , Pepperell, J. G. , … Holdsworth, J. C. (2003). Global overview of the major constituent‐based billfish tagging programs and their results since 1954. Marine and Freshwater Research, 54, 489–507. 10.1071/MF02028 [DOI] [Google Scholar]
- Ovenden, J. , Berry, O. , Welch, D. , Buckworth, R. , & Dichmont, C. (2015). Ocean's eleven: A critical evaluation of the role of population, evolutionary and molecular genetics in the management of wild fisheries. Fish and Fisheries, 16, 125–159. 10.1111/faf.12052 [DOI] [Google Scholar]
- Palsbøll, P. , Bérubé, M. , & Allendorf, F. (2006). Identification of management units using population genetic data. Trends in Ecology and Evolution, 22, 11–16. 10.1016/j.tree.2006.09.003 [DOI] [PubMed] [Google Scholar]
- Palstra, F. , & Ruzzante, D. (2008). Genetic estimates of contemporary effective population size: What can they tell us about the importance of genetic stochasticity for wild population persistence? Molecular Ecology, 17, 3428–3447. 10.1111/j.1365-294X.2008.03842.x [DOI] [PubMed] [Google Scholar]
- Pazmiño, D. A. , Maes, G. E. , Green, M. E. , Simpfendorfer, C. A. , Hoyos‐Padilla, E. M. , Duffy, C. J. A. , … van Herwerden, L. (2018). Strong trans‐Pacific break and local conservation units in the Galapagos shark (Carcharhinus galapagensis) revealed by genome‐wide cytonuclear markers. Heredity, 120, 407–421. 10.1038/s41437-017-0025-2 [DOI] [PMC free article] [PubMed] [Google Scholar]
- Pecoraro, C. , Babbucci, M. , Villamor, A. , Franch, R. , Papetti, C. , Leroy, B. , … Cariani, A. (2016). Methodological assessment of 2b‐RAD genotyping technique for population structure inferences in yellowfin tuna (Thunnus albacares). Marine Genomics, 25, 43–48. 10.1016/j.margen.2015.12.002 [DOI] [PubMed] [Google Scholar]
- Pentz, B. , Klenk, N. , Ogle, S. , & Fisher, J. (2018). Can regional fisheries management organizations (RFMOs) manage resources effectively during climate change? Marine Policy, 92, 13–20. 10.1016/j.marpol.2018.01.011 [DOI] [Google Scholar]
- Peterson, B. , Weber, J. , Kay, E. , Fisher, H. , & Hoekstra, H. (2012). Double digest RADseq: An inexpensive method for de novo SNP discovery and genotyping in model and non‐model species. PLoS ONE, 7, e37135 10.1371/journal.pone.0037135 [DOI] [PMC free article] [PubMed] [Google Scholar]
- Pillai, P. , & Ueyanagi, S. (1978). Distribution and biology of the striped marlin, Tetrapturus audax (Philippi) taken by the longline fishery in the Indian Ocean. Bulletin of the Far Seas Fisheries Research Laboratory, 16, 9–32. [Google Scholar]
- Pinsky, M. , & Palumbi, S. (2014). Meta‐analysis reveals lower genetic diversity in overfished populations. Molecular Ecology, 23, 29–39. 10.1111/mec.12509 [DOI] [PubMed] [Google Scholar]
- Pons, M. , Melnychuk, M. , & Hilborn, R. (2018). Management effectiveness of large pelagic fisheries in the high seas. Fish and Fisheries, 19, 260–270. 10.1111/faf.12253 [DOI] [Google Scholar]
- Prince, D. J. , O'Rourke, S. M. , Thompson, T. Q. , Ali, O. A. , Lyman, H. S. , Saglam, I. K. , … Miller, M. R. (2017). The evolutionary basis of premature migration in Pacific salmon highlights the utility of genomics for informing conservation. Science Advances, 3, e1603198 10.1126/sciadv.1603198 [DOI] [PMC free article] [PubMed] [Google Scholar]
- Pritchard, J. , Stephens, M. , & Donnelly, P. (2000). Inference of population structure using multilocus genotype data. Genetics, 155, 945–959. [DOI] [PMC free article] [PubMed] [Google Scholar]
- Purcell, C. , & Edmands, S. (2011). Resolving the genetic structure of striped marlin, Kajikia audax, in the Pacific Ocean through spatial and temporal sampling of adult and immature fish. Canadian Journal of Fisheries and Aquatic Sciences, 68, 1861–1875. 10.1139/F2011-104 [DOI] [Google Scholar]
- R Core Team (2017). R: A language for environment and statistical computing. Vienna, Austria: R Foundation for Statistical Computing; Retrieved from https://www.R-project.org/ [Google Scholar]
- Raeymaekers, J. A. M. , Chaturvedi, A. , Hablützel, P. I. , Verdonck, I. O. , Hellemans, B. , Maes, G. E. , … Volckaert, F. A. M. (2017). Adaptive and non‐adaptive divergence in a common landscape. Nature Communications, 8, 1–8. 10.1038/s41467-017-00256-6 [DOI] [PMC free article] [PubMed] [Google Scholar]
- Reiss, H. , Hoarau, G. , Dickey‐Collas, M. , & Wolff, W. (2009). Genetic population structure of marine fish: Mismatch between biological and fisheries management units. Fish and Fisheries, 10, 361–395. 10.1111/j.1467-2979.2008.00324.x [DOI] [Google Scholar]
- Roesti, M. , Salzburger, W. , & Berner, D. (2012). Uninformative polymorphisms bias genome scans for signatures of selection. BMC Evolutionary Biology, 12(1), 94 10.1186/1471-2148-12-94 [DOI] [PMC free article] [PubMed] [Google Scholar]
- Rosenberg, N. (2004). DISTRUCT: A program for the graphical display of population structure. Molecular Ecology Notes, 4, 137–138. 10.1046/j.1471-8286.2003.00566.x [DOI] [Google Scholar]
- Sansaloni, C. , Petroli, C. , Jaccoud, D. , Carling, J. , Detering, F. , Grattapaglia, D. , & Kilian, A. (2011). Diversity Arrays Technology (DArT) and next‐generation sequencing combined: Genome‐wide, high throughput, highly informative genotyping for molecular breeding of Eucalyptus. BMC Proceedings, 5(Suppl. 7), P54 10.1186/1753-6561-5-S7-P54 22373051 [DOI] [Google Scholar]
- Scoles, D. , & Graves, J. (1993). Genetic analysis of the population structure of yellowfin tuna, Thunnus albacares, from the Pacific Ocean. Fishery Bulletin, 91, 690–698. [Google Scholar]
- Selkoe, K. A. , D'Aloia, C. C. , Crandall, E. D. , Iacchei, M. , Liggins, L. , Puritz, J. B. , … Toonen, R. J. (2016). A decade of seascape genetics: Contributions to basic and applied marine connectivity. Marine Ecology Progress Series, 554, 1–19. 10.3354/meps11792 [DOI] [Google Scholar]
- Selkoe, K. , & Toonen, R. (2011). Marine connectivity: A new look at pelagic larval duration and genetic metrics of dispersal. Marine Ecology Progress Series, 436, 291–305. 10.3354/meps09238 [DOI] [Google Scholar]
- Seutin, G. , White, B. , & Boag, P. (1991). Preservation of avian blood and tissue samples for DNA analyses. Canadian Journal of Zoology, 69, 823–890. 10.1139/z91-013 [DOI] [Google Scholar]
- Simberloff, D. (1988). The contribution of population and community biology to conservation science. Annual Review of Ecology and Systematics, 19, 473–511. 10.1146/annurev.es.19.110188.002353 [DOI] [Google Scholar]
- Sippel, T. , Davie, P. , Holdsworth, J. , & Block, B. (2007). Striped marlin (Tetrapturus audax) movements and habitat utilization during a summer and autumn in the Southwest Pacific Ocean. Fisheries Oceanography, 16, 459–472. 10.1111/j.1365-2419.2007.00446.x [DOI] [Google Scholar]
- Soulé, M. E. (1985). What is conservation biology? BioScience, 35, 727–734. [Google Scholar]
- Sun, C. , Chang, S.‐Y. , Chang, Y.‐J. , Yeh, S.‐Z. , Su, N.‐J. , & Chiang, W.‐C. (2011). Reproductive biology of female striped marlin (Kajikia audax) in the waters off Taiwan. Honolulu, HI: International Scientific Committee for Tuna and Tuna‐like Species in the North Pacific Ocean. [Google Scholar]
- Sundqvist, L. , Keenan, K. , Zackrisson, M. , Prodohl, P. , & Kleinhans, D. (2016). Directional genetic differentiation and relative migration. Ecology and Evolution, 6, 3461–3475. 10.1002/ece3.2096 [DOI] [PMC free article] [PubMed] [Google Scholar]
- Thompson, T. Q. , Bellinger, M. R. , O'Rourke, S. M. , Prince, D. J. , Stevenson, A. E. , Rodrigues, A. T. , … Miller, M. R. (2019). Anthropogenic habitat alteration leads to rapid loss of adaptive variation and restoration potential in wild salmon populations. Proceedings of the National Academy of Sciences of the United States of America, 116, 177–186. 10.1073/pnas.1811559115 [DOI] [PMC free article] [PubMed] [Google Scholar]
- Ueyanagi, S. (1974). On an additional diagnostic character for the identification of billfish larvae with some notes of the variations in pigmentation In Shomura R., & Williams F. (Eds.), Proceedings of the international billfish symposium Kailua‐Kona, Hawaii, 9–12 August 1972. Part 2. Review and contributed papers (pp. 73–78). [Google Scholar]
- Vähä, J. , & Primmer, C. (2006). Efficiency of model‐based Bayesian methods for detecting hybrid individuals under different hybridization scenarios and with different numbers of loci. Molecular Ecology, 15, 63–72. 10.1111/j.1365-294X.2005.02773.x [DOI] [PubMed] [Google Scholar]
- Waples, R. S. (1998). Separating the wheat from the chaff: Patterns of genetic differentiation in high gene flow species. Journal of Heredity, 89, 438–450. 10.1093/jhered/89.5.438 [DOI] [Google Scholar]
- Waples, R. S. , & Gaggiotti, O. (2006). What is a population? An empirical evaluation of some genetic methods for identifying the number of gene pools and their degree of connectivity. Molecular Ecology, 15, 1419–1439. 10.1111/j.1365-294X.2006.02890.x [DOI] [PubMed] [Google Scholar]
- Waples, R. S. , Grewe, P. , Bravington, M. , Hillary, R. , & Feutry, P. (2018). Robust estimates of a high Ne/N ratio in a top marine predator, Southern bluefin tuna. Science Advances, 4, eaar7759 10.1126/sciadv.aar7759 [DOI] [PMC free article] [PubMed] [Google Scholar]
- Waples, R. S. , Punt, A. , & Cope, J. (2008). Integrating genetic data into management of marine resources: How can we do it better? Fish and Fisheries, 9, 423–449. 10.1111/j.1467-2979.2008.00303.x [DOI] [Google Scholar]
- Ward, R. , Eiliott, N. , Grewe, P. , Smolenski, A. , & Sea, C. (1994). Allozyme and mitochondrial DNA variation in yellowfin tuna (Thunnus albacares) from the Pacific Ocean. Marine Biology, 539, 531–539. 10.1007/BF00347499 [DOI] [Google Scholar]
- Ward, R. , Woodwark, M. , & Skibinski, D. (1994). A comparison of genetic diversity levels in marine, freshwater, and anadromous fishes. Journal of Fish Biology, 44, 213–232. 10.1111/j.1095-8649.1994.tb01200.x [DOI] [Google Scholar]
- WCPFC (2012). Stock Assessment of striped marlin (Kajikia audax) in the southwest Pacific Ocean. Nouméa, New Caledonia: Western and Central Pacific Fisheries Commission. [Google Scholar]
- WCPFC (2018). Stock assessment update for striped marlin (Kajikia audax) in the western and central North Pacific Ocean through 2013. Nouméa, New Caledonia: Western and Central Pacific Fisheries Commission. [Google Scholar]
- Whitlock, M. , & Lotterhos, K. (2015). Reliable detection of loci responsible for local adaptation: Inference of a null model through trimming the distribution of FST*. The American Naturalist, 186, S24–S36. [DOI] [PubMed] [Google Scholar]
- Wigginton, J. , Cutler, D. , & Abecasis, R. (2005). A note on exact tests of Hardy‐Weinberg equilibrium. American Journal of Human Genetics, 76, 887–893. 10.1086/429864 [DOI] [PMC free article] [PubMed] [Google Scholar]
- Williams, S. (2018). The global biology, ecology and phylogenetic status of black marlin (Istiompax indica). Doctoral dissertation, University of Queensland Australia, Brisbane, Queensland, Australia. [Google Scholar]
- Wu, G. , Chiang, H. , Chou, Y. , Wong, Z. , Hsu, C. , Chen, C. , & Yang, H. (2010). Phylogeography of yellowfin tuna (Thunnus albacares) in the Western Pacific and the Western Indian Oceans inferred from mitochondrial DNA. Fisheries Research, 105, 248–253. 10.1016/j.fishres.2010.03.015 [DOI] [Google Scholar]
- Zhang, Z. , Schwartz, S. , Wagner, L. , & Miller, W. (2000). A greedy algorithm for aligning DNA sequences. Journal of Computational Biology, 7, 203–214. 10.1089/10665270050081478 [DOI] [PubMed] [Google Scholar]
Associated Data
This section collects any data citations, data availability statements, or supplementary materials included in this article.
Data Citations
- Mamoozadeh, N. , Graves, J. , & McDowell, J. (2019). Genome‐wide SNPs resolve spatiotemporal patterns of connectivity within striped marlin (Kajikia audax), a broadly distributed and highly migratory pelagic species Dryad Digital Repository, 10.5061/dryad.3j9kd51cp [DOI] [PMC free article] [PubMed]
Supplementary Materials
Data Availability Statement
Data available from the Dryad Digital Repository: https://doi.org/10.5061/dryad.3j9kd51cp (Mamoozadeh, Graves, & McDowell, 2019).