

Abstract
The aim of the present meta-analysis was to evaluate the effect of vitamin D supplementation on patients with polycystic ovary syndrome (PCOS). A literature search was performed to identify all of the relevant studies comparing the effect of vitamin D supplementation with placebo in PCOS patients, in the PubMed, Embase and Web of Science databases. All statistical analyses were performed on case-control studies using Review Manager 5.3 software, provided by the Cochrane Collaboration. A total of 11 studies involving 483 participants were included in the current meta-analysis. Vitamin D supplementation appeared to lead to an improvement in the levels of total testosterone [weighted mean differences (WMD) = -0.10, 95% CI (-0.18, -0.02)], homeostasis model assessment of insulin resistance [WMD = -0.44, 95% CI (-0.86, -0.03)], homeostasis model assessment of β-cell function [WMD = -16.65, 95% CI (-19.49, -13.80)], total cholesterol [WMD = -11.90, 95% CI (-15.67, -8.13)] and low-density lipoprotein-cholesterol [WMD = -4.54; 95% CI (-7.29, -1.80)]. The results failed to show a positive effect of vitamin D supplementation on the body mass index, dehydroepiandrosterone sulfate, triglyceride levels or high-density lipoprotein-cholesterol. In conclusion, the data from the available randomized controlled trials (RCTs) suggested vitamin D supplementation reduced insulin resistance and hyperandrogenism, as well improving the lipid metabolism of patients with PCOS to an extent. Further high-quality RCTs from a variety of regions in the world are required to determine the effectiveness of vitamin D supplementation in PCOS patients, and to determine a suitable dose and unit of vitamin D.
Keywords: meta-analysis, vitamin D, polycystic ovary syndrome, lipid metabolic, insulin resistance
Introduction
Polycystic ovary syndrome (PCOS) is a common female endocrine disorder, affecting 6-12% of women of reproductive age globally (1). It is characterized by symptoms such as menstrual irregularity, anovulatory infertility, hyperandrogenism and obesity, as well as metabolic dysfunctions including insulin resistance, type 2 diabetes and dyslipidemia (2). These symptoms can have a serious impact on the quality of life and health of patients. However, due to the complexity of this disease, the pathogenesis remains unclear, and an optimal treatment has not been determined (3). There is a growing need to develop innovative interventions to treat this disease.
Recently, a series of studies have demonstrated that vitamin D deficiency (VDD) is common in patients with PCOS and that VDD may be associated with metabolic and endocrine disorders in PCOS (4-7). Compared with the general population, the prevalence of VDD is relatively higher in PCOS patients (6). Vitamin D is a steroid hormone that is involved in the balance of calcium phosphate and bone mineralization (8). Vitamin D receptors are expressed at 2,776 genomic positions and modulate the expression of 229 genes in more than 30 different tissues, including the pancreas, liver, immune cells, brain and ovaries (9). As a result, vitamin D supplementation for PCOS therapy has attracted attention.
Although a growing number of intervention studies have assessed the relationship between vitamin D supplementation and PCOS, there is a lack of convincing evidence demonstrating the effect of vitamin D supplementation on PCOS. Therefore, the objective of this meta-analysis was to quantitatively summarize the available evidence to assess the effects of vitamin D supplementation on metabolic and hormonal functions in patients with PCOS.
Materials and methods
Data sources and search strategy
In the present study, a systematic search was performed, searching for studies between January 1965 and July 2019 in PubMed (https://www.ncbi.nlm.nih.gov/pubmed/), Embase (https://www.elsevier.com/solutions/embase-biomedical-research), Web of Science (http://webofscience.com) and Ovid Medline (http://ovidsp.ovid.com/). The search was initially conducted using Medical Subject Headings and the following free key words: Polycystic ovary syndrome, polycystic ovary disease, PCOS, calcitriol and vitamin D. Randomized controlled trials (RCTs) investigating the effects of vitamin D supplementation for patients with PCOS were included in the current meta-analysis. A full manual search of the bibliographies of selected studies was performed to identify additional studies.
Inclusion and exclusion criteria
Studies were included if they met the following criteria: A randomized, controlled clinical trial comparing the effects of vitamin D supplementation with placebo; studies that enrolled women with a strict diagnosis of PCOS based on diagnostic criteria produced by the Rotterdam European Society of Human Reproduction and Embryology (ESHRE) and the American Society of Reproductive Medicine (ASRM); the main outcomes included body mass index (BMI), total testosterone, dehydroepiandrosterone sulfate (DHEAs), homeostasis model assessment of insulin resistance (HOMA-IR), homeostasis model assessment of β-cell function (HOMA-B), triglycerides, total cholesterol, low density lipoprotein-cholesterol (LDL-C) or low density lipoprotein-cholesterol (HDL-C). For each trial, the most recent data was used in the present analysis.
The exclusion criteria were as follows: Studies reporting other diseases, such as diabetes, Cushing's syndrome, hyperthyroidism or other hormone-related disorders; studies reporting other treatments, such as calcium or metformin; and studies not published in English.
Data extraction
Data extraction and quality assessment were performed by two authors independently. The following information was extracted and entered into a database: The first author's name, year of publication, country, study design, date of accrual, diagnostic criteria for PCOS, the basic characteristics of participants (principal baseline characteristics such as number and age), the control interventions and the main outcomes which included BMI, total testosterone, DHEAs, HOMA-IR, HOMA-B, triglycerides, total cholesterol, LDL-C and HDL-C.
Study quality
The quality of each study was independently assessed by two authors according to the following criteria: Studies designed with case characteristics matched to controls; the studies followed strict inclusion and exclusion criteria for patients; and the methodological quality of the included studies described by Jadad RCT guidelines (a randomized method, concealment allocation, a blinding method and a follow-up) and the Cochrane risk bias assessment tool (10).
Statistical analysis
Continuous data are presented as the mean and SD for all included studies. Weighted mean differences (WMDs) with 95% confidence intervals (CIs) were calculated. In order to measure the heterogeneity among all included studies, Cochran's Q-tests (χ2 test) were used. A Cochran Q-test with P>0.10 and the I2 statistic <50% indicated statistical homogeneity. If the results of the Cochran Q-test favored homogeneity among the studies, the fixed-effect model was used to calculate the total effect size. The random-effects model of meta-analysis was used when unexplained statistical heterogeneity was present. P≤0.05 and a 95% CI not containing 0 (WMD) were considered to be statistically significant. Funnel plots were used to assess publication bias. The current meta-analysis was performed using Review Manager 5.3 software (https://community.cochrane.org/help/tools-and-software/revman-5/revman-5-download/installation) provided by the Cochrane Collaboration.
Results
Study selection
A total of 2,123 relevant studies were obtained in the preliminary examination. After reading the titles and abstracts, 132 related studies were selected. After obtaining the full texts and reviewing them one by one, 121 studies were further excluded. Among them, 76 studies did not conform to the inclusion criteria, 30 studies did not have complete data and 15 studies were of low quality. A total of 11 studies were eventually included. The literature screening process is shown in Fig. 1.
Figure 1.
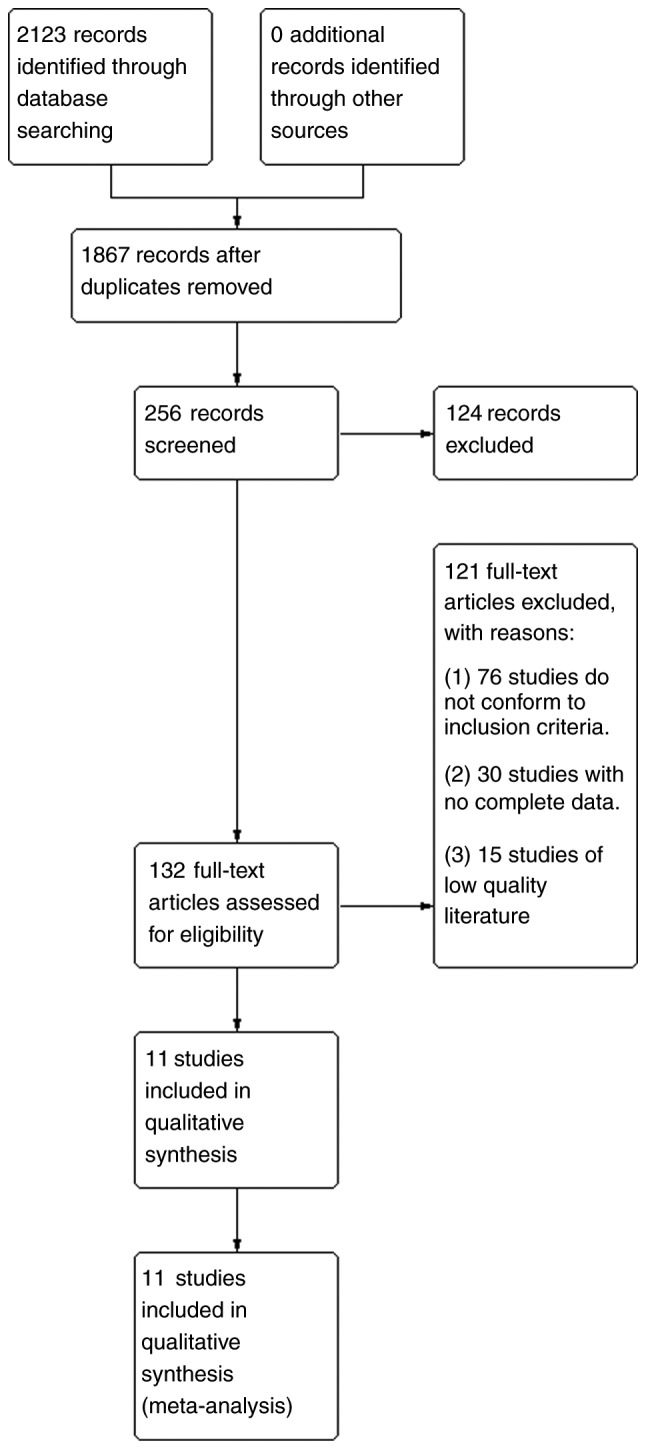
Literature retrieval process. Through searches of the PubMed, Embase, Medline and Web of Science databases, a total of 2,123 relevant studies were obtained. A total of 1,867 studies were obtained after removing duplicates. Of these, 256 were obtained after limiting the research direction and research type, and 124 of them were deleted after further reading of the title and abstract of the article. The remaining 132 studies were examined carefully. Among them, 76 studies did not meet the inclusion criteria, 30 studies lacked complete data, and 15 low-quality studies were excluded. Finally, 11 studies were selected for meta-analysis.
Characteristics of included studies
A total of 11 studies involving 483 participants were included in the meta-analysis. Table I lists the basic characteristics of all included studies. The diagnosis of PCOS in all 11 studies was based on the guidelines of the ESHRE and ASRM. A total of seven studies were conducted in Iran, two were in the United States, one was in India and one was in the UK. A total of 11 studies compared post-intervention differences in metabolic and endocrine parameters between vitamin D supplements and placebo groups.
Table I.
Major characteristics measured in the current study.
| Authors, year | RCT | Date of accrual | Region | No. of patients | Age | Symptoms | Treatment | Course | Outcome | (Refs.) |
|---|---|---|---|---|---|---|---|---|---|---|
| Jafari-Sfidvajani et al, 2018 | Y | March 2016- February 2017 | Iran | 30 | 28.43±6.27 | PCOS, overweight, VDD | Weight-loss intervention + 50,000 IU/week oral vitamin D3 | 12 weeks | BMI, total testosterone, DHEAS | (25) |
| 30 | 27.83±5.71 | Weight lossintervention + placebo | ||||||||
| Seyyed Abootorabi et al, 2018 | Y | / | Iran | 19 | 26.21±4.62 | PCOS, VDD | 50,000 IU of oral vitamin D3 | 8 weeks | HOMA-IR, HOMA-B, QUICKI, FPG | (26) |
| 17 | 22.76±4.40 | Placebo | ||||||||
| Maktabi et al, 2017 | Y | April 2016 -June 2016 | Iran | 35 | 22.0±1.6 | Phenotype B of PCOS, VDD | 50,000 IU vitamin D every 2 weeks | 12 weeks | FPG, HOMA-IR, HOMA-B, QUICKI, total testosterone, | (27) |
| 35 | 23.1±3.3 | Placebo | DHEAS, triglycerides, total cholesterol, LDL-C, HDL-C | |||||||
| Ardabili et al, 2012 | Y | March 2010-June 2010 | Iran | 24 | 26.8±4.7 | PCOS, VDD | 50,000 IU of vitamin D3 every 20 days | 8 weeks | BMI, HOMA, HOMA-IR, QUICKI, FPG | (28) |
| 26 | 27.0±3.7 | Placebo | ||||||||
| Raja-Khan et al, 2014 | Y | July 2009-November 2010 | USA | 11 | 28.2±5.2 | PCOS | Vitamin D3 12,000 IU daily | 12 weeks | BMI, QUICKI, HOMA-IR, FPG, LDL-C, HDL-C, triglyc | (29) |
| 11 | 28.7±5.6 | Placebo | erides, total cholesterol, total testosterone | |||||||
| Garg et al, 2015 | Y | / | India | 15 | 22.0±4.61 | PCOS | Metformin (1,500 mg/day) + vitamin D 4,000 IU/day (monthly dose of 120,000 IU) | 24 weeks | BMI, HOMA-IR, FPG, DHEAs, triglycerides, total cholesterol, LDL-C, HDL-C, total testosterone | (30) |
| 17 | 22.8±4.56 | Metformin (1,500 mg/day) + placebo | ||||||||
| Dastorani et al, 2018 | Y | December 2017-March 2018 | Iran | 20 | 29.9±4.4 | PCOS | 50,000 IU vitamin D every other week | 8 weeks | FPG, Insulin, HOMA-IR, QUICKI, Triglycerides, Total | (31) |
| 20 | 30.1±3.4 | Placebo | cholesterol, LDL-C, HDL-C | |||||||
| Javed et al, 2019 | Y | / | UK | 18 | 28.6±5.5 | VDD | Vitamin D 3200 IU daily | 12 weeks | hs-CRP, BMI, HOMA-IR, | (13) |
| 19 | 29.1±7.5 | PCOS | Placebo | weight, lipid profile, glucose levels, insulin levels, FAI, testosterone, TC, LDL-C, HDL-C, TG | ||||||
| Irani et al, 2015 | Y | October 2013-January 2015 | USA | 35 | 30.5±1.0 | VDD, PCOS | 50,000 IU of oral vitamin D3 once weekly | 8 weeks | HOMA-IR, HOMA-B,, triglycerides total cholesterol, | (32) |
| 18 | 29.6±1.7 | Placebo once weekly | HDL-C, LDL-C, DHEAS, total testosterone | |||||||
| Foroozanfard et al, 2015 | Y | June-August 2014 | Iran | 26 | / | VDD, PCOS | 50,000 IU vitamin D weekly and calcium placebo daily Calcium placebo daily plus vitamin D placebo weekly | 8 weeks | HOMA-B | (33) |
| Bonakdaran et al, 2012 | Y | / | Iran | 15 | 24.7±3.3 | PCOS | Calcitriol 0.5 µg/day | 12 weeks | Total testosterone, DHEAS, | (34) |
| 16 | 25.2±7.9 | Placebo | HOMA-IR |
Y, yes; BMI, body mass index; DHEAS, dehydroepiandrosterone sulfate; FPG, fasting plasma glucose; HDL-C, high density lipoprotein-cholesterol ; HOMA, homeostasis model assessment; HOMA-B, homeostasis model assessment of β-cell function; HOMA-IR, homeostasis model assessment of insulin resistance ; IU, international units; LDL-C, low density lipoprotein-cholesterol ; QUICKI, quantitative insulin sensitivity check index; PCOS, polycystic ovary syndrome; RCT, randomized controlled trial; VDD, vitamin D deficiency.
Assessment of bias risk
The quality assessment of eligible studies was accomplished using the Jadad and Cochrane standards. The results are shown in Table II, and Figs. 2 and 3.
Table II.
Quality assessment of the included studies using the Jadad Scale.
| Authors, year | Randomized method | Concealment allocation | Blinding method | Follow-up | Total score | (Refs.) |
|---|---|---|---|---|---|---|
| Jafari-Sfidvajani et al, 2018 | 2 | 1 | 2 | 1 | 6 | (25) |
| Seyyed Abootorabi et al, 2018 | 1 | 1 | 0 | 1 | 3 | (26) |
| Maktabi et al, 2017 | 2 | 2 | 2 | 0 | 6 | (27) |
| Foroozanfard et al, 2015 | 2 | 2 | 2 | 1 | 7 | (33) |
| Irani et al, 2015 | 1 | 1 | 1 | 1 | 4 | (32) |
| Garg et al, 2015 | 2 | 2 | 1 | 1 | 6 | (30) |
| Raja-Khan et al, 2014 | 2 | 2 | 2 | 1 | 7 | (29) |
| Ardabili et al, 2012 | 2 | 2 | 1 | 1 | 6 | (28) |
| Bonakdaran et al, 2012 | 1 | 1 | 0 | 1 | 3 | (34) |
| Javed et al, 2019 | 2 | 1 | 2 | 0 | 5 | (13) |
| Dastorani et al, 2018 | 2 | 1 | 2 | 1 | 6 | (31) |
Figure 2.
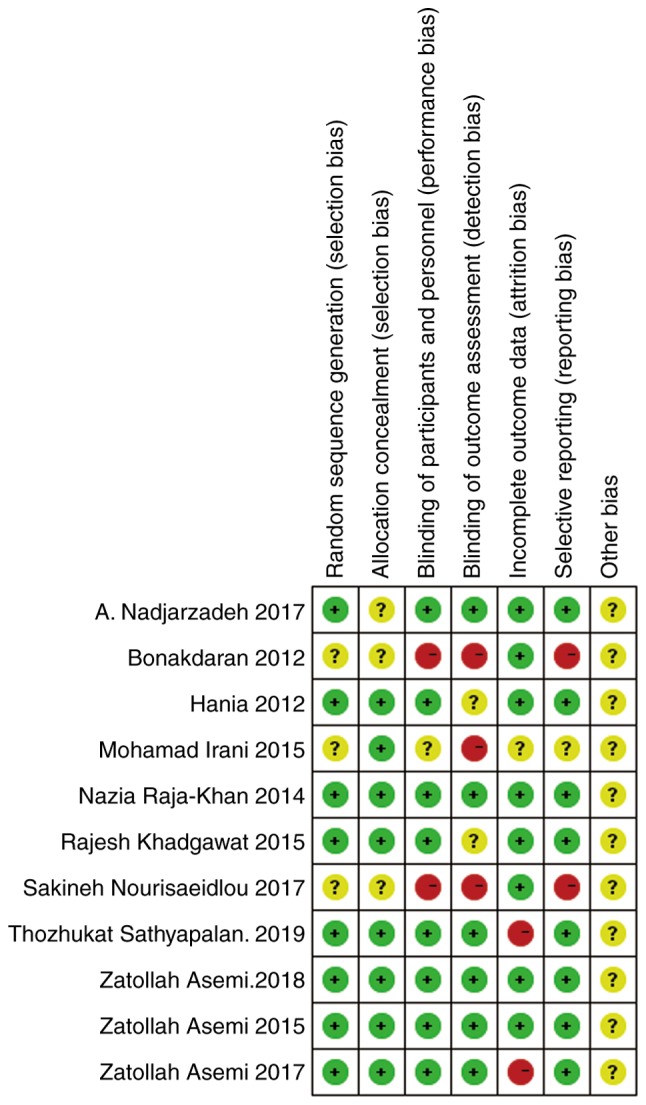
Quality of the included 11 studies, evaluated using the Cochrane bias risk assessment tool provided by the Review Manager software. Different colors (green, red and yellow) and symbols (‘ + ’, ‘-’ and ‘?’) were used in the figure to indicate low risk bias, high risk bias and unclear, respectively.
Meta-analysis
Effect of vitamin D supplementation on the BMIs of patients with PCOS
A total of five studies were included with the main outcome indicator being the BMI. Heterogeneity tests showed no heterogeneity in each study (χ2=1.00; P=0.91; I2=0%). The results of the meta-analysis using the fixed effect model showed that the BMI of the vitamin D group was not significantly different from that of the placebo group [WMD = 0.00, 95% CI (-0.20, 0.20), P=1.00; Fig. 4].
Figure 4.

A total of five studies (n=201) reported the BMI at the endpoint. There was no statistical heterogeneity among the results (P=0.91, I2=0%). The meta-analysis results of the fixed-effect model showed that there was no statistical difference in the BMI between the vitamin D group and the placebo group. Weighted mean difference = 0.00, 95% confidence interval (-0.20, 0.20), P=1.00. BMI, body mass index; CI, confidence interval.
Effects of vitamin D supplementation on androgen level in patients with PCOS
The main outcome indicators in the present study were total testosterone and DHEA levels. Heterogeneity tests were carried out according to the varying outcome indicators, and the results showed that there was no heterogeneity in either study (χ2=0.79, P=0.94, I2=0%; Fig. 5; χ2=1.42, P=0.84, I2=0%; Fig. 6). The meta-analysis was conducted using the fixed effect model. The results showed that the total testosterone in the vitamin D group was lower than that in the placebo group, and the difference was statistically significant [WMD = -0.10, 95% CI (-0.18, -0.02), P=0.02; Fig. 5]. However, the difference in DHEA levels between the vitamin D group and the placebo group was not statistically significant [WMD = 0.01, 95% CI (-0.04, 0.06), P=0.80; Fig. 6].
Figure 5.

A total of five studies (n=215) reported the total testosterone levels at the endpoint. There was no statistical heterogeneity among the results (P=0.94, I2=0%). The meta-analysis results of the fixed-effect model showed that the total testosterone levels of the vitamin D group were lower than those of the placebo group, and that the difference was statistically significant. Weighted mean difference = -0.10, 95% CI (- 0.18, -0.02), P=0.02. CI, confidence interval.
Figure 6.

A total of five studies (n=246) reported the DHEA values at the endpoint. There was no statistical heterogeneity among the results (P=0.84, I2=0%). The meta-analysis results of the fixed-effect model showed that there was no statistical difference in DHEAs between the vitamin D group and the placebo group. Weighted mean difference = 0.01, 95% confidence interval (-0.04, 0.06), P=0.80. CI, confidence interval; DHEA, dehydroepiandrosterone.
Effects of vitamin D supplementation on blood glucose metabolism in patients with PCOS
The outcome indicators that were used to evaluate the effect of vitamin D treatment on the blood glucose metabolism of patients were HOMA-IR and HOMA-B. The heterogeneity test was carried out according to the different outcome indicators, and the results showed that there was moderate heterogeneity among the studies (HOMA-IR, χ2=8.38, P=0.21, I2=28%; HOMA-B, χ2=7.69, P=0.10, I2=48%). The indicators were analyzed using the fixed effect model. Meta-analysis results showed that the HOMA-IR and HOMA-B levels in the vitamin D group were significantly lower than those of the placebo group, and the difference was statistically significant [WMD = -0.44, 95% CI (-0.86, -0.03), P=0.04; Fig. 7; WMD = -16.65, 95% CI (-19.49, -13.80), P<0.01; Fig. 8].
Figure 7.

A total of seven studies (n=278) reported HOMA-IR values at the endpoint. There was no significant statistical heterogeneity among the results (P=0.21, I2=28%). Results of the meta-analysis of the fixed-effect model showed that the HOMA-IR value in the vitamin D group was lower than that in the placebo group, and the difference was statistically significant. Weighted mean difference = -0.44, 95% CI (-0.86, -0.03), P=0.04. CI, confidence interval; HOMA-IR, homeostasis model assessment of insulin resistance.
Figure 8.

A total of five studies (n=261) reported HOMA-B values at the endpoint. There was no significant statistical heterogeneity among the results (P=0.10, I2=48%). The meta-analysis results of the fixed-effect model showed that the endpoint HOMA-B value of the vitamin D group was lower than that of the placebo group, and the difference was statistically significant. Weighted mean difference = -16.65, 95% CI (-19.49, -13.80), P<0.01. CI, confidence interval; HOMA-B, homeostasis model assessment of β-cell function.
Effects of vitamin D supplementation on lipid metabolism in patients with PCOS
The outcome indicators that were used to evaluate the effect of vitamin D on the lipid metabolism of patients were triglycerides, total cholesterol, LDL-C and HDL-C. The heterogeneity test was carried out according to different outcome indicators, and the results showed that there was no heterogeneity in each study (triglycerides, χ2=0.81, P=0.94, I2=0%; total cholesterol, χ2=5.11, P=0.28, I2=22%; LDL-C, χ2=2.68, P=0.61, I2=0%; HDL-C, χ2=1.83, P=0.77, I2=0%). The meta-analysis was conducted using the fixed effect model. The results showed that the total cholesterol and LDL-C levels of the vitamin D group were significantly lower than those of the placebo group, and that the difference was statistically significant [WMD =- 11.90, 95% CI (-15.67, -8.13), P<0.01; Fig. 9]; WMD = -4.54, 95% CI (-7.29, -1.80), P=0.001; Fig. 10]. However, the difference in the triglyceride and HDL-C levels between the vitamin D group and the placebo group was not statistically significant [WMD = -5.59, 95% CI (-12.11, 0.93), P=0.09; Fig. 11; WMD = -0.43, 95% CI (-1.56, 0.69), P=0.45; Fig. 12].
Figure 9.

A total of five studies (n=217) reported total cholesterol values at the endpoint. There was no significant statistical heterogeneity among the results (P=0.28, I2=22%). The results of the meta-analysis on the fixed-effect model showed that the total cholesterol value of the vitamin D group was lower than that of the placebo group, and the difference was statistically significant. Weighted mean difference = -11.90, 95% CI (-15.67, -8.13), P<0.01. CI, confidence interval.
Figure 10.

A total of five studies (n=217) reported LDL-C values at the endpoint. There was no significant statistical heterogeneity among the results (P=0.61, I2=0%). The meta-analysis results of the fixed-effect model showed that the LDL-C value of the vitamin D group was lower than that in the placebo group, and the difference was statistically significant. Weighted mean difference = -4.54, 95%CI (-7.29, -1.80), P=0.001. CI, confidence interval; LDL-C, low-density lipoprotein-cholesterol.
Figure 11.

A total of five studies (n=217) reported the triglyceride levels at the endpoint. There was no significant statistical heterogeneity among the results (P=0.94, I2=0%). The meta-analysis results of the fixed-effect model showed that there was no statistical difference in triglyceride levels between the vitamin D group and the placebo group. Weighted mean difference = -5.59, 95% CI (-12.11, 0.93), P=0.09. CI, confidence interval; df, degrees of freedom.
Figure 12.

A total of five studies (n=217) reported HDL-C value at the endpoint. There was no significant statistical heterogeneity among the results (P=0.77, I2=0%). The meta-analysis results of the fixed-effect model showed that there was no statistical difference in HDL-C values between the vitamin D group and the placebo group at the at the endpoint. Weighted mean difference = -0.43, 95% CI (-1.56, 0.69), P=0.45. CI, confidence interval; HDL-C, high density lipoprotein-cholesterol.
Sensitivity analyses and publication bias
Sensitivity analyses were performed to evaluate the stability of the results using the random-effect method. The results showed that there was no significant change when any one of the studies was excluded from the total analyses. Funnel plots were used to evaluate the significance of publication bias. The results of the funnel plots showed that there was no significant publication bias for HDL-C (Fig. S1), HOMA-IR (Fig. S3), LDL-C (Fig. S4), total testosterone (Fig. S6), BMI (Fig. S8) and DHEAs (Fig. S9). However, publication biases were found in HOMA-B (Fig. S2), total cholesterol (Fig. S5) and triglycerides (Fig. S7).
Discussion
The current meta-analysis of RCTs was designed to determine the efficacy of vitamin D supplementation in PCOS. HOMA-IR, HOMA-B are both important factors in the development of diabetes, and are also used as one of the main methods to measure insulin sensitivity (11,12). In regards to lipid metabolism, LDL-C, HDL-C, triglycerides and total cholesterol are common indicators of the lipid profile of a patient, and LDL-C is an independent risk factor for cardiovascular disease (13). Evidence from the current results suggested that the use of vitamin D, as a treatment for patients with PCOS, could improve insulin resistance, hyperandrogenism and a number of the lipid metabolic parameters in PCOS patients in the short-term follow-up intervention.
These outcomes are consistent with several previous reports. Several similar studies (14-16) have demonstrated that vitamin D supplementation therapy has a beneficial effect on insulin resistance in women with PCOS. Wehr et al (17) found that after 12 weeks of vitamin D treatment, total cholesterol and LDL-C levels significantly increased, while there was no obvious change in HDL-C and triglycerides levels. Following 24 weeks of intervention, significant changes were observed in the levels of total cholesterol, LDL-C and triglycerides. According to this study, some of the non-significant results may be attributed to the short duration of the intervention. A previous meta-analysis by Azadi-Yazdi et al (18) suggested that vitamin D supplementation may significantly affect the serum total testosterone, whilst not being effective in improving other markers of the androgenic profile. These results are consistent with the results of the present study.
Insulin resistance is defined decreased sensitivity of tissues to insulin, thereby resulting in reduced glucose utilization. As glucose does not enter the target cells, serum glucose concentrations increase, which stimulates pancreatic β-cells to secrete more insulin into the blood. It is generally considered that insulin resistance plays an pivotal role in the pathogenesis of PCOS (19). Insulin resistance is associated with the development of impaired glucose tolerance and type 2 diabetes, as well as affecting lipid metabolism (20). However, insulin resistance also increases hyperandrogenism by affecting the production of hepatic sex hormone-binding globulin (21). Vitamin D may contribute to the development of insulin resistance by enhancing PPARγ expression, which enhances insulin synthesis and release, and vitamin D may promote insulin receptor expression or suppression of proinflammatory cytokines (9,22,23).
However, a 2016 meta-analysis (24) reported that vitamin D supplementation did not influence the glucose and lipid metabolic parameters in PCOS patients. Due to the different interventions of the included studies, the result of the present meta-analysis is different from that of the 2016 meta-analysis, in which the intervention method was vitamin D supplementation or metformin.
The current meta-analysis had a number of strengths, including a comprehensive literature search, specified inclusion and exclusion criteria, explicit methods for data extraction and the inclusion of measures taken to properly reduce the influence of bias and to assess heterogeneity. However, despite these strengths, the current meta-analysis also had a number of limitations. Firstly, the number of studies available for each meta-analysis was less than seven, which may be too small for the assessment of publication bias through funnel plots. Most studies examined had a small sample size and short term follow-ups. There were also many variations among studies such as doses and units of vitamin D that were used, as well as the duration of interventions. The present study was unable to investigate the curative effects of different doses and treatment durations. Furthermore, varying levels of exposure to sunlight may have had an impact on the analysis, which may have affected the quality of the results. A number of the studies also did not apply appropriate randomization and allocation concealment, thus there is a risk of selection bias.
In conclusion, despite several limitations, the present study found that vitamin D supplementation could affect insulin resistance, lipid metabolism and, to an extent, hyperandrogenism in patients with PCOS. Therefore, vitamin D should be considered as a treatment for PCOS. There is a strong need for further research to directly validate the results of the present study. Further studies should include large sample sizes and long-term interventions, with double-blind placebo controls. It would also be of benefit to perform these studies worldwide, especially in areas where women are exposed to abundant sunlight. Additionally, it would be of interest to the effects of vitamin D on the induction of ovulation or menstrual cycle regulation in patients with PCOS. Further experiments should also be designed to explore the pathogenesis between vitamin D and PCOS. Finally, an optimal dose of vitamin D should be determined to allow for an effective therapy to be developed.
Supplementary Material
Figure 3.
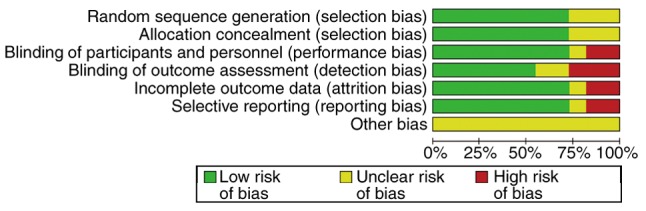
Quality assessment chart. The percentage of each level and the level of each specific study item are presented.
Acknowledgements
Not applicable.
Funding
No funding was received.
Availability of data and materials
The datasets used and/or analyzed during the current study are available from the corresponding author on reasonable request.
Authors' contributions
CYM and XJF were involved in data management and statistics, and drafted the manuscript. QZ and YC verifed the extracted data following the literature search, monitored the study and drafted the manuscript. QZ deisgned the current study. XJF and YC conducted the searches and performed statistical anlaysis. QZ and CYM performed extracted the data and contributed to quality assessment. All authors contributed to drafting and revising the manuscript and all authors read and approved the final manuscript.
Ethics approval and consent to participate
Not applicable.
Patient consent for publication
Not applicable.
Competing interests
The authors declare that they have no competing interests.
References
- 1.Bozdag G, Mumusoglu S, Zengin D, Karabulut E, Yildiz BO. The prevalence and phenotypic features of polycystic ovary syndrome: A systematic review and meta-analysis. Hum Reprod. 2016;31:2841–2855. doi: 10.1093/humrep/dew218. [DOI] [PubMed] [Google Scholar]
- 2. doi: 10.1093/humrep/deh098. Rotterdam ESHRE/ASRM-Sponsored PCOS Consensus Workshop Group. Revised 2003 consensus on diagnostic criteria and long-term health risks related to polycystic ovary syndrome (pcos). Hum Reprod 19: 41-47, 2004. [DOI] [PubMed] [Google Scholar]
- 3.Jin P, Xie Y. Treatment strategies for women with polycystic ovary syndrome. Gynecol Endocrinol. 2018;34:272–277. doi: 10.1080/09513590.2017.1395841. [DOI] [PubMed] [Google Scholar]
- 4.Wild RA, Rizzo M, Clifton S, Carmina E. Lipid levels in polycystic ovary syndrome: Systematic review and meta-analysis. Fertil Steril. 2011;95:1073–1079. doi: 10.1016/j.fertnstert.2010.12.027. [DOI] [PubMed] [Google Scholar]
- 5.Thomson RL, Spedding S, Buckley JD. Vitamin D in the aetiology and management of polycystic ovary syndrome. Clin Endocrinol (Oxf) 2012;77:343–350. doi: 10.1111/j.1365-2265.2012.04434.x. [DOI] [PubMed] [Google Scholar]
- 6.Mousa A, Naderpoor N, Teede HJ, De Courten MP, Scragg R, De Courten B. Vitamin D and cardiometabolic risk factors and diseases. Minerva Endocrinol. 2015;40:213–230. [PubMed] [Google Scholar]
- 7.Trummer C, Pilz S, Schwetz V, Obermayer-Pietsch B, Lerchbaum E. Vitamin D, PCOS and androgens in men: A systematic review. Endocr Connect. 2018;7:R95–R113. doi: 10.1530/EC-18-0009. [DOI] [PMC free article] [PubMed] [Google Scholar]
- 8.Holick MF. Vitamin D deficiency. N Engl J Med. 2007;357:266–281. doi: 10.1007/s11154-017-9424-1. [DOI] [PubMed] [Google Scholar]
- 9.Gatti D, Idolazzi L, Fassio A. Vitamin D: Not just bone, but also immunity. Minerva Med. 2016;107:452–460. [PubMed] [Google Scholar]
- 10.Jørgensen L, Paludan-Müller AS, Laursen DR, Savović J, Boutron I, Sterne JA, Higgins JP, Hróbjartsson A. Evaluation of the Cochrane tool for assessing risk of bias in randomized clinical trials: Overview of published comments and analysis of user practice in cochrane and non-cochrane reviews. Syst Rev. 2016;5(80) doi: 10.1186/s13643-016-0259-8. [DOI] [PMC free article] [PubMed] [Google Scholar]
- 11.Katz A, Nambi SS, Mather K, Baron AD, Follmann DA, Sullivan G, Quon MJ. Quantitative insulin sensitivity check index: A simple, accurate method for assessing insulin sensitivity in humans. J Clin Endocrinol Metab. 2000;85:2402–2410. doi: 10.1210/jcem.85.7.6661. [DOI] [PubMed] [Google Scholar]
- 12.Rössner SM, Neovius M, Mattsson A, Marcus C, Norgren S. HOMA-IR and QUICKI Decide on a general standard instead of making further comparisons. Acta Paediatr. 2010;99:1735–1740. doi: 10.1111/j.1651-2227.2010.01911.x. [DOI] [PubMed] [Google Scholar]
- 13.Javed Z, Papageorgiou M, Deshmukh H, Kilpatrick ES, Mann V, Corless L, Abouda G, Rigby AS, Atkin SL, Sathyapalan T. A randomized, controlled trial of vitamin D supplementation on cardiovascular risk factors, hormones, and liver markers in women with polycystic ovary syndrome. Nutrients. 2019;11(E188) doi: 10.3390/nu11010188. [DOI] [PMC free article] [PubMed] [Google Scholar]
- 14.Selimoglu H, Duran C, Kiyici S, Ersoy C, Guclu M, Ozkaya G, Tuncel E, Erturk E, Imamoglu S. The effect of vitamin D replacement therapy on insulin resistance and androgen levels in women with polycystic ovary syndrome. J Endocrinol Invest. 2010;33:234–238. doi: 10.1007/BF03345785. [DOI] [PubMed] [Google Scholar]
- 15.Łagowska K, Bajerska J, Jamka M. The role of vitamin D oral supplementation in insulin resistance in women with polycystic ovary syndrome: A systematic review and meta-analysis of randomized controlled trials. Nutrients. 2018;10(E1637) doi: 10.3390/nu10111637. [DOI] [PMC free article] [PubMed] [Google Scholar]
- 16.Hu Z, Chen J, Sun X, Wang L, Wang A. Efficacy of vitamin D supplementation on glycemic control in type 2 diabetes patients: A meta-analysis of interventional studies. Medicine (Baltimore) 2019;98(e14970) doi: 10.1097/MD.0000000000014970. [DOI] [PMC free article] [PubMed] [Google Scholar]
- 17.Wehr E, Pieber TR, Obermayer-Pietsch B. Effect of vitamin D3 treatment on glucose metabolism and menstrual frequency in polycystic ovary syndrome women: A pilot study. J Endocrinol Invest. 2011;34:757–763. doi: 10.3275/7748. [DOI] [PubMed] [Google Scholar]
- 18.Azadi-Yazdi M, Nadjarzadeh A, Khosravi-Boroujeni H, Salehi-Abargouei A. The effect of vitamin D supplementation on the androgenic profile in patients with polycystic ovary syndrome: A systematic review and meta-analysis of clinical trials. Horm Metab Res. 2017;49:174–179. doi: 10.1055/s-0043-103573. [DOI] [PubMed] [Google Scholar]
- 19.Cetkovic N, Pellicano R, Bjelica A, Abenavoli L. Polycystic ovary syndrome and vitamin D serum levels. Minerva Endocrinol. 2019;44:82–84. doi: 10.23736/S0391-1977.18.02887-0. [DOI] [PubMed] [Google Scholar]
- 20.Dargham SR, Ahmed L, Kilpatrick ES, Atkin SL. The prevalence and metabolic characteristics of polycystic ovary syndrome in the Qatari population. PLoS One. 2017;12(e0181467) doi: 10.1371/journal.pone.0181467. [DOI] [PMC free article] [PubMed] [Google Scholar]
- 21.Pugeat M, Crave J, Tourniaire J, Forest M. Clinical utility of sex hormone-binding globulin measurement. Horm Res. 1996;45:148–155. doi: 10.1159/000184778. [DOI] [PubMed] [Google Scholar]
- 22.Hoseini R, Damirchi A, Babaei P. Vitamin D increases PPARγ expression and promotes beneficial effects of physical activity in metabolic syndrome. Nutrition. 2017;36:54–59. doi: 10.1016/j.nut.2016.06.010. [DOI] [PubMed] [Google Scholar]
- 23.Pludowski P, Holick MF, Pilz S, Wagner CL, Hollis BW, Grant WB, Shoenfeld Y, Lerchbaum E, Llewellyn DJ, Kienreich K, Soni M. Vitamin D effects on musculoskeletal health, immunity, autoimmunity, cardiovascular disease, cancer, fertility, pregnancy, dementia and mortality-a review of recent evidence. Autoimmun Rev. 2013;12:976–989. doi: 10.1016/j.autrev.2013.02.004. [DOI] [PubMed] [Google Scholar]
- 24.Fang F, Ni K, Cai Y, Shang J, Zhang X, Xiong C. Effect of vitamin D supplementation on polycystic ovary syndrome: A systematic review and meta-analysis of randomized controlled trials. Complement Ther Clin Pract. 2017;26:53–60. doi: 10.1016/j.ctcp.2016.11.008. [DOI] [PubMed] [Google Scholar]
- 25.Jafari-Sfidvajani S, Ahangari R, Hozoori M, Mozaffari-Khosravi H, Fallahzadeh H, Nadjarzadeh A. The effect of vitamin D supplementation in combination with low-calorie diet on anthropometric indices and androgen hormones in women with polycystic ovary syndrome: A double-blind, randomized, placebo-controlled trial. J Endocrinol Invest. 2018;41:597–607. doi: 10.1007/s40618-017-0785-9. [DOI] [PubMed] [Google Scholar]
- 26.Seyyed Abootorabi M, Ayremlou P, Behroozi-Lak T, Nourisaeidlou S. The effect of vitamin D supplementation on insulin resistance, visceral fat and adiponectin in vitamin D deficient women with polycystic ovary syndrome: A randomized placebo-controlled trial. Gynecol Endocrinol. 2018;34:489–494. doi: 10.1080/09513590.2017.1418311. [DOI] [PubMed] [Google Scholar]
- 27.Maktabi M, Chamani M, Asemi Z. The effects of vitamin D supplementation on metabolic status of patients with polycystic ovary syndrome: A randomized, double-blind, placebo-controlled trial. Horm Metab Res. 2017;49:493–498. doi: 10.1055/s-0043-107242. [DOI] [PubMed] [Google Scholar]
- 28.Ardabili HR, Gargari BP, Farzadi L. Vitamin D supplementation has no effect on insulin resistance assessment in women with polycystic ovary syndrome and vitamin D deficiency. Nutr Res. 2012;32:195–201. doi: 10.1016/j.nutres.2012.02.001. [DOI] [PubMed] [Google Scholar]
- 29.Raja-Khan N, Shah J, Stetter CM, Lott ME, Kunselman AR, Dodson WC, Legro RS. High-dose vitamin D supplementation and measures of insulin sensitivity in polycystic ovary syndrome: A randomized, controlled pilot trial. Fertil Steril. 2014;101:1740–1746. doi: 10.1016/j.fertnstert.2014.02.021. [DOI] [PMC free article] [PubMed] [Google Scholar]
- 30.Garg G, Kachhawa G, Ramot R, Khadgawat R, Tandon N, Sreenivas V, Kriplani A, Gupta N. Effect of vitamin D supplementation on insulin kinetics and cardiovascular risk factors in polycystic ovarian syndrome: A pilot study. Endocr Connect. 2015;4:108–116. doi: 10.1530/EC-15-0001. [DOI] [PMC free article] [PubMed] [Google Scholar]
- 31.Dastorani M, Aghadavod E, Mirhosseini N, Foroozanfard F, Zadeh Modarres S, Amiri Siavashani M, Asemi Z. The effects of vitamin D supplementation on metabolic profiles and gene expression of insulin and lipid metabolism in infertile polycystic ovary syndrome candidates for in vitro fertilization. Reprod Biol Endocrinol. 2018;16(94) doi: 10.1186/s12958-018-0413-3. [DOI] [PMC free article] [PubMed] [Google Scholar]
- 32.Irani M, Seifer DB, Grazi RV, Julka N, Bhatt D, Kalgi B, Irani S, Tal O, Lambert-Messerlian G, Tal R. Vitamin D supplementation decreases TGF-β1 bioavailability in PCOS: A randomized placebo-controlled trial. J Clin Endocrinol Metab. 2015;100:4307–4314. doi: 10.1210/jc.2015-2580. [DOI] [PubMed] [Google Scholar]
- 33.Foroozanfard F, Jamilian M, Bahmani F, Talaee R, Talaee N, Hashemi T, Nasri K, Asemi Z, Esmaillzadeh A. Calcium plus vitamin D supplementation influences biomarkers of inflammation and oxidative stress in overweight and vitamin D-deficient women with polycystic ovary syndrome: A randomized double-blind placebo-controlled clinical trial. Clin Endocrinol (Oxf) 2015;83:888–894. doi: 10.1111/cen.12840. [DOI] [PubMed] [Google Scholar]
- 34.Bonakdaran S, Mazloom Khorasani Z, Davachi B, Mazloom Khorasani J. The effects of calcitriol on improvement of insulin resistance, ovulation and comparison with metformin therapy in PCOS patients: A randomized placebo-controlled clinical trial. Iran J Reprod Med. 2012;10:465–472. [PMC free article] [PubMed] [Google Scholar]
Associated Data
This section collects any data citations, data availability statements, or supplementary materials included in this article.
Supplementary Materials
Data Availability Statement
The datasets used and/or analyzed during the current study are available from the corresponding author on reasonable request.