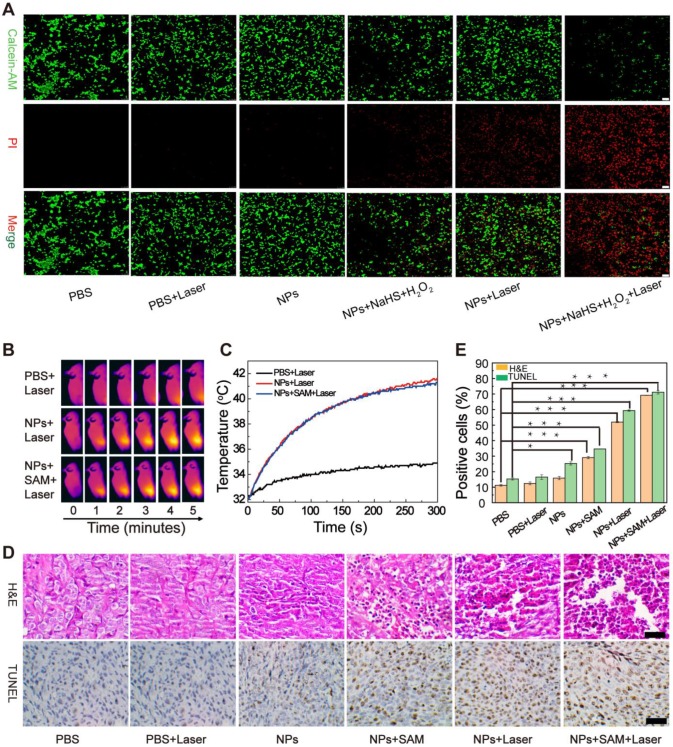
Figure 6.
Enhanced CDT therapy using the EA-Fe@BSA NPs. (A) The Calcein-AM/PI staining of HCT116 colon cancer cells under different conditions. Scale bar = 100 μm. (B) Thermal imaging of HCT116 tumor bearing mice injected with PBS, EA-Fe@BSA NPs, or EA-Fe@BSA+SAM NPs under laser irradiation. (C) Corresponding temperature increase of the tumor site in (B). (D) H&E (top) and TUNEL (bottom) staining of tumor sections from various groups of mice (B1: PBS, B2: PBS + laser, B3: NPs, B4: NPs + SAM, B5: NPs + laser, and B6: NPs + SAM + laser). Scale bar = 50 μm. (E) Proportion of necrosis area and TUNEL-positive cells for the different groups (n = 5, ***P < 0.001, *P < 0.05).

