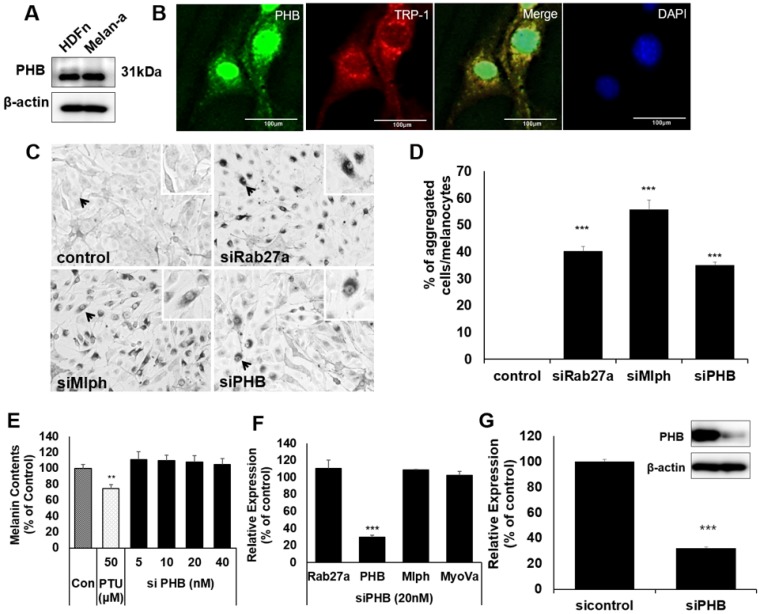
Figure 1.
A IB analysis for PHB in Melan-a cells compared with normal human dermal fibroblast (HDFn). B Melan-a cells were stained with DAPI (blue) for nuclei, FITC (green) for PHB and PE (red) for TRP-1. PHB co-localized with TRP-1 (yellow) is shown. C Representative cell images transfected with Rab27a, Mlph, PHB of siRNAs. D Quantification of melanosome transport observed in the transfected cells. E Melanin contents derived from PHB-KD Melan-a cells. As indicated, cells were treated with PHB of siRNAs (20 nM) for 72h. **p < 0.01. F mRNA levels derived from PHB-KD Melan-a cells. ***p < 0.001. G Protein levels derived from PHB-KD Melan-a cells. ***p<0.001.

