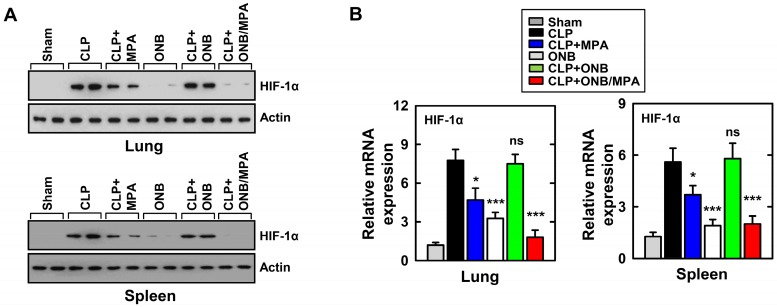
Figure 5.
Evaluation of HIF-1α expression in the in vivo model. (A) Results of western blotting for αHIF-1α in the lungs and spleen. Loading controls were used for immunoblotting with α-actin. The data are representative of three independent experiments with similar results. (B) Results of real-time polymerase chain reaction using lung and spleen samples were determined at 30 h in cecum ligation and puncture (CLP) mice treated with mycophenolic acid (MPA), oxygen nanobubbles (ONBs), or ONB/MPA (n=15 mice per group). Significant differences (*p < 0.01; ***p < 0.001) compared with CLP only.

