

Abstract
IL-12 and IL-18 synergize to promote TH1 responses and have been implicated as accelerators of autoimmune pathogenesis in type 1 diabetes (T1D). We investigated the influence of these cytokines on immune cells involved in human T1D progression: natural killer (NK) cells, regulatory T cells (Tregs), and cytotoxic T lymphocytes (CTL). NK cells from T1D patients exhibited higher surface CD226 versus controls and lower CD25 compared to first-degree relatives and controls. Changes in NK cell phenotype towards terminal differentiation were associated with cytomegalovirus (CMV) seropositivity, while possession of IL18RAP, IFIH1, and IL2RA T1D-risk variants impacted NK cell activation as evaluated by immuno-expression quantitative trait loci (eQTL) analyses. IL-12 and IL-18 stimulated NK cells from healthy donors exhibited enhanced specific killing of myelogenous K562 target cells. Moreover, activated NK cell increased expression of NKG2A, NKG2D, CD226, TIGIT and CD25, which enabled competition for IL-2 upon co-culture with Tregs, resulting in Treg downregulation of FOXP3, production of IFNγ, and loss of suppressive function. We generated islet-autoreactive CTL “avatars”, which upon exposure to IL-12 and IL-18, upregulated IFNγ and Granzyme-B leading to increased lymphocytotoxicity of a human β-cell line in vitro. These results support a model for T1D pathogenesis wherein IL-12 and IL-18 synergistically enhance CTL and NK cell cytotoxic activity and disrupt immunoregulation by Tregs.
Keywords: IL-12, IL-18, Type 1 Diabetes, Regulatory T cells, NK cells, Immunoregulation
Graphical Abstract
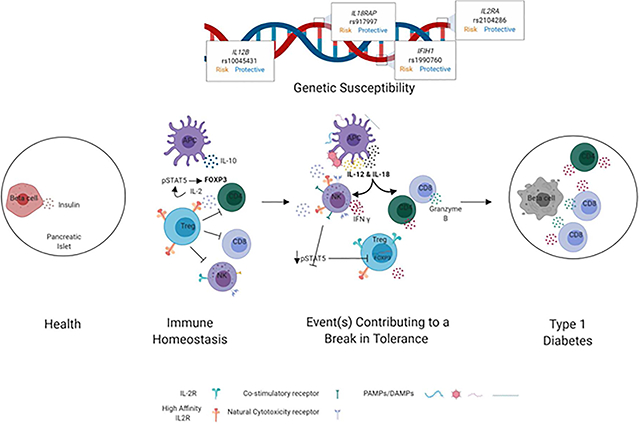
Working Model Summarizing the Hypothesized Contributions of Elevated IL-12 and IL-18 Levels Toward Failure in Immunoregulation and T1D Pathogenesis. In immune homeostasis (left), regulatory T cells (Treg) suppress activation and function of CD8+T cells, CD4+T cells and NK cells via various mechanisms including competition for IL-2. In settings of increased genetic risk for T1D, exposure to some environmental trigger(s) compound genetic defects to induce a break in tolerance (right), during which time IL-12 and IL-18 levels are elevated and NK cells upregulate CD25. This allows for direct competition with Tregs for IL-2, resulting in decreased Treg IL-2 signaling, STAT5 phosphorylation (pSTAT5), and FOXP3 expression, ultimately abrogating suppression. We hypothesize that this, together with enhanced production of cytokines and cytolytic proteins by CD4+conventional T cells and CD8+cytotoxic T cells, leads to augmented lysis of β-cells (right).
1. INTRODUCTION
IL-12 and IL-18 synergize to induce IFNγ production by T cells and natural killer (NK) cells1 and are critical to T cell and NK cytotoxic function in response to infections2,3. In excess, these cytokines can lead to immune dysregulation (reviewed in4,5). As such, IL-12 and IL-18 have been implicated as potential contributors to the pathogenesis of multiple autoimmune diseases, including type 1 diabetes (T1D), where both are elevated in the serum of patients compared to healthy controls6 and positively correlated with glycated hemoglobin A1c (HbA1c) levels7–9. A number of single nucleotide polymorphisms (SNPs) associated with candidate genes throughout the IL-12 signaling pathways confer risk for T1D. These include the p35 and p40 subunits of IL-1210 (IL12A, rs6441286, OR=1.24 and IL12B, rs10045431, OR=1.11, respectively), the IL-12 receptor β chain (IL12RB2, rs6679356, OR=1.02)11, as well as proximal (TYK2, rs2304256, OR=0.86) and distal mediators of IL-12 signaling (STAT4, rs7574865, OR=1.13)12,13. Previously we reported that the NK cell population within peripheral blood mononuclear cells (PBMCs) stimulated with IL-12 and IL-18 exhibited an increase in IFNγ production that was associated with the IL-18 receptor accessory protein (IL18RAP, rs917997, OR=1.19)1. Though the genetic association of IL18RAP with T1D is conflicting in the literature12,14–16, these results support a role for IL-12 and IL-18 as potential drivers of TH1 skewing and NK cell IFNγ production in subjects carrying the IL18RAP T1D risk allele1.
NK cells serve a primary role in host defense against viral infections, yet conflicting reports exist regarding the role for NK cells in T1D pathogenesis. NK cells were shown to be altered phenotypically and functionally in the NOD mouse model of T1D as well as in humans with the disease17,18. Specifically, blocking the activating NK cell receptors, NKp4619 or NKG2D20, has been shown to prevent the development of diabetes in NOD mice, while NK cell depletion in NOD.NK1.1 mice did not affect the incidence or timing of spontaneous T1D onset21. NK cells from human T1D patients have been shown to have lower expression of activating natural cytotoxicity receptors (NCRs) on their surface as well as lower IFNγ (IFNG) and perforin (PRF1) gene expression22–24. NK cells from patients with T1D were also reported to respond inadequately to IL-2 plus IL-15 stimulation and exhibit impaired NKG2D signaling and function25. One hypothesized mechanism through which NK cells may promote T1D involves competition with regulatory T cells (Tregs) for IL-2 binding by activated NK cells that express CD25 (IL-2Rα, the high-affinity component of the IL-2 receptor)26. With this, increased Treg frequency in vivo has been shown to correlate with deficits in NK cell cytotoxicity, likely the result of contact mediated TGF-β dependent interactions27 and/or IL-2 deprivation28, suggesting NK cell and Treg frequency and function may be counterbalanced by IL-2 bioavailability.
Herein, we investigated the mechanisms governing a potential functional relationship linking NK cell, cytotoxic T lymphocyte (CTL), and Treg activity in the context of human T1D. Specifically, we asked whether modulation of these cell subsets by IL-12 in combination with IL-18, as well as latent cytomegalovirus (CMV) infection, might support our working hypothesis that genetic susceptibility coupled with an unknown event (e.g., viral infection(s), β-cell stress) may induce an inflammatory milieu involving IL-12 and IL-18-mediated TH1 skewing, activation of NK cells, and impairment of Treg function. Taken together, these phenomena might contribute toward the break in immune tolerance that initiates or potentiates T1D pathogenesis (Graphical Abstract).
2. MATERIALS AND METHODS
2.1. Sample Collection
Whole peripheral blood from T1D subjects (median age 16.3 years, range 7.8–64.4), non-diabetic autoantibody negative first-degree relatives of a T1D patient (median age 22.0 years, range 4.6–67.2), and unrelated non-autoimmune control donors (median age 13.8 years, range 5.0–42.0) were collected in sodium-heparinized vacutainer tubes (BD Biosciences) following informed consent in accordance with an Institutional Review Board approved protocol at the University of Florida (UF IRB# 201400703). PBMCs were separated by density gradient centrifugation. For some experiments, leukopak-derived PBMCs were purchased from Life South Blood Centers (median age 29.4 years, range 20.5–46.7).
2.2. IL-12 and IL-18 PBMC Stimulation
Cryopreserved PBMCs from IRB consented blood donors were thawed at 37°C, washed twice with complete RPMI media [cRPMI; RPMI 1640 medium (Cellgro) supplemented with 5mM HEPES, 2mM Glutamax (Invitrogen), 50 μg/mL Penicillin (Invitrogen), 50 μg/mL Streptomycin (Invitrogen), 50 M 2-mercaptoethanol (Sigma-Aldrich), and 10% FBS (Atlanta Biologicals)], and plated at 2.5×10⁵ cells per well in cRPMI. Cells were activated with soluble anti-CD3 (2 μg/mL) and soluble anti-CD28 (1 μg/mL), and treated with IL-12 (1 ng/mL) and/or IL-18 (10 ng/mL) (R&D Systems) for 72h as described previously1. GolgiStop (4 μL/6 mL culture; BD Biosciences) was added four hours prior to staining for flow cytometric analysis. Cells were first stained for the following surface markers: CD4–Pacific Blue (RPA-T4; eBioscience), TIGIT–APC or –PerCP-eFluor710 (MBSA43; eBioscience), CD226–PE (11A8; BD Biosciences), CD8–APC-Cy7 (SK1; BD Biosciences), and CD25–APC or –AlexaFluor (AF)-488 (BC96; BioLegend). For intracellular staining, cells were fixed, permeabilized, and stained for IFN-γ–PE-Cy7 (4S.B3; BioLegend), Helios–PE, –Pacific Blue, or –AF647 (22F6; BioLegend), and FOXP3–AF488 or –PE (206D; BioLegend) using the FOXP3 Fix/Perm staining kit (BioLegend) according to manufacturer’s protocol. Samples were collected on a BD LSRFortessa and analyzed using FlowJo software.
2.3. βlox5 Cell Culture
The HLA-A*02:01 βlox5 cell line was a generous gift from Dr. Fred Levine29. Cells were cultured in a basal media of low glucose (1g/L) Dulbecco’s Modified Eagle’s Medium supplemented with 10% FBS, 1% MEM non-essential amino acids, 1% penicillin-streptomycin, 0.02% BSA, and 15mM HEPES. Cells were passaged to maintain 40–90% confluency, and once passage 20 was achieved, the cells were discarded.
2.4. CTL Avatars
Autoreactive CD8+ T cell avatars expressing the Glucose-6-Phosphatase Catalytic Subunit 2 (G6PC2)-reactive TCR, clone 32, were produced as previously described30,31. Cryopreserved CTL avatars were thawed and rested in cRPMI with IL-7 (5 ng/mL) for 48 hours. CTLs transfected with lentivirus encoding enhanced green fluorescent protein (eGFP) alone were used as a negative control.
2.5. Cell Mediated Lympholysis (CML) Assay
On day −1, βlox5 cells were labeled with CellTrace Violet (CTV, Invitrogen) and plated in 48 well plates (30,000 cells/well). On day 0, CTLs were gently added on top of the target cells at multiple effector to target ratios (10:1, 5:1, 1:1, and 0:1) and stimulated with IL-12 (1 ng/mL) and/or IL-18 (10 ng/mL) in duplicate for 16 hours. The media and CTLs were collected into FACS tubes. βlox5 cells were lifted off the plate using warm 1× TrypLE (Life Technologies) after 5 minutes at 37°C and combined in respective FACS tubes. Cells were stained with a Viability Mastermix [AF647 Annexin V (BioLegend) and propidium iodide (PI; Invitrogen) in Annexin V binding buffer (BioLegend)] according to manufacturer’s instruction. Samples were collected on a BD LSRFortessa and analyzed using FlowJo software. The percentage of Annexin V+PI+ βlox5 cells was determined, and the percent specific lysis was calculated by subtracting background lysis detected from wells containing 0:1 effector to target cell ratio.
2.6. Visual CML (vCML) Assay
As described previously32,33, βlox5 cells were plated in an 8 well glass chamber slide at a density of 1×10⁴ cells/well on day −1. On day 0, βlox5 cells were stained with 25nM of Tetramethylrhodamine, methyl ester (TMRM) in phenol red free cRPMI for 20 minutes at 37°C. After 20 minutes, the media was replaced with 5nM TMRM phenol red free cRPMI to maintain stain during the assay. Rested CTL avatars were co-cultured with the βlox5 cells at a 30:1 ratio and subsequently imaged on a Carl Zeiss 710 LSM confocal microscope maintained at 37°C and 5% CO2. Still images were taken every 5 minutes for 18 hours and combined to create a movie using Zen Blue 2.3 software.
2.7. Fluorescence-Activated Cell Sorting (FACS)
Prior to FACS purification, bulk NK, CD4, or CD8 T cells were enriched from PBMCs by negative selection using RosetteSep™ kits (Stemcell Technologies) per the manufacturer’s instructions. Enriched cells were stained with fluorescently labeled antibodies, resuspended at 2.0×10⁷ cells/mL, and sorted on a Bio-Rad S3e (Bio-Rad) or BD FACS Aria III Cell Sorter (BD Biosciences). Specifically, bulk CD8+ T cells were stained for CD8–BB515 (RPA-T8; BD Biosciences), CD45RO–PerCPeF710 (UCHL1; eBioscience) and CD45RA–PE (HI100; BioLegend), and CD8+CD45RA+CD45RO− naive CD8+ T cells were sorted as previously described30. Bulk NK cells were stained for CD3–FITC (HIT3a; BioLegend) and CD56–PE (HCD56; BD Biosciences), and CD3− CD56+/bright NK cells were sorted. Bulk CD4+ T cells were stained for CD4–Pacific Blue (RPA-T4; eBioscience), CD25–APC (BC96; BioLegend) and CD127–PE (A019D5; BioLegend), and CD4+CD25hiCD127lo Tregs and CD4+CD127+ Tconv were sorted. Post-sort purities were typically greater than 98.0% (median 99.2%, range 98.0%−99.8%).
2.8. In Vitro NK Cell Functional Assay
The HLA-null K562 human chronic myelogenous leukemia cell line was purchased from ATCC (CCL-234) and cultured in cRPMI. Media was added every two days to maintain cell concentrations at 0.25×10⁶ − 1.0×10⁶ cells/mL. Cryopreserved PBMCs were thawed and pre-treated with IL-12 (1 ng/mL) and/or IL-18 (10 ng/mL) for 24 hours. K562 cells were labeled with Carboxyfluorescein succinimidyl ester (CFSE) according to the manufacturer’s instructions and then, co-cultured in a 96-well round bottom plate with 10:1, 5:1, and 2.5:1 PBMC effector to K562 target ratios. After 2.5 hours of incubation at 37°C and 5% CO2, cells were stained with Viability Mastermix. For effector phenotyping, cells were stained for surface [CD8-BV605 (RPA-T8), NKG2D-BV711 (1D11), and PD-1-AF647 (EH12.2H7) (all Biolegend)] and intracellular markers [Perforin-Pacific Blue (dG9; Biolegend), IFN-γ-PE-Cy7 (B27; BD Biosciences), Granzyme B-PE (GB11; BD Biosciences)] as described in section 2.2. Samples were collected on a BD Accuri C6 cytometer and analyzed using FlowJo software. Percent specific lysis was calculated by subtracting background lysis (Annexin V+PI+) in wells containing 0:1 PBMC to K562 cells from lysis in wells containing effector cells.
2.9. IL-12 and IL-18 NK Cell Stimulation
Sorted NK cells were plated at a density of 2.5×10⁵ cells/mL in cRPMI in a 24 well plate, and stimulated for 24 hours with IL-2 (100 U/mL; NCI), IL-12 (1 ng/mL), and/or IL-18 (10 ng/mL). Cells were stained with antibodies against the following markers: CD56-BV605 (HCD56; BioLegend), NKG2D-BV711 (1D11; BioLegend), CD226-PE (11A8; BioLegend), CD16-FITC (3GB; Beckman Coulter), CD25-BV421 (M-A251; BD Biosciences), CD57-APC-Vio770 (TB03; Miltenyi Biotec), NKG2A-PE-Vio770 (REA110; Miltenyi Biotec) and TIGIT-APC (MBSA43; eBioscience), as well as for fluorescence minus one (FMO) controls. Data were collected on a BD LSRFortessa or an Accuri C6, and analyzed using FlowJo software V9 (TreeStar Inc).
2.10. Immunophenotyping by Flow Cytometry
400 μL of whole blood was directly stained for CD3-PerCP (UCHT1; Biolegend), CD16-FITC (3GB; Beckman Coulter), CD25-BV421 (M-A251; BD Biosciences), CD56-BV605 (HCD56; BioLegend), CD57-APC-Vio770 (TB03; Miltenyi Biotec), NKG2A-PE-Vio770 (REA110; Miltenyi Biotec), TIGIT-APC (MBSA43; eBioscience), and CD226-PE (11A8; BioLegend) for 30 minutes at room temperature. Red blood cells were lysed using 1-step Fix/Lyse Solution (eBioscience), and cells were washed with FACS buffer. Data were collected on a BD LSRFortessa and analyzed using FlowJo software.
2.11. CMV Serostatus
Sera were assessed for IgG antibodies against CMV by ELISA according to the manufacturer’s protocol (Zeus, 9Z9501G), and assays were read on a Spectramax M5 (Molecular Devices) with softmax v7. Data were analyzed in R and visualized with the ggplot2 package34.
2.12. RNA and DNA Isolation
For RNA and DNA isolation, 5.×105 cells were snap frozen in liquid nitrogen and later processed with the AllPrep DNA/RNA Mini Kit (Qiagen). The quality and quantity of RNA was determined on a Bioanalyzer 2100 (Agilent Technologies).
2.13. Genotyping
Donors were genotyped using a custom SNP array (Affymetrix) as previously described35 or by TaqMan real-time PCR Assays (ThermoFisher), according to manufacturer instructions. Data were visualized by the R package ggplot234.
2.14. Treg Transcriptional Profiling
Tregs were cultured as previously described36 in the presence of IL-12 (1 ng/mL) and/or IL-18 (10 ng/mL) or under normal media conditions supplemented with IL-2 (300U/mL). On day 14, cells were collected and RNA isolated. RNA was directly quantified using the nCounter® Human Immunology GX Panel v1 (NanoString Technologies) according to the manufacturer’s protocol. Using the nSolver Analysis Software V2 (NanoString Technologies), counts were first normalized to the geometric mean of the positive control spiked into the assay, then normalized to five reference genes (ABCF1, SDHA, SELL, TAPBP, TUBB). nCounter Advanced Analysis 2.0 (NanoString Technologies) was used to determine the differential expression between cytokine skewing conditions using a loglinear regression model in R 3.3.2. Heatmaps were generated with the online tool Morpheus (https://software.broadinstitute.org/morpheus) and hierarchically clustered with one minus Pearson correlation between samples.
2.15. In Vitro Suppression Assays
Expanded Tregs were thawed and labeled with CTV (Life Technologies), while autologous PBMCs were stained with CFSE (Life Technologies). Tregs were plated at 5×10⁴ cells/well (1:0 condition) and in two-fold serial dilutions. 5×10⁴ autologous PBMCs were added to each well for final Treg:PBMC ratios of 1:0, 1:1, 1:2, 1:4. 1:8, 1:16, 1:32, and 0:1. Cells were activated with soluble anti-human CD3 (HIT3a, 2 μg/mL) and soluble anti-human CD28 (CD28.2, 1 μg/mL; BD Biosciences) for 96 hours. Triplicate cultures were pooled; stained for CD4, CD8, CD56, and CD25 as described above in section 2.8, fixed with BD CytofixTM (BD Bioscience) according to the manufacturer’s protocol, and acquired on a BD LSRFortessa. Division index (DI) was calculated for Tregs and responder T cells (Tresp) using FlowJo proliferation analysis. Percent suppression was calculated as: % suppression = 1−[(DI of Tresp in co-culture)/(DI of Tresp alone)]*100.
2.16. IL-2 Competition Assay
On day −1, NK cells and Tregs from the same donor were sorted as described above in section 2.7. Tregs were rested in cRPMI overnight without stimulation or cytokine treatment. NK cells were activated with IL-12 (1 ng/mL) and IL-18 (1 ng/mL) overnight. On day 0, Tregs and activated NK cells were washed and co-cultured in cRPMI at 1:0, 1:1, 1:10 and 0:1 Treg to NK ratios with 50 U/mL of IL-2 at 37°C for 15 minutes. Cells were fixed with 3% formaldehyde (Polysciences, Inc.) for 5 minutes at 37°C followed by 5 minutes on ice. Cells were then transferred to FACS tubes, washed, and permeabilized by resuspending in 500 μL ice-cold 90% methanol. Cells were stained with antibodies against pSTAT5-PE (pY694, BD Biosciences), CD56-BV605 (HCD56; BioLegend), CD4-Pacific Blue (RPA-T4; BioLegend), and CD25-APC (BC96; BioLegend) for 30 minutes on ice. Samples were collected on a BD LSRFortessa and analyzed using FlowJo software.
2.17. Statistical Analysis
Graphing and statistics were performed using GraphPad Prism v7 (GraphPad Software) and the R ggplot2 package34. eQTL analysis was performed using the MatrixEQTL R package37 as follows. Whole blood flow cytometry NK phenotype data was first quantile normalized; then, associations between 55 SNPs and 33 NK phenotypes were tested while controlling for the covariates: sex, age, disease status, and CMV status. Statistical tests including one-way ANOVA with Bonferroni correction, Friedman paired analysis, Kruskal Wallis with Dunn’s multiple comparison, Spearman correlation, and two-way ANOVA were used as indicated in the text and figure legends. P-values lower than 0.05 were considered significant, with the exception of eQTL data in which P-values lower than 0.001 were considered significant.
3. RESULTS
3.1. T1D Peripheral Blood NK Cells Exhibit Elevated CD226 But Reduced CD25
We assessed peripheral blood NK cell phenotype by flow cytometry from a cross-sectional cohort of 55 patients with established T1D (>3 months duration), 39 first-degree relatives of a T1D patient that were without a diagnosis of T1D and also negative for T1D-relevant autoantibodies (first-degree relatives), and 52 control subjects without a diagnosis of T1D and negative for T1D-relevant autoantibodies (controls). First-degree relatives were slightly, but significantly older than controls (p=0.02; Table S1).
In contrast to prior reports suggesting NK cell deficiencies in T1D25, we observed no significant differences across clinical status in frequencies of total NK cells, immature CD56bright NK cells, or the terminally differentiated “memory like” adaptive CD57+ NK cell subset (Figure 1A–C). Only in patients with established T1D did we find a significant negative correlation between age and the frequency of CD56bright NK cells (r=−0.29, p=0.029; Figure 1D), which have been shown to function in a regulatory role through production of suppressive cytokines such as IL-1038. Additionally, we observed a significant correlation between the frequency of CD57+ NK cells and age in controls (r=0.56, p<0.0001) that was not seen in T1D patients or relatives (Figure 1E). Total NK cells from T1D patients exhibited increased mean fluorescence intensity (gMFI) of the co-stimulatory receptor CD226 as compared to controls (1.24 fold, p=0.002; Figures 1F and S1A), while expression of the co-inhibitory T cell Immunoreceptor with Ig and ITIM domains (TIGIT) was unchanged resulting in increased CD226:TIGIT ratios on NK cells from T1D donors (1.32 fold, p=0.0039), with the same trend evident in their relatives (1.19 fold, p=0.057; Figures 1G and S1B). Together, these data suggest a more inflammatory NK cell phenotype in T1D39. Conversely, in patients with T1D and their relatives, we observed decreased CD25 gMFI on total NK cells versus controls (0.73 fold, p=0.0001 and 0.74 fold, p=0.0009, respectively; Figure 1H and S1C) as well as on the CD56bright subset (0.66 fold, p=0.012 and 0.69 fold, p=0.015, respectively; Figure 1I and S1D), in agreement with previous reports23. This phenotype is likely influenced by NK cell differentiation state40 and genotype at T1D risk loci, namely IL2RA41,42.
Figure 1: T1D-related Alterations in NK Cell Phenotypes.
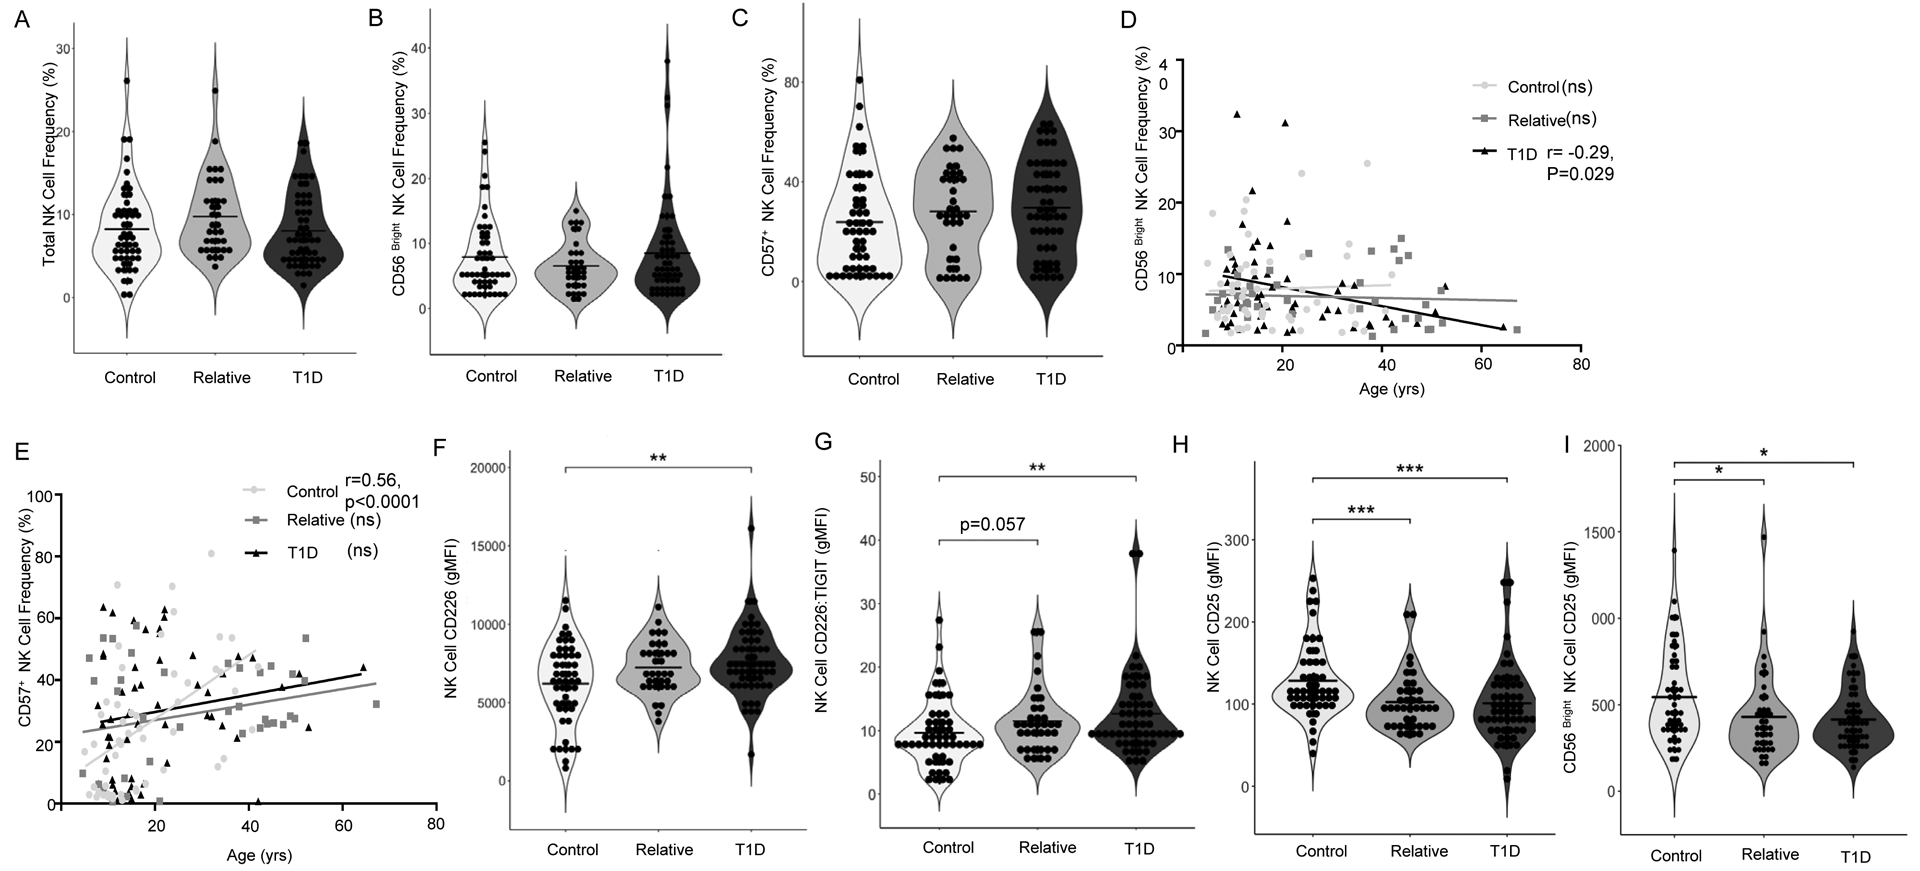
NK phenotype was assessed from peripheral blood of patients with T1D (N=55), first-degree relatives (N=39), and control subjects (N=52). There were no significant differences in (A) Total NK cell frequency, (B) CD56bright NK cell frequency, or (C) CD57+ NK cell frequency across clinical status. (D) The CD56bright subset decreased significantly with patient age in the T1D group (r=−0.29, p=0.029), while (E) CD57+ NK cells increased significantly with age in control subjects but not type 1 diabetes or relatives (r=0.56, p<0.0001). Compared to controls, T1D subjects exhibited significantly higher (F) CD226 gMFI and (G) CD226:TIGIT gMFI ratio. Compared to controls, T1D patients and first-degree relatives had significantly lower (H) NK cell CD25 gMFI and (I) CD56bright NK cell CD25 gMFI. Data were analyzed by Kruskal-Wallis with Dunn’s multiple comparison tests and Spearman r Correlation *p<0.05, **p<0.01, ***p<0.001.
3.2. CMV Infection Skews NK Cell Distribution Toward a Terminally Differentiated Phenotype
CMV affects over one-half of the general population in the United States and has been reported to contribute to immunological aging43. NK cells detect the CMV antigen UL16 in the context of UL16-binding proteins (ULBP16s) via NKG2D44. Given the documented immunomodulatory effects of CMV infection on NK cells45,46, we sought to assess the influence of latent CMV infection on NK cell phenotypes observed in our cohort. We segregated donors on the basis of CMV serostatus and confirmed previous reports showing significant increases in the frequencies of CD57+ (Figure 2A) and CD57+NKG2A− NK cells (Figures 2B and S2A–B) in CMV seropositive individuals43,47. Importantly, we found no significant differences in NK cell gMFI of costimulatory markers CD226 or TIGIT, nor the activation marker CD25 when subjects were grouped by CMV serostatus (Figure S2C–H), suggesting that phenotypic changes observed in NK cells from T1D donors (Figure 1) were not driven by CMV latency. However, we did note decreased CD16 expression on NK cells from CMV seropositive donors (Figure 2C and S2I), perhaps indicating reduced antibody dependent cell-mediated cytotoxic capability48. The CMV+ and CMV− groups studied here had nearly inverse proportions of T1D patients and controls (30.6% of seropositive subjects with T1D, 46.9% controls, versus 41.2% of seronegative subjects with T1D, 30% controls, p<0.05; Figure 2D). Within our cohort, only controls exhibited a significant difference in age with CMV seropositive individuals being older than seronegative (Table S1). There are known socioeconomic, geographic and race related risk factors for CMV prevalence49. While our cohort is well-matched for race/ethnicity (Table S1), socioeconomic status data are not available. These data support a need for additional studies utilizing longitudinally collected samples with associated clinical history documenting timing of CMV infection and T1D progression.
Figure 2: Impact of HCMV on NK Cell Phenotypes.
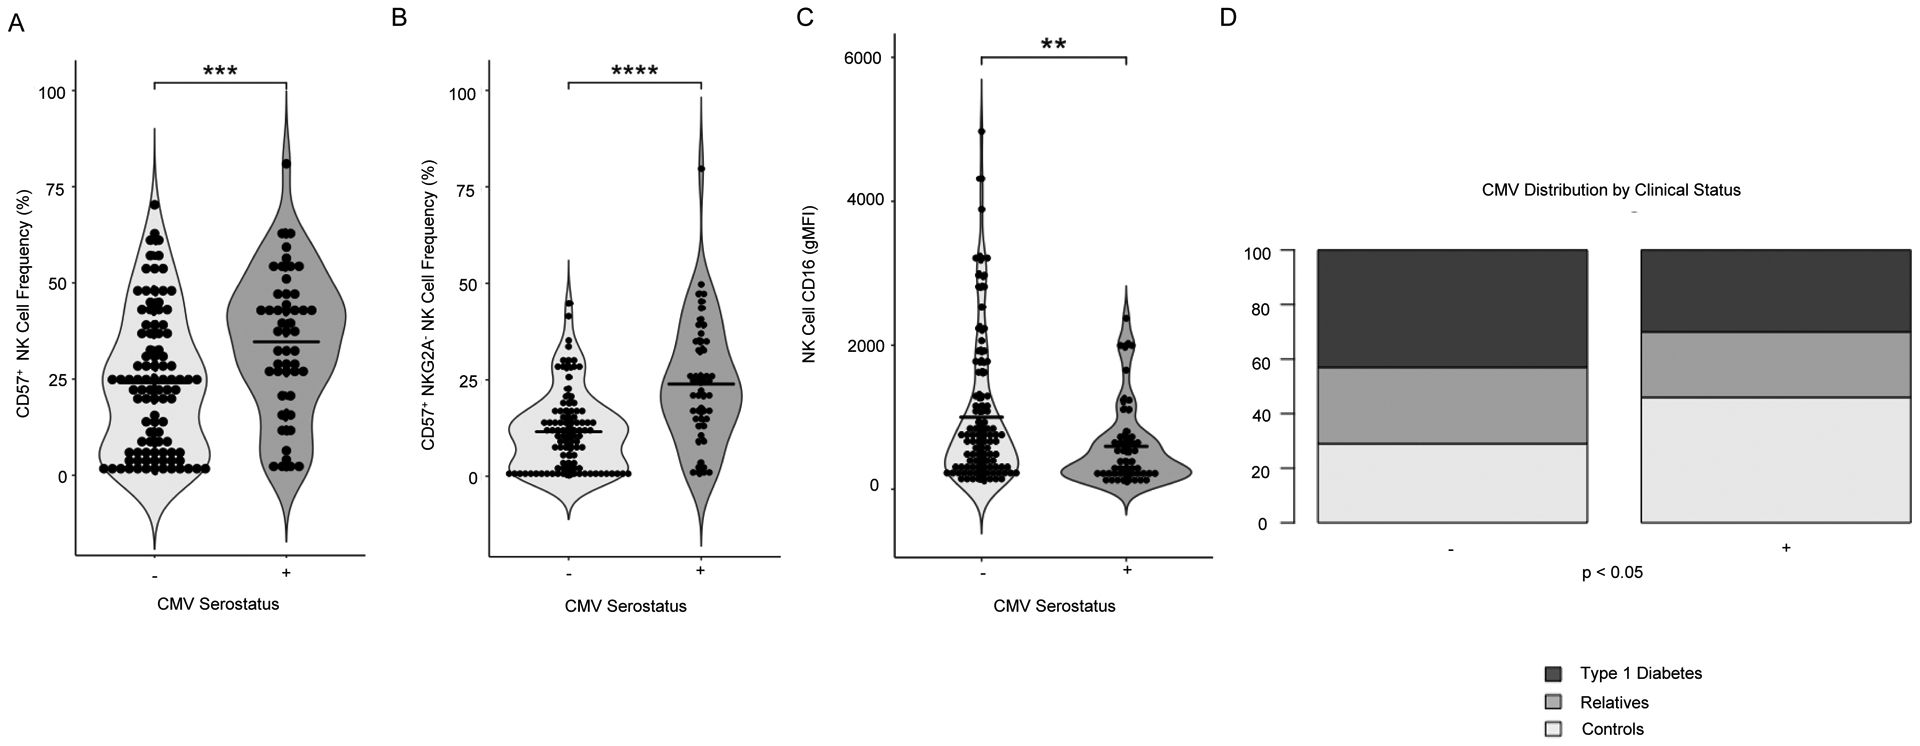
Individuals who tested seropositive by ELISA for Human Cytomegalovirus (CMV) IgG were compared to unaffected individuals. CMV+ individuals had a higher frequency of (A) CD57+ NK cells and (B) CD57+NKG2A− NK cells. (C) Grouping by CMV seropositivity results in a significant difference in NK cell CD16 gMFI. (D) The distribution of type 1 diabetes clinical status was significantly different in cohorts grouped by CMV serostatus (p=0.03). Statistics are the result of Mann-Whitney U test (A-C) and chi-square test (D), ***p<0.001, ****p<0.0001.
3.3. eQTL Analysis Links T1D Risk Genotypes with NK Cell Phenotypes
We genotyped all 146 donors in our cohort (Table S1) using a custom Affymetrix Array containing 55 SNPs associated with T1D susceptibility35. We then analyzed eQTLs to identify genetic variants at the 55 SNPs that might influence expression of one or more genes constituting 33 NK cell phenotypes while controlling for the covariates of sex, age, T1D disease status, and CMV serostatus. This resulted in over 1,800 comparisons with 30 having p-values<0.001. Subjects in our cohort segregated by clinical status when Linear Discriminant Analysis (LDA) was performed using these 30 eQTL associations as parameters (Figure 3A). rs917997 within IL18RAP is a synonymous variant associated with increased IFNγ production in response to stimulation with IL-12 and IL-18 in individuals carrying the T1D risk (CC) genotype1. We found the protective minor allele (T) at rs917997 to be associated with increased total NK cell frequency (Figure 3B). While this difference is statistically significant, we acknowledge that a change of 3% may or may not be biologically relevant. The non-synonymous T1D risk variant (T) at rs1990760 within IFIH1 is associated with increased expression of this gene50. Activation of IFIH1 by viral RNA induces expression of type 1 interferons and other pro-inflammatory cytokines, including IL-1251. We observed the T1D-susceptible, minor allele (T) at rs1990760 to be significantly associated with increased NK cell frequency and decreased NK cell CD25 gMFI (Figure 3C–D). Homozygous risk (TT) at rs2104286 within IL2RA resulted in increased NK cell CD25 gMFI (Figure 3E) and CD25+ NK cell frequency (Figure 3F), thereby supporting a potential role for this synonymous variant in driving NK cell competition for IL-2, in addition to its known contributions to IL-2 hyporesponsiveness in T cells through reduced phosphorylated STAT5 (pSTAT5) signaling52. A similar relationship has been reported in stimulated CD14+CD16+ monocytes, with individuals possessing the homozygous risk genotype at rs2104286 (IL2RA) exhibiting increased CD25 expression on this subset53. These data suggest that a functional genotype–phenotype relationship resulting in CD25 upregulation on NK cells, combined with an acute or chronic inflammatory milieu involving elevated IL-12 and IL-18 could plausibly allow for pathogenic NK cell-mediated exacerbation of immune dysregulation.
Figure 3: SNP Associated NK Cell Phenotypes.
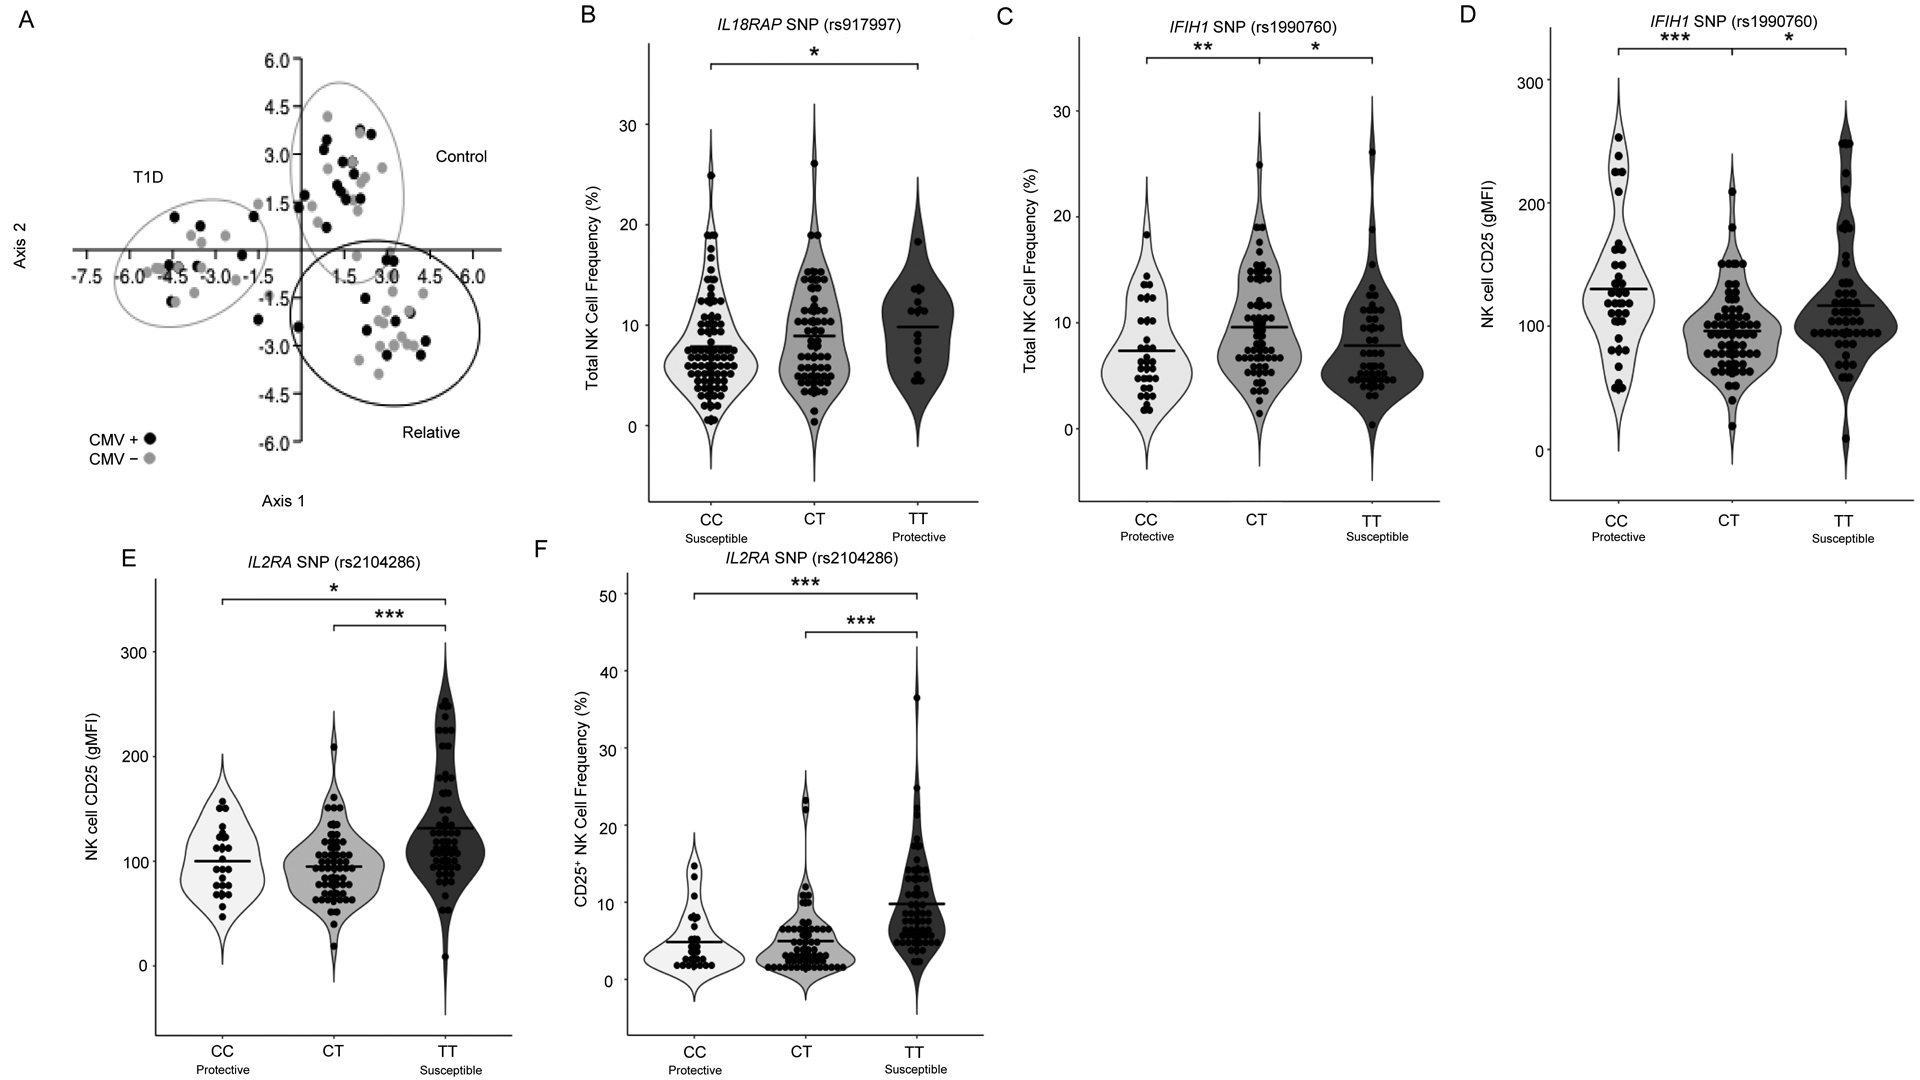
Individuals were genotyped for 55 SNPs using a custom Affymetrix array, segregated based on genotype (regardless of clinical status), and assessed for associations with NK phenotype. (A) Subjects in our cohort segregate by clinical status based on peripheral blood phenotyping and SNP genotyping data with LDA. Black data points indicate CMV seropositive subjects. Ellipses indicate 95% CI. Total NK cell frequency is significantly different across subjects grouped by IL18RAP (rs917997; risk = CC, protective = TT) (B) and (C) IFIH1 (rs1990760; risk = TT, protective = CC), while grouping by this SNP also results in significantly different NK cell CD25 gMFI (D). NK cell CD25 expression (gMFI) (E) and CD25+ NK cell frequency (F) was significantly different across subjects grouped by subjects grouped by IL2RA SNP (rs2104286; risk = TT, protective = CC). Statistics are the results of Kruskal-Wallis with Dunn’s multiple comparison tests *p<0.05, **p<0.01, ***p<0.001. LDA performed with PAST3 software.
3.4. Stimulation with IL-12 Plus IL-18 Promotes Leukocyte Activation and TH1 Skewing
We sorted and expanded Tregs from three healthy peripheral blood donors in the presence or absence of IL-12 and IL-18. Treg expression of IFNG, GZMB, GZMA, and IL18RAP were increased while FOXP3 was decreased under IL-12 plus IL-18 expansion conditions as compared to no treatment (Figure 4, Figure S3). To confirm these findings, PBMCs from 30 healthy control donors were stimulated for 72 hours with anti-CD3 and anti-CD28 monoclonal antibodies with the addition of IL-12, IL-18, or the combination and then analyzed by flow cytometry. CD4+FOXP3−Helios− Tconv, CD8+ T cells, CD4+CD25+FOXP3+Helios+ thymic Tregs (tTreg), and CD4+CD25+FOXP3+Helios− peripheral Tregs (pTreg) were gated (Figure 5A) and assessed for intracellular IFNγ (Figure 5B). As expected54, there was a strong induction of IFNγ, as measured by percent positive cells, in Tconv (Figure 5C) and CD8+ T cells (Figure S4A) in response to IL-12 plus IL-18 co-stimulation. Interestingly, pTreg IFNγ positivity (Figure 5D) and tTreg IFNγ gMFI (Figure 5E and S4B) were both significantly increased following IL-12 treatment. While IL-18 treatment alone significantly decreased only pTreg IFNγ production, the combination of IL-12 plus IL-18 synergistically enhanced IFNγ production by both pTregs and tTregs. With this, tTregs activated in the presence of IL-12 and IL-18 declined in number (Figure 5F) and appeared phenotypically impaired by way of reduced CD25 gMFI (Figure 5G and S4C).
Figure 4: IL-12 and IL-18 Induced Changes in Treg Gene Expression.
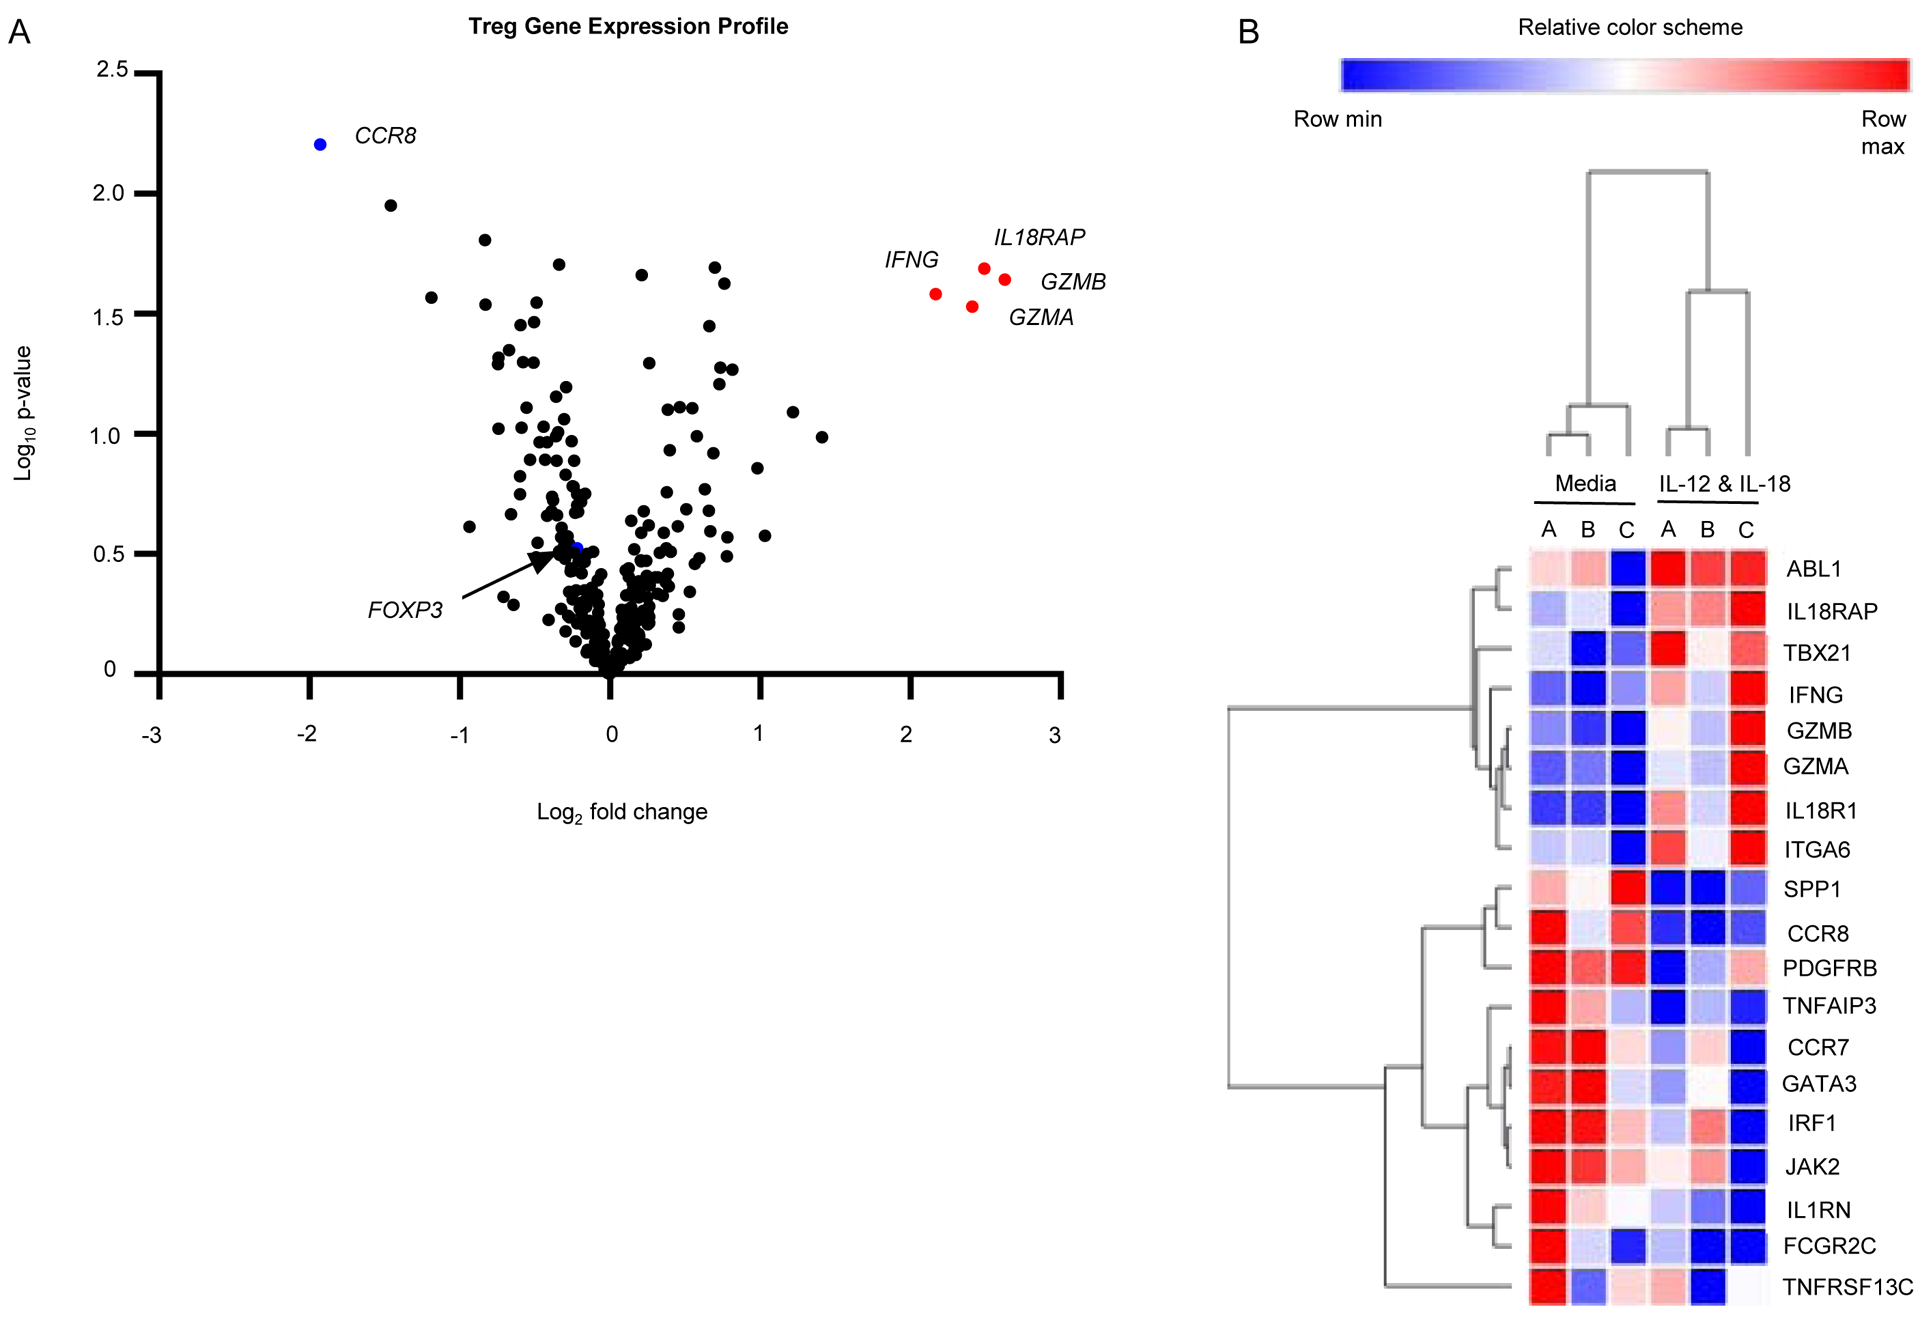
Tregs cultured under Th1 skewing conditions (IL-12 and IL-18) were analyzed using NanoString for differences in expression of immune related genes. The data is represented via (A) a volcano plot depicting log2 fold change in stimulated versus media control by log10 Normalized Expression. Data points for IFNγ (IFNG), IL-18 receptor accessory protein (IL18RAP), granzyme B (GZMB), and granzyme A (GZMA), C-C motif chemokine receptor 8 (CCR8) and FoxP3 (FOXP3) are labeled. Differentially expressed genes are also shown via (B) heatmap of log2 transformed normalized counts performed with hierarchical 1-pearson clustering. Differential expression analysis was performed with nCounter Advanced Analysis 2.0 and R version 3.3.2 and visualized with Morpheus (https://software.broadinstitute.org/morpheus).
Figure 5: The Lymphocyte Response to IL-12 and IL-18.
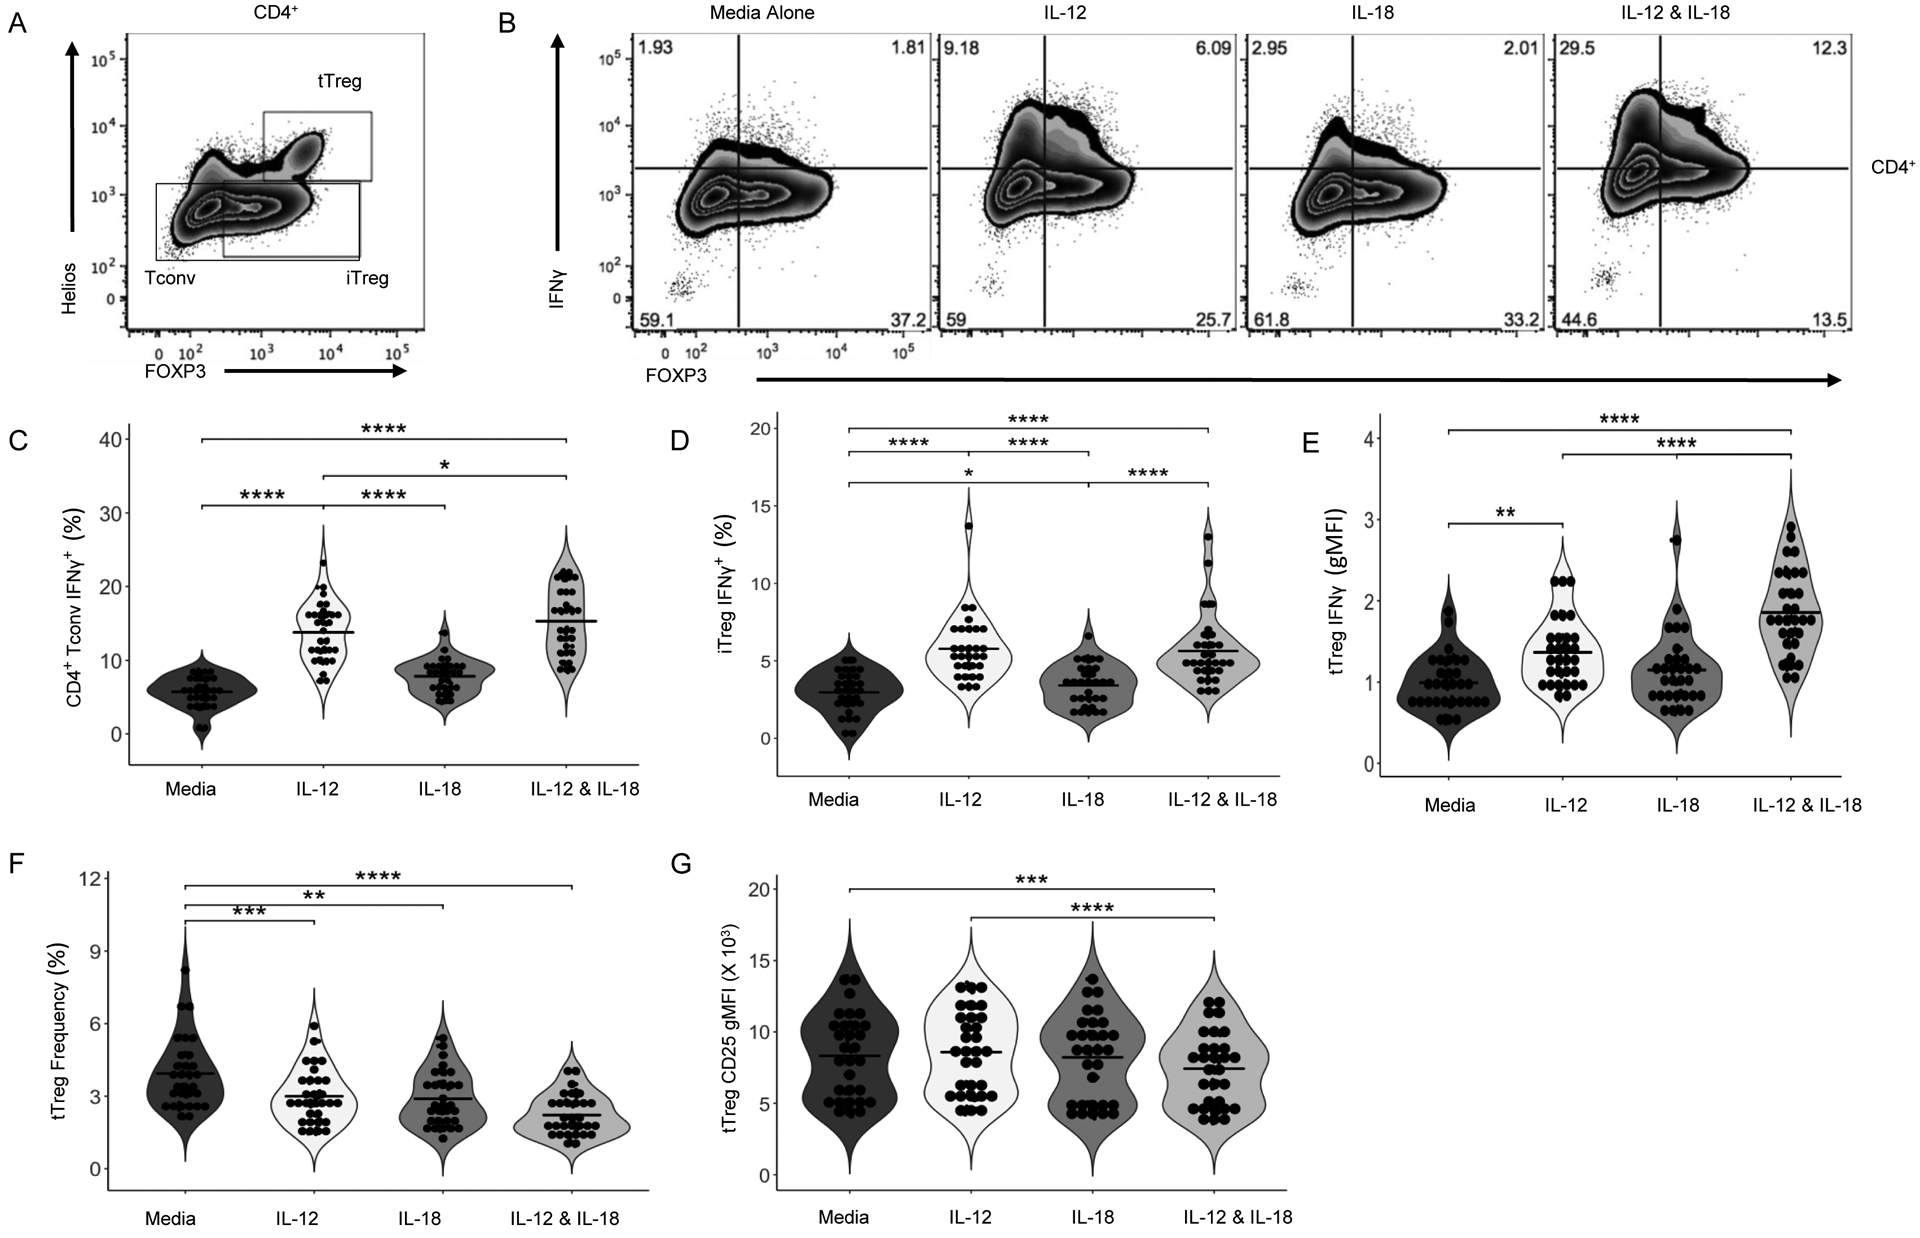
In order to validate our TH1 skewing results, PBMCs were activated with soluble anti-CD3/28 for 72 hours with and without IL-12 (1 ng/mL) and/or IL-18 (10 ng/mL). Cells were then stained for surface receptors, cytokines, and transcription factors and analyzed by flow cytometry. (A) Gating strategy for tTreg, iTreg, and Tconv. (B) Representative staining depicting the IL-12, IL-18, and IL-12 & IL-18 stimulated IFNγ response of FOXP3+ pTreg and FOXP3− Tconv cells. (C) IL-12 and IL-18 synergistically enhance CD4+ Tconv IFNγ and (D) pTreg IFNγ. Following IL-12 and IL-18 stimulation, (E) frequency of tTregs decreases and (F) tTreg CD25 gMFI decreases. Data are represented as box and 10–90 percentile whiskers (n=30). Statistics were performed using Prism v5 software and are the result of an ordinary one-way ANOVA with a Bonferroni multiple test correction (MTC), differential expression analysis was performed with nCounter Advanced Analysis 2.0 and R version 3.3.2 and visualized with Morpheus (https://software.broadinstitute.org/morpheus), *p<0.05, **p<0.01, ***p<0.005, ****p<0.001.
3.5. IL-12 and IL-18 Impair Treg Suppression and Drive NK Cell Competition for IL-2
Given the clear TH1 phenotypic shift in response to IL-12 plus IL-18, we next sought to characterize their effects on Treg suppressive function. Using a dual color in vitro assay, we evaluated Treg suppression of whole PBMC responder cells in the presence or absence of IL-12 and/or IL-18. While Tregs showed no significant alterations in proliferation (Figure 6A), IL-12 alone and the combination of IL-12 and IL-18 significantly reduced Treg-mediated suppression of total CD4+ (Figure 6B) and CD8+ (Figure 6C) T cell proliferation in response to anti-CD3 and anti-CD28. Concurrently, NK cells within PBMC responders upregulated CD25 expression (Figure 6D) and proliferated to a far greater extent (Figure S5A) in response to IL-12 plus IL-18. We hypothesized that this would result in increased competition for naturally occurring IL-2, since exogenous IL-2 was not added to the suppression assay. To test this, primary NK cells were activated with IL-12 and IL-18 for 24 hours, then washed and co-cultured with non-activated/unstimulated primary human autologous Tregs in the presence or absence of IL-2. Indeed, we observed a dose-dependent reduction in Treg IL-2 signaling, as demonstrated by lower pSTAT5 gMFI, with increasing NK:Treg ratios (Figure 6E and S5B). Hence, in addition to conferring Treg-intrinsic phenotype alterations (Figure 5), these results indicate IL-12 and IL-18 impair Treg cell function through an extrinsic mechanism involving increased NK cell competition for IL-2.
Figure 6: Innate Cytokines Abrogate Treg Suppressive Function.
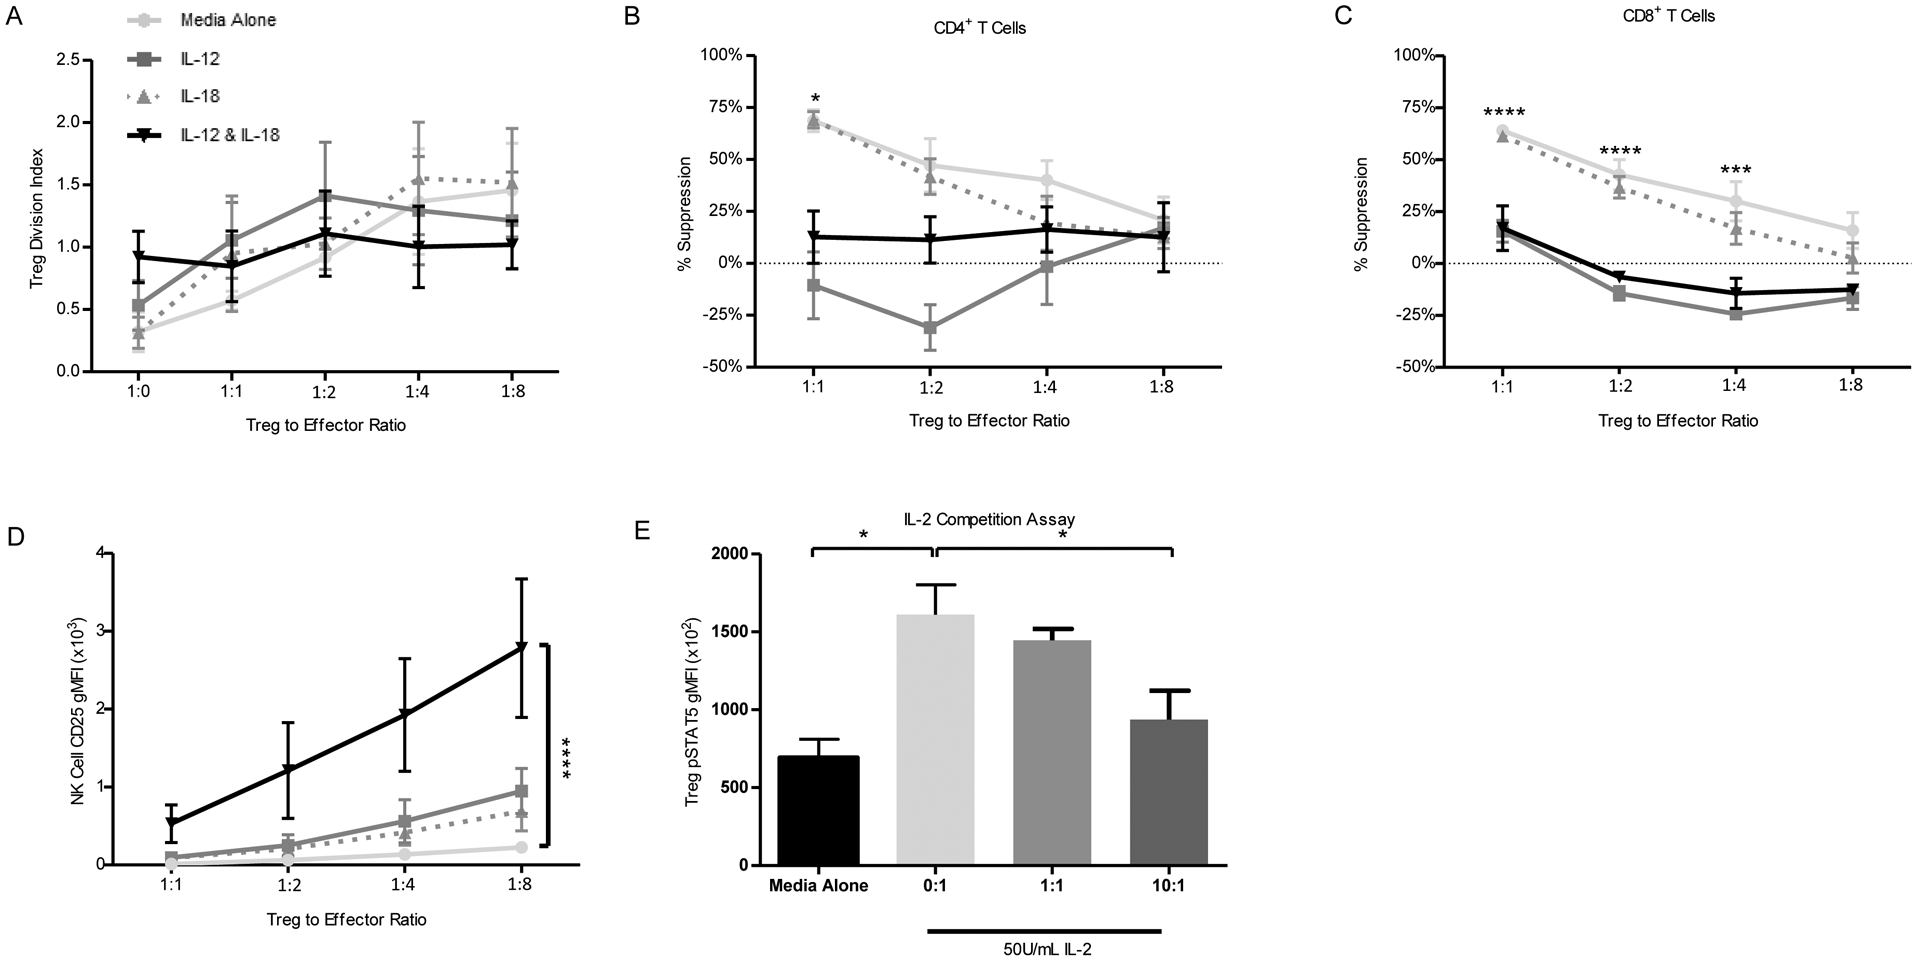
Suppression assays were performed as described in materials and methods. Compared to stimulation with IL-18 alone or unstimulated control, stimulation with IL-12 or IL-12 and IL-18 produced no significant change in (A) Treg proliferation, but trended towards a reduction as quantified by division index. We also noted reduced Treg percent suppression of (B) CD4+ and (C) CD8+ T cells. In response to IL-12 and IL-18 co-stimulation, (D) expression of CD25 on NK cells was significantly enhanced. (E) In an IL-2 competition assay, Treg staining of pSTAT5 was reduced in response to increasing activated NK:Treg ratio in co-culture. Statistics are the result of an ordinary two-way ANOVA with Bonferroni’s multiple comparisons test, *p<0.05, ***p<0.005, ****p<0.001.
3.6. IL-12 and IL-18 Synergize to Enhance NK Cell Cytotoxicity
We next assessed the effect of IL-12 and IL-18 on NK cell cytotoxic function using the HLA-null K562 myelogenous leukemia cell line as a target. CFSE labeled K562 cells were cultured with whole PBMCs, and specific killing was assessed by flow cytometry (Figure 7A). At the 10:1 effector:target cell (E:T) ratio, the addition of IL-12 but not IL-18 significantly increased the specific killing of K562 cells (2.8-fold, p<0.01; Figure 7B). The combination of IL-12 and IL-18 resulted in a 4.8-fold increase in NK cell-mediated killing (p<0.001; Figure 7B).
Figure 7: Innate Cytokines Enhance Natural Killer Cell Activity.
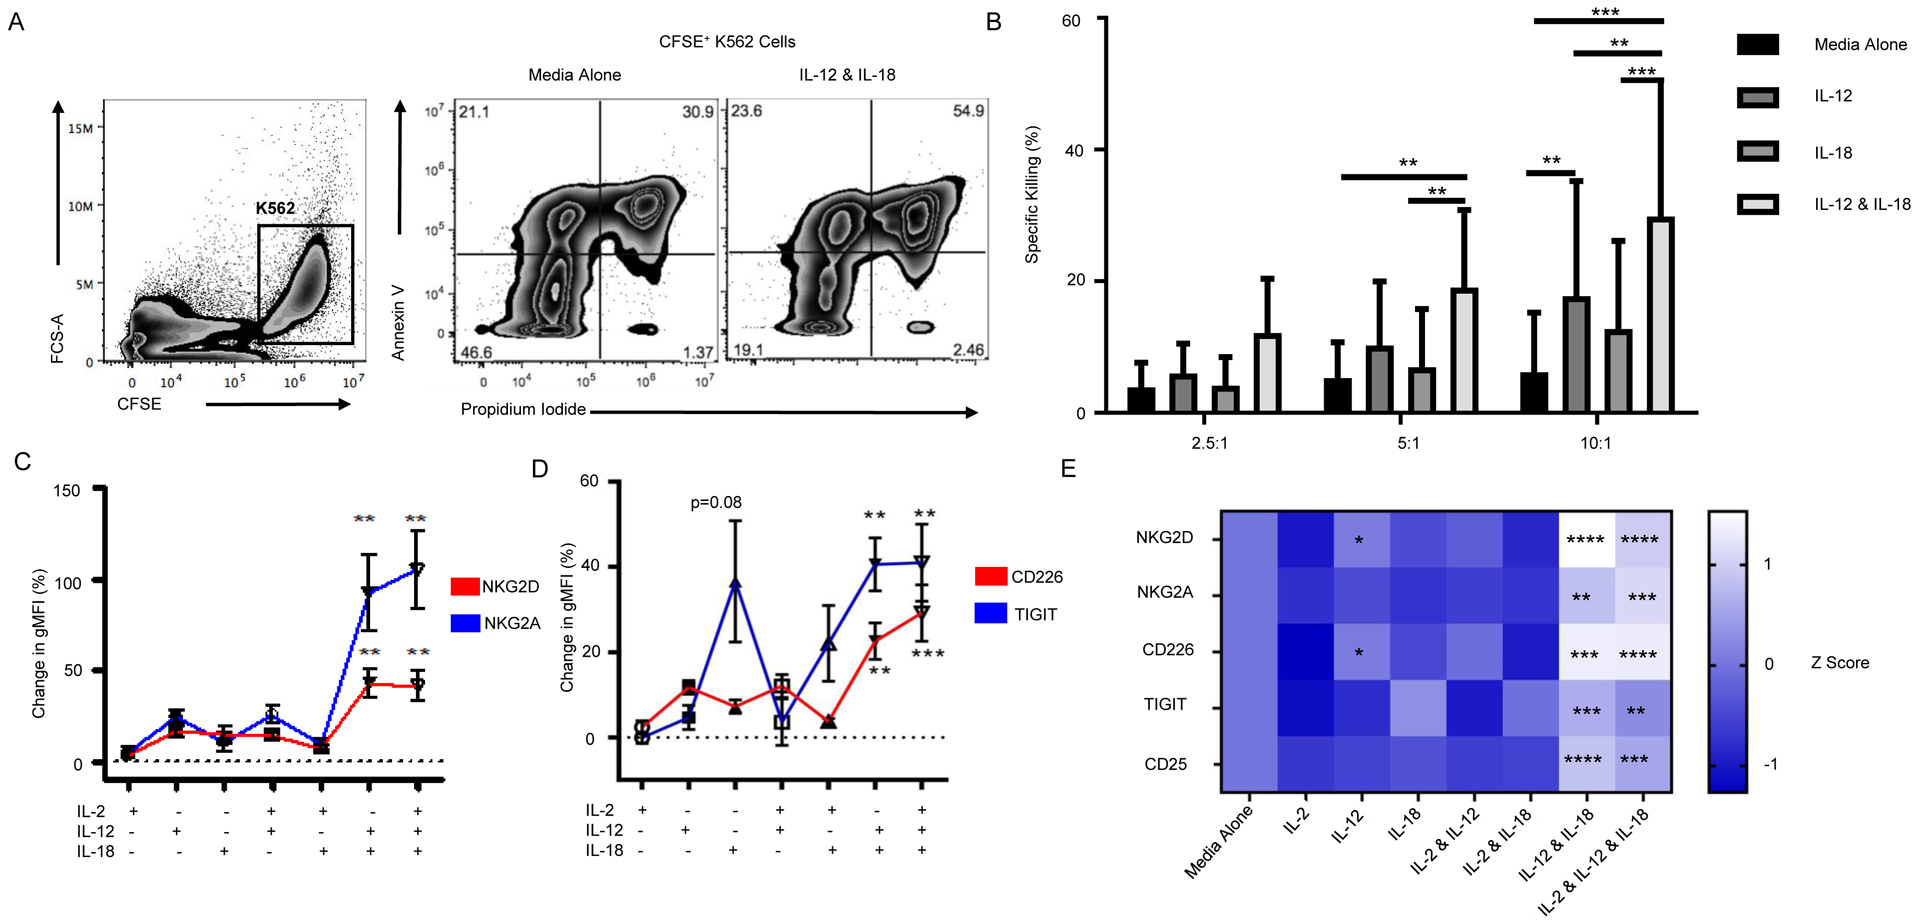
K562-HLAnull target cells were labeled with CFSE and co-cultured with whole PBMC effector cells at 10:1, 5:1, 2.5:1, and 0:1 Effector:Target cell ratios for 2.5 hours before being collected and stained with Annexin V and PI. (A) K562-HLAnull target cells were gated by CFSE positivity (left). Representative staining of target cells killed by unstimulated PBMCs (middle) or PBMCs treated with IL-12 and IL-18 (right) with end stage apoptosis indicated by Annexin V and PI double positivity. Percent specific killing was calculated by subtracting the amount of spontaneous target cell death in the 0:1 E:T wells from different PBMC effector to K562 target cell ratios. (B) PBMC effector cells were pre-treated overnight with cytokines, washed, and their function assessed. The combination of IL-12 and IL-18 significantly increased NK cell activity compared to either cytokine alone or unstimulated control (two-way ANOVA). NK cells were sorted from human lymphocytes by CD3−CD56+/bright and then stimulated with IL-2 (100 U/mL), IL-12 (1 ng/mL), and/or IL-18 (10 ng/mL) for 24 hours. The percent change in NK cell surface marker expression, as measured by gMFI, was corrected based on the unstimulated media control. Compared to IL-2 alone, IL-12 and IL-18 as well as IL-2, IL-12, and IL-18 stimulation of NK cells induced significant increases in expression of natural cytotoxicity receptors NKG2D and NKG2A (C), and costimulatory/co-inhibitory receptors CD226 and TIGIT (D). Raw data were converted to Z-scores and displayed in a heatmap with significance shown relative to IL-2 alone (E). Data are represented as mean ± SEM (n=3–6). Statistics are the result of two-way ANOVA with Tukey’s multiple comparison test, Kruskal-Wallis with Dunn’s multiple comparisons test and two-way ANOVA with Dunnett’s multiple comparison test, *p<0.05, **p<0.01, ***p<0.001, ****p<0.0001.
To gain insight on how IL-12 and IL-18 affect NK cell phenotype, NK cells were activated with IL-2 in the presence or absence of IL-12 and/or IL-18. IL-12 plus IL-18 significantly increased expression of NKG2D55 (p<0.01; Figure 7C and S6A) and NKG2A (p<0.01; Figure 7C and S6A). TIGIT (p<0.01; Figure 7D and S6A) as well as CD226 (p<0.01; Figure 7D and S6A) were also upregulated. Consistent with Figure 6D, we observed that IL-12 plus IL-18 stimulation synergistically increased NK cell expression of CD25 (p<0.0001; Figure S6B) but not the terminal differentiation marker CD57 (Figure S6C). A heat-map of Z-scored raw data shows the preference toward the inhibitory immuno-receptor TIGIT in the presence of IL-18 alone, while IL-12 alone promotes expression of activating receptors CD226 and NKG2D (p<0.05, Figure 7E). The combination of IL-12 and IL-18 increased both activating and inhibitory receptor expression, most notably NKG2D (p<0.0001), CD226 and TIGIT (p<0.001), and CD25 (p<0.0001; Figure 7E).
3.7. IL-12 and IL-18 Synergistically Enhance Autoreactive CTL-Mediated β-Cell Killing
We sought to determine the impact of IL-12 and IL-18 on CD8+ T cell-mediated lymphocytotoxicity (Figure 8). We engineered CTL “avatars” expressing a TCR (clone 32) specific for the islet antigen G6PC2, also known as islet-specific glucose-6-phosphatase catalytic subunit-related protein (IGRP), with an eGFP reporter as previously described31. We then co-cultured these CTL avatars with the CTV labeled βlox5 human β-cell line29, which expresses G6PC2, as targets in the presence or absence of IL-12 and/or IL-18, in a CML assay. CML was quantified using flow cytometry to distinguish early apoptosis (Annexin V+PI−) and late apoptosis (Annexin V+PI+) of βlox5 cells, and CTLs were assessed for activation-induced cell death (AICD: Annexin V+PI+; gating strategy shown in Figure 8A). We first determined the 5:1 E:T ratio to provide ~13% specific lysis of βlox5 cells (Figure 8B), thereby providing the potential to detect increased lysis with the addition of proinflammatory cytokines in subsequent assays. We confirmed the targeted killing of βlox5 cells labeled with TMRM using a vCML assay (Figure 8C and Video S1)33. At the 5:1 E:T ratio, neither IL-12 or IL-18 alone significantly increased specific target cell lysis (Annexin V+PI+) while the combination of IL-12 plus IL-18 significantly increased both percent specific lysis (p<0.001), specific early apoptosis (Annexin V+PI−; p<0.05; Figure 8D–F), and nonspecific/bystander lysis in assays with control CTLs transfected to express only eGFP (Figure S7A–B). Similarly, only the combination of IL-12 plus IL-18 significantly increased apoptosis of CTL avatars (p<0.01; Figure 8G), suggesting increased AICD. IL-12 plus IL-18 also significantly increased the frequency of CTL avatars staining positive for Granzyme B (p<0.01) and IFN-γ (p<0.01, Figure 8H–J). This increase appears to be synergistic for IFN-γ while this may not be the case for Granzyme B levels. The frequency of Granzyme B positive CTLs correlated with percent specific lysis of βlox5 cells (r=0.67, p<0.01; Figure 8K) while no other effector molecules measured (PD-1, NKG2D, and Perforin) had such an effect, suggesting a direct regulation, consistent with our prior observations of pSTAT4 binding to the GZMB promoter31. In the presence of IL-12 plus IL-18, concanamycin A (CMA), which inhibits degranulation, blunted cytotoxicity while anti-IFNγ or anti-Fas monoclonal antibodies did not (Figure S7C), confirming a degranulation-dependent mechanism of βlox5 cell killing. Altogether, these results support the notion that increased levels of IL-12 and IL-18 within the islet microenvironment might enhance the cytotoxic potential of autoreactive CD8+ T cells.
Figure 8: IL-12 & IL-18 Enhance Auto-reactive CTL Activity.
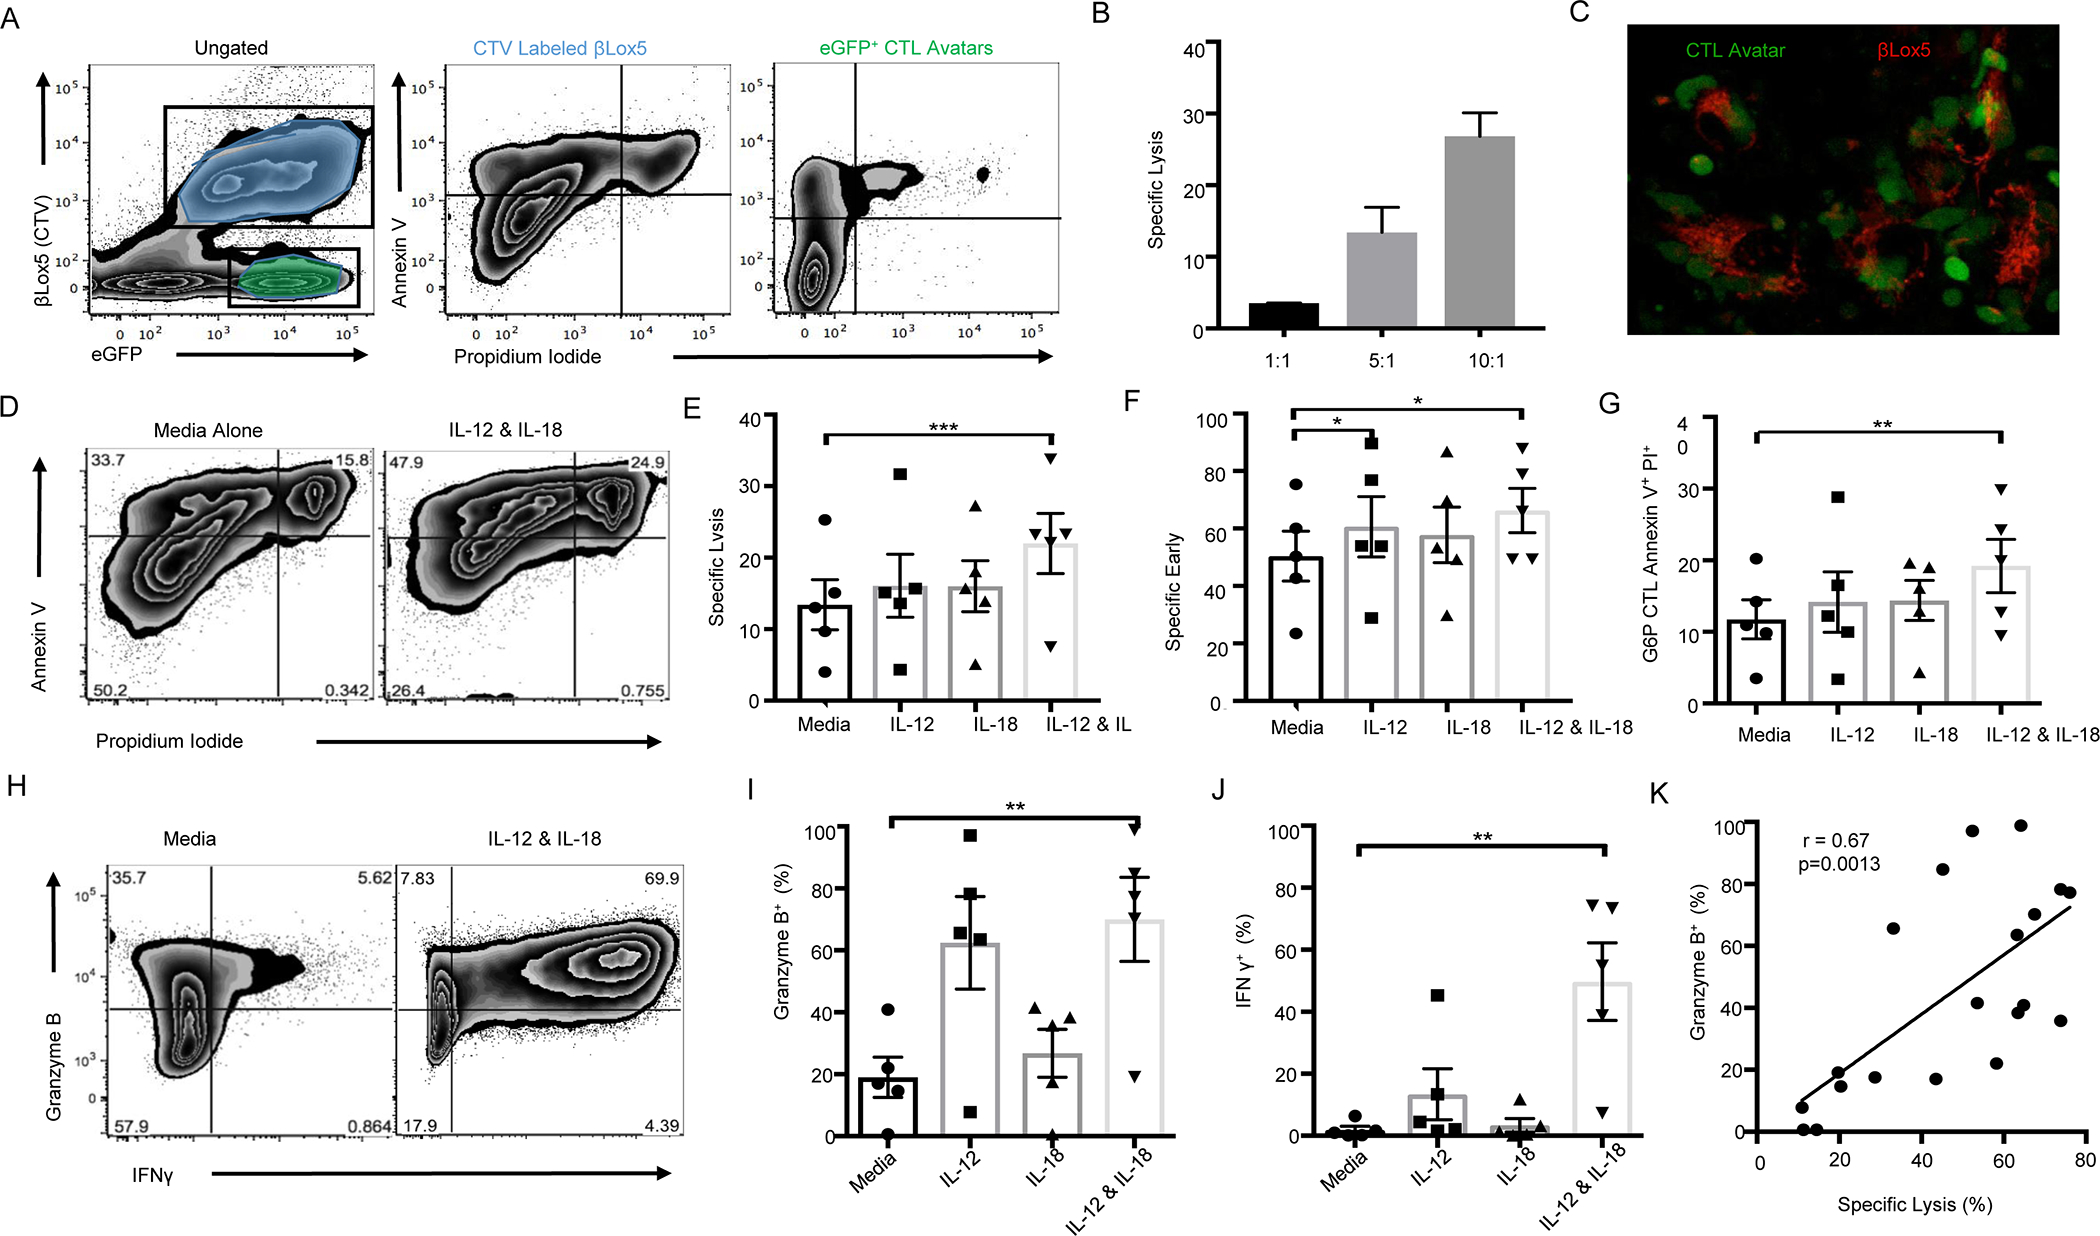
βlox5 target cells were labeled with CTV and co-cultured with G6PC2-reactive CTL avatars at Effector:Target cell [E:T] ratios of 0:1, 1:1, 5:1, and 10:1 for 16 hours before being collected and stained with Annexin V and PI. (A) G6PC2-specific CD8+ T cell avatars are determined based on GFP reporter expression (left). CTV+ target cells in end stage apoptosis are indicated by Annexin V and PI double positivity (middle). GFP+ CTL avatars undergoing activation-induced cell death (AICD) are indicated by Annexin V+ and PI+ (right). (B) Percent specific lysis (calculated by subtracting the amount of background cell death in 0:1 E:T ratio) was greater in higher CTL effector to βlox5 target cell ratios. (C) Representative image of the visual CML depicting the real-time lysis of βlox5 by G6PC2 CTLs. (D) Representative Annexin V and PI viability staining of βlox5 cells co-cultured with untreated CTL avatars (left) or CTLs treated with IL-12 (11.0 U/mL) and IL-18 (48.1 U/mL; right). (E) Percent specific lysis and (F) induction of target cell apoptosis was enhanced in the IL-12 and IL-18 condition. (G) The combination of IL-12 and IL-18 significantly increased AICD in the GFP+ CTLs. (H) Representative staining of unstimulated CTL avatars (left) as well as IL-12 and IL-18 stimulated CTL avatars (right). (I) The combination of IL-12 and IL-18 significantly increased the percentage of Granzyme B positive cells versus unstimulated control, as well as (J) the frequency of IFNγ+ CTL avatars. (K) Using data from all conditions tested the percentage of granzyme B positive CTL avatars correlates with percent specific lysis of βlox5 targets (Pearson correlation test). Data are represented as mean ± SEM (n=5). Statistics are the result of Pearson correlation or non-parametric Friedman test paired analysis and Dunn’s MTC, *p<0.05, **p<0.01.
4. DISCUSSION
The experiments presented herein explored how the pro-inflammatory cytokines, IL-12 and IL-18, in the context of T1D genetic susceptibility, might skew immune responses away from immunoregulation and towards autoimmunity. We hypothesized that alterations in T cell- and NK cell-mediated immunity, in response to an inflammatory cytokine milieu, might represent a so-called “missing link” between damage- and/or pathogen-associated pattern recognition pathways and T1D. Indeed, IL-12 and IL-18 synergistically promoted TH1 skewing, enhanced CTL cytotoxic activity via elevated GZMB, altered Treg phenotype, and impaired Treg suppressive function (Figure 4–8).
Specifically, in response to IL-12 plus IL-18 stimulation of PBMCs, Tconv, CTL, pTreg, tTreg and most appreciably, NK cells upregulated IFN-γ, expanding upon our previous findings1. Simultaneously, the cytokine combination decreased tTreg viability and CD25 expression, yet increased CD25 expression on NK cells. Previous reports have shown increased CTL expression of GZMB and lysis of target cells with IL-12 treatment56. Our results indicate IL-18 intensifies this effect in CTLs, while also causing an increase in GZMB expression in IL-12 and IL-18 exposed Tregs. The combination of IL-12 and IL-18 significantly amplified antigen-specific lysis of HLA-A*02:01+ βlox5 cells by CTL avatars and NK cell-mediated lysis of HLA-null K562 cells. Our observation that IL-12 plus IL-18 increased CTL AICD during the CML assay builds upon a previous report by Richer et al., which demonstrated IL-12 and IL-18 to sensitize CD8+ T cells to activation by increasing TCR signal transduction, even in cells expressing lower-affinity TCRs57. Collectively, these data suggest elevated levels of IL-12 and IL-18 in the islet microenvironment could enhance the activity of cytotoxic lymphocytes, even augmenting the pathogenic potential of T cells with low-affinity TCRs for islet auto-antigens.
We further explored the underlying mechanisms through which these innate cytokines augment NK cell cytotoxicity. Sorted NK cells stimulated with IL-12 and IL-18 exhibited increased expression of NKG2D and NKG2A, which are activating and inhibitory NCRs, respectively, that are critical for the recognition of HLA molecules and thus, cell-mediated killing58,59. Similarly, IL-12 plus IL-18 increased NK cell expression of both TIGIT and CD226, which are inhibitory and activating co-stimulatory receptors, respectively60. Interestingly, however, IL-18 alone drove a decrease in the CD226:TIGIT ratio that was mitigated by the addition of IL-12 (Figure 7). The balance of signaling through these receptors is critical for determining if an NK cell degranulates and kills its target cell or allows for cell survival61. Hence, in certain settings, IL-18 may constrain NK cell activation in the absence of IL-12, as previously suggested62. The observed increases in both activating and inhibitory NCRs and co-stimulatory receptors suggest that counterregulatory mechanisms may exist to avoid rampant activation and dysregulated immune responses in the presence of a proinflammatory cytokine milieu.
Interestingly, peripheral blood NK cells from T1D donors displayed elevated expression of CD226 and a higher CD226:TIGIT ratio as compared to controls. These data support an activated NK cell phenotype and prompted us to examine latent CMV infection as a potential covariate in our donor cohort. NKG2D expressed on NK cells functions as the receptor for ULBP16s that recognize the CMV protein UL1663, supporting a potential link between CMV infection and NK cell phenotype. In addition, CMV induces a myriad immunomodulatory changes, including the expression of an MHC class-I homologue and the ability to interfere with TAP-mediated HLA-E expression64. CMV infection may also interfere with NK cell signaling by promoting hyporesponsiveness to IL-12 while maintaining responsiveness to IL-1865. Our data suggest that this selectivity could alter NK costimulatory receptor balance in favor of TIGIT rather than CD226. While CD226 and TIGIT levels were not significantly different across CMV seropositive and seronegative groups, we did see an increased proportion of seronegative T1D donors while controls were more frequently CMV seropositive. The role of CMV infection in T1D etiology or pathogenesis has been investigated, though there are conflicting reports as to its significance, and covariates such as age and race/ethnicity further complicate drawing conclusions as to causality66,49. Hence, additional studies of longitudinal cohorts are needed to examine whether a counterregulatory or temporal relationship might exist between CMV and T1D.
Apart from CMV, enteroviruses such as Coxsackievirus have been suggested to play a role in T1D pathogenesis67–69, with numerous T1D candidate risk genes linked to anti-viral responses. Indeed, genotype at rs1990760 within IFIH1, which is responsible for sensing of viral or potentially dysregulated mRNA, has been suggested to regulate expression of the receptor MDA5 along with other interferon stimulated genes70, as well as the magnitude of islet type III interferon responses to Coxsackievirus B3 (CVB3)50, both of which are reduced in T1D patients who possess the homozygous risk genotype at this locus. Interestingly, our data regarding this SNP mirror other published works wherein heterozygous individuals present with increased antiviral signaling and counterintuitively increased enteroviral infection than either homozygous group, the underlying basis of which is speculated to be molecular heterosis71. This suggests that polymorphisms within IFIH1 may impair viral clearance, consistent with reports by The Environmental Determinants of Diabetes in the Young (TEDDY) study, which show an increased frequency of enteroviral infections prior to the development of islet autoantibodies72. Our studies show T1D risk at rs1990760 to be associated with increased NK cell frequency, as was the protective allele at rs917997 within the IL18RAP locus. eQTL analysis also revealed an association between reduced CD25 expression on total and CD56bright NK cells with the T1D risk allele at rs1990760 within IFIH1. In contrast, homozygosity for the risk allele at rs2104286 within IL2RA resulted in increased CD25 gMFI on NK cells and elevated CD25+ NK cell frequency. These observations suggest possible interactions across pathways connecting viral sensing by IFIH1 with IL-12 plus IL-18 signaling modulated by genetic risk at IL-18RAP, as well as alterations in IL-2 signaling, altogether influencing NK cell phenotype, frequency and function. While each of these SNPs identified by eQTL analysis has a relatively low OR for T1D, it has been suggested that multiple risk loci may converge on similar pathways, collectively impairing immune regulation73,74. Our results suggest IL-12 and IL-18 to be a critical axis effectively connecting genetic and environmental susceptibility for T1D.
Finally, IL-12 plus IL-18 stimulation increased CD25 expression on NK cells, ostensibly enabling them to compete for local IL-2. Indeed, the critical role for IL-2 in regulation of NK cells by Tregs has been elegantly demonstrated in mouse models of T1D75. To our knowledge, the results included here (Figure 6) are the first human in vitro data suggesting this relationship. Synergism between IL-2 and IL-12 or IL-18 has been shown previously to result in upregulation of NK cell CD25 expression26,76, though there is a paucity of data examining the implications of this on Treg function. When whole PBMCs were used as responders in suppression assays, IL-12 alone or in combination with IL-18 impaired Treg suppression of CD4+ and CD8+ T cells. Further, the IL-12 and IL-18 combination simultaneously increased NK cell expression of CD25 with decreasing Treg:effector ratios. Moreover, NK cells primed with IL-12 plus IL-18 were able to compete for IL-2 binding, resulting in reduced Treg STAT5 phosphorylation. Given that STAT5 signaling is essential for FOXP3 expression and Treg function77, these data together suggest a possible mechanism underlying the known negative correlation between serum levels of IL-12 and IL-18 and Treg frequency78.
4.1. Conclusions
These data have important clinical implications for trials of low dose IL-2 in settings of autoimmunity79 or Hepatitis C Virus-induced vasculitis80, which have consistently shown an increase in Treg numbers with concomitant NK cell expansion81,82. Our findings support pre-treatment of patients with T1D to reduce circulating levels of IL-12 (e.g., with Ustekinumab targeting IL-12/IL-23, which is approved for the treatment of psoriatic arthritis83) in combination with low dose IL-2 therapy. A similar approach might be beneficial with Treg adoptive cell therapy84,85. Additionally, our results support the use of genotype-specific selection of patients for T1D clinical trials where, for example, various SNPs might drive convergent immune dysregulation. Overall, our data suggest that elevated levels of IL-12 and IL-18 in combination promote CD4+ T cell production of IFNγ, CD8+ T cell cytotoxicity via Granzyme B, and NK cell activation. This in turn leads to increased cytolytic function and competition for IL-2 resulting in abrogation of Treg suppressive capacity and hence, could have the capacity to promote autoimmune diseases, such as T1D (Graphical Abstract).
Supplementary Material
IL-12 & IL-18 enhance NK cell and antigen specific CD8 T cell killing
Regulatory T cells (Tregs) lose suppressive capacity and produce IFN-γ
Type 1 Diabetes candidate genes permit CD25 upregulation on NK cells
NK cells exhibit altered receptor balance and are able to compete with Tregs for IL-2 in vitro
ACKNOWLEDGEMENTS
The authors would like to thank the study participants who donated blood samples essential to this work. We are indebted to clinical support staff and administrators who oversee clinical sample acquisition.
FUNDING
These studies were supported by grants from the American Diabetes Association (7-13-BS-022), the JDRF 2-PDF-2016-207-A-N (DP) and 1-16-PDF-131 (WY) and the National Institutes of Health P01 AI42288 (MAA, CEM, TMB), R01 DK106191 (TMB) and HIRN UC4 DK104194 (CEM) and P0063595 (TMB). LP is supported by a T32 training grant (5T32DK108736-03).
Footnotes
Publisher's Disclaimer: This is a PDF file of an unedited manuscript that has been accepted for publication. As a service to our customers we are providing this early version of the manuscript. The manuscript will undergo copyediting, typesetting, and review of the resulting proof before it is published in its final form. Please note that during the production process errors may be discovered which could affect the content, and all legal disclaimers that apply to the journal pertain.
GUARANTOR STATEMENT
As the guarantor of this work, Dr. Todd M. Brusko assumes full responsibility for the accuracy of the data reported herein.
The authors declare that no conflicts of interest exist pertaining to the work reported herein.
REFERENCES
- 1.Myhr CB, Hulme MA, Wasserfall CH, et al. The autoimmune disease-associated SNP rs917997 of IL18RAP controls IFNγ production by PBMC. J Autoimmun. 2013;44:8–12. doi: 10.1016/j.jaut.2013.06.001 [DOI] [PMC free article] [PubMed] [Google Scholar]
- 2.Trinchieri G. Interleukin-12 and the regulation of innate resistance and adaptive immunity. Nat Rev Immunol. 2003;3(2):133–146. doi: 10.1038/nri1001 [DOI] [PubMed] [Google Scholar]
- 3.Takeda K, Tsutsui H, Yoshimoto T, et al. Defective NK Cell Activity and Th1 Response in IL-18–Deficient Mice. Immunity. 1998;8(3):383–390. doi: 10.1016/S1074-7613(00)80543-9 [DOI] [PubMed] [Google Scholar]
- 4.Adorini L. Interleukin-12, a key cytokine in Th1-mediated autoimmune diseases. Cell Mol Life Sci. 1999;55(12):1610–1625. doi: 10.1007/s000180050400 [DOI] [PMC free article] [PubMed] [Google Scholar]
- 5.Sedimbi SK, Hägglöf T, Karlsson MCI. IL-18 in inflammatory and autoimmune disease. Cell Mol Life Sci. 2013;70(24):4795–4808. doi: 10.1007/s00018-013-1425-y [DOI] [PMC free article] [PubMed] [Google Scholar]
- 6.Winkler G, Dworak O, Salamon F, Salamon D, Speer G, Cseh K. Increased interleukin-12 plasma concentrations in both, insulin-dependent and non-insulin-dependent diabetes mellitus. Diabetologia. 1998;41(4):488–488. doi: 10.1007/s001250050935 [DOI] [PubMed] [Google Scholar]
- 7.Shokry D, Gawish HH. Interleukin-12 levels in Egyptian children with type 1 diabetes mellitus. Egypt J Pediatr Allergy Immunol. 2013;11(1):41–45. http://www.jespai.org/cms/upload/1384863311.pdf. [Google Scholar]
- 8.Harms RZ, Yarde DN, Guinn Z, et al. Increased expression of IL-18 in the serum and islets of type 1 diabetics. Mol Immunol. 2015;64(2):306–312. doi: 10.1016/j.molimm.2014.12.012 [DOI] [PMC free article] [PubMed] [Google Scholar]
- 9.Altinova AE, Yetkin I, Akbay E, Bukan N, Arslan M. Serum IL-18 levels in patients with type 1 diabetes: Relations to metabolic control and microvascular complications. Cytokine. 2008;42(2):217–221. doi: 10.1016/j.cyto.2008.02.006 [DOI] [PubMed] [Google Scholar]
- 10.Vandenbroeck K. Cytokine Gene Polymorphisms and Human Autoimmune Disease in the Era of Genome-Wide Association Studies. J Interf Cytokine Res. 2012;32(4):139–151. doi: 10.1089/jir.2011.0103 [DOI] [PMC free article] [PubMed] [Google Scholar]
- 11.Pehlić M, Vrkić D, Škrabić V, et al. IL12RB2 Gene Is Associated with the Age of Type 1 Diabetes Onset in Croatian Family Trios Pietropaolo M, ed. PLoS One. 2012;7(11):e49133. doi: 10.1371/journal.pone.0049133 [DOI] [PMC free article] [PubMed] [Google Scholar]
- 12.Onengut-Gumuscu S, Chen W-M, Burren O, et al. Fine mapping of type 1 diabetes susceptibility loci and evidence for colocalization of causal variants with lymphoid gene enhancers. Nat Genet. 2015;47(4):381–386. doi: 10.1038/ng.3245 [DOI] [PMC free article] [PubMed] [Google Scholar]
- 13.de Azevêdo Silva J, Tavares NAC, Santos MMS, et al. Meta-analysis of STAT4 and IFIH1 polymorphisms in type 1 diabetes mellitus patients with autoimmune polyglandular syndrome type III. Genet Mol Res. 2015;14(4):17730–17738. doi: 10.4238/2015.December.21.46 [DOI] [PubMed] [Google Scholar]
- 14.Achenbach P, Hummel M, Thümer L, Boerschmann H, Höfelmann D, Ziegler AG. Characteristics of rapid vs slow progression to type 1 diabetes in multiple islet autoantibody-positive children. Diabetologia. 2013;56(7):1615–1622. doi: 10.1007/s00125-013-2896-y [DOI] [PubMed] [Google Scholar]
- 15.Smyth DJ, Plagnol V, Walker NM, et al. Shared and Distinct Genetic Variants in Type 1 Diabetes and Celiac Disease. N Engl J Med. 2008;359(26):2767–2777. doi: 10.1056/NEJMoa0807917 [DOI] [PMC free article] [PubMed] [Google Scholar]
- 16.Barrett JC, Clayton DG, Concannon P, et al. Genome-wide association study and meta-analysis find that over 40 loci affect risk of type 1 diabetes. Nat Genet. 2009;41(6):703–707. doi: 10.1038/ng.381 [DOI] [PMC free article] [PubMed] [Google Scholar]
- 17.Fogel LA, Yokoyama WM, French AR. Natural killer cells in human autoimmune disorders. Arthritis Res Ther. 2013;15(4):216. doi: 10.1186/ar4232 [DOI] [PMC free article] [PubMed] [Google Scholar]
- 18.Fraker C, Bayer AL. The Expanding Role of Natural Killer Cells in Type 1 Diabetes and Immunotherapy. Curr Diab Rep. 2016;16(11):109. doi: 10.1007/s11892-016-0806-7 [DOI] [PubMed] [Google Scholar]
- 19.Gur C, Porgador A, Elboim M, et al. The activating receptor NKp46 is essential for the development of type 1 diabetes. Nat Immunol. 2010;11(2):121–128. doi: 10.1038/ni.1834 [DOI] [PubMed] [Google Scholar]
- 20.Ogasawara K, Hamerman JA, Ehrlich LR, et al. NKG2D blockade prevents autoimmune diabetes in NOD mice. Immunity. 2004;20(6):757–767. doi: 10.1016/j.immuni.2004.05.008 [DOI] [PubMed] [Google Scholar]
- 21.Beilke JN, Meagher CT, Hosiawa K, Champsaur M, Bluestone J a, Lanier LL. NK cells are not required for spontaneous autoimmune diabetes in NOD mice. PLoS One. 2012;7(4):e36011. doi: 10.1371/journal.pone.0036011 [DOI] [PMC free article] [PubMed] [Google Scholar]
- 22.Rodacki M, Milech A, de Oliveira JEP. NK cells and type 1 diabetes. Clin Dev Immunol. 2006;13(2–4):101–107. doi: 10.1080/17402520600877182 [DOI] [PMC free article] [PubMed] [Google Scholar]
- 23.Rodacki M, Svoren B, Butty V, et al. Altered natural killer cells in type 1 diabetic patients. Diabetes. 2007;56(1):177–185. doi: 10.2337/db06-0493 [DOI] [PubMed] [Google Scholar]
- 24.Lorini R, Moretta A, Valtorta A, et al. Cytotoxic activity in children with insulin-dependent diabetes mellitus. Diabetes Res Clin Pract. 1994;23(1):37–42. doi: 10.1016/0168-8227(94)90125-2 [DOI] [PubMed] [Google Scholar]
- 25.Qin H, Lee I-F, Panagiotopoulos C, et al. Natural killer cells from children with type 1 diabetes have defects in NKG2D-dependent function and signaling. Diabetes. 2011;60(3):857–866. doi: 10.2337/db09-1706 [DOI] [PMC free article] [PubMed] [Google Scholar]
- 26.Leong JW, Chase JM, Romee R, et al. Preactivation with IL-12, IL-15, and IL-18 induces cd25 and a functional high-affinity il-2 receptor on human cytokine-induced memory-like natural killer cells. Biol Blood Marrow Transplant. 2014;20(4):463–473. doi: 10.1016/j.bbmt.2014.01.006 [DOI] [PMC free article] [PubMed] [Google Scholar]
- 27.Ghiringhelli F, Ménard C, Terme M, et al. CD4+CD25+ regulatory T cells inhibit natural killer cell functions in a transforming growth factor-beta-dependent manner. J Exp Med. 2005;202(8):1075–1085. doi: 10.1084/jem.20051511 [DOI] [PMC free article] [PubMed] [Google Scholar]
- 28.Josefowicz SZ, Lu L-F, Rudensky AY. Regulatory T Cells: Mechanisms of Differentiation and Function. Annu Rev Immunol. 2012;30(1):531–564. doi: 10.1146/annurev.immunol.25.022106.141623 [DOI] [PMC free article] [PubMed] [Google Scholar]
- 29.Lightfoot YL, Chen J, Mathews CE, Oliveira C, Cardoso S. Role of the Mitochondria in Immune-Mediated Apoptotic Death of the Human Pancreatic β Cell Line βLox5 Maedler K, ed. PLoS One. 2011;6(6):e20617. doi: 10.1371/journal.pone.0020617 [DOI] [PMC free article] [PubMed] [Google Scholar]
- 30.Yeh W-I, Seay HR, Newby B, et al. Avidity and Bystander Suppressive Capacity of Human Regulatory T Cells Expressing De Novo Autoreactive T-Cell Receptors in Type 1 Diabetes. Front Immunol. 2017;8:1313. doi: 10.3389/fimmu.2017.01313 [DOI] [PMC free article] [PubMed] [Google Scholar]
- 31.Newby BN, Brusko TM, Zou B, Atkinson MA, Clare-Salzler M, Mathews CE. Type 1 Interferons Potentiate Human CD8+ T-Cell Cytotoxicity Through a STAT4- and Granzyme B-Dependent Pathway. Diabetes. 2017;66(12):3061–3071. doi: 10.2337/db17-0106 [DOI] [PMC free article] [PubMed] [Google Scholar]
- 32.Chen J, Grieshaber S, Mathews CE. Methods to Assess Beta Cell Death Mediated by Cytotoxic T Lymphocytes. J Vis Exp. 2011;(52):e2724–e2724. doi: 10.3791/2724 [DOI] [PMC free article] [PubMed] [Google Scholar]
- 33.Chen J, Gusdon AM, Piganelli J, et al. mt-Nd2(a) Modifies resistance against autoimmune type 1 diabetes in NOD mice at the level of the pancreatic β-cell. Diabetes. 2011;60(1):355–359. doi: 10.2337/db10-1241 [DOI] [PMC free article] [PubMed] [Google Scholar]
- 34.Wickham H. Ggplot2: Elegant Graphics for Data Analysise. New York: Springer-Verlag; 2016. https://ggplot2.tidyverse.org. [Google Scholar]
- 35.Perry DJ, Wasserfall CH, Oram RA, et al. Application of a Genetic Risk Score to Racially Diverse Type 1 Diabetes Populations Demonstrates the Need for Diversity in Risk-Modeling. Sci Rep. 2018;8(1):4529. doi: 10.1038/s41598-018-22574-5 [DOI] [PMC free article] [PubMed] [Google Scholar]
- 36.Putnam AL, Brusko TM, Lee MR, et al. Expansion of Human Regulatory T-Cells From Patients With Type 1 Diabetes. Methods. 2009;58(March). doi: 10.2337/db08-1168.A.L.P. [DOI] [PMC free article] [PubMed] [Google Scholar]
- 37.Shabalin AA. Matrix eQTL: ultra fast eQTL analysis via large matrix operations. Bioinformatics. 2012;28(10):1353–1358. doi: 10.1093/bioinformatics/bts163 [DOI] [PMC free article] [PubMed] [Google Scholar]
- 38.Poli A, Michel T, Thérésine M, Andrès E, Hentges F, Zimmer J. CD56 bright natural killer (NK) cells: an important NK cell subset. Immunology. 2009;126(4):458–465. doi: 10.1111/j.1365-2567.2008.03027.x [DOI] [PMC free article] [PubMed] [Google Scholar]
- 39.Fuhrman CA, Yeh W-I, Seay HR, et al. Divergent phenotypes of human regulatory T cells expressing the receptors TIGIT and CD226. J Immunol July. 2015;1(1951):145–155. doi: 10.4049/jimmunol.1402381 [DOI] [PMC free article] [PubMed] [Google Scholar]
- 40.Montaldo E, Del Zotto G, Chiesa M Della, et al. Human NK cell receptors/markers: A tool to analyze NK cell development, subsets and function. Cytom Part A. 2013;83(8). doi: 10.1002/cyto.a.22302 [DOI] [PubMed] [Google Scholar]
- 41.Ahlenstiel G, Martin MP, Gao X, Carrington M, Rehermann B. Distinct KIR/HLA compound genotypes affect the kinetics of human antiviral natural killer cell responses. J Clin Invest. 2008;118(3):1017–1026. doi: 10.1172/JCI32400 [DOI] [PMC free article] [PubMed] [Google Scholar]
- 42.Garg G, Tyler JR, Yang JHM, et al. Type 1 diabetes-associated IL2RA variation lowers IL-2 signaling and contributes to diminished CD4+CD25+ regulatory T cell function. J Immunol. 2012;188(9):4644–4653. doi: 10.4049/jimmunol.1100272 [DOI] [PMC free article] [PubMed] [Google Scholar]
- 43.Kaczorowski KJ, Shekhar K, Nkulikiyimfura D, et al. Continuous immunotypes describe human immune variation and predict diverse responses. Proc Natl Acad Sci U S A. 2017;114(30):E6097–E6106. doi: 10.1073/pnas.1705065114 [DOI] [PMC free article] [PubMed] [Google Scholar]
- 44.Sutherland CL, Chalupny NJ, Schooley K, VandenBos T, Kubin M, Cosman D. UL16-binding proteins, novel MHC class I-related proteins, bind to NKG2D and activate multiple signaling pathways in primary NK cells. J Immunol. 2002;168(2):671–679. http://www.ncbi.nlm.nih.gov/pubmed/11777960. Accessed November 20, 2018. [DOI] [PubMed] [Google Scholar]
- 45.Picarda G, Benedict CA. Cytomegalovirus: Shape-Shifting the Immune System. J Immunol. 2018;200(12):3881–3889. doi: 10.4049/jimmunol.1800171 [DOI] [PMC free article] [PubMed] [Google Scholar]
- 46.Patel M, Vlahava V-M, Forbes SK, Fielding CA, Stanton RJ, Wang ECY. HCMV-Encoded NK Modulators: Lessons From in vitro and in vivo Genetic Variation. Front Immunol. 2018;9:2214. doi: 10.3389/fimmu.2018.02214 [DOI] [PMC free article] [PubMed] [Google Scholar]
- 47.Horowitz A, Strauss-Albee DM, Leipold M, et al. Genetic and environmental determinants of human NK cell diversity revealed by mass cytometry. Sci Transl Med. 2013;5(208):208ra145. doi: 10.1126/scitranslmed.3006702 [DOI] [PMC free article] [PubMed] [Google Scholar]
- 48.Peruzzi G, Femnou L, Gil-Krzewska A, et al. Membrane-Type 6 Matrix Metalloproteinase Regulates the Activation-Induced Downmodulation of CD16 in Human Primary NK Cells. J Immunol. 2013;191(4):1883–1894. doi: 10.4049/JIMMUNOL.1300313 [DOI] [PMC free article] [PubMed] [Google Scholar]
- 49.DOWD JB, AIELLO AE, ALLEY DE. Socioeconomic disparities in the seroprevalence of cytomegalovirus infection in the US population: NHANES III. Epidemiol Infect. 2009;137(1):58–65. doi: 10.1017/S0950268808000551 [DOI] [PMC free article] [PubMed] [Google Scholar]
- 50.Domsgen E, Lind K, Kong L, et al. An IFIH1 gene polymorphism associated with risk for autoimmunity regulates canonical antiviral defence pathways in Coxsackievirus infected human pancreatic islets. Sci Rep. 2016;6:39378. doi: 10.1038/srep39378 [DOI] [PMC free article] [PubMed] [Google Scholar]
- 51.Yoneyama M, Fujita T. Function of RIG-I-like receptors in antiviral innate immunity. J Biol Chem. 2007;282(21):15315–15318. doi: 10.1074/jbc.R700007200 [DOI] [PubMed] [Google Scholar]
- 52.Cerosaletti K, Schneider A, Schwedhelm K, et al. Multiple Autoimmune-Associated Variants Confer Decreased IL-2R Signaling in CD4+CD25hi T Cells of Type 1 Diabetic and Multiple Sclerosis Patients Jacobson S, ed. PLoS One. 2013;8(12):e83811. doi: 10.1371/journal.pone.0083811 [DOI] [PMC free article] [PubMed] [Google Scholar]
- 53.Dendrou CA, Plagnol V, Fung E, et al. Cell-specific protein phenotypes for the autoimmune locus IL2RA using a genotype-selectable human bioresource. Nat Genet. 2009;41(9):1011–1015. doi: 10.1038/ng.434 [DOI] [PMC free article] [PubMed] [Google Scholar]
- 54.Tominaga K, Yoshimoto T, Torigoe K, et al. IL-12 synergizes with IL-18 or IL-1beta for IFN-gamma production from human T cells. Int Immunol. 2000;12(2):151–160. http://www.ncbi.nlm.nih.gov/pubmed/10653850. Accessed November 20, 2018. [DOI] [PubMed] [Google Scholar]
- 55.Zhang C, Zhang J, Niu J, Zhou Z, Zhang J, Tian Z. Interleukin-12 improves cytotoxicity of natural killer cells via upregulated expression of NKG2D. Hum Immunol. 2008;69(8):490–500. doi: 10.1016/j.humimm.2008.06.004 [DOI] [PubMed] [Google Scholar]
- 56.Chowdhury FZ, Ramos HJ, Davis LS, Forman J, Farrar JD. IL-12 selectively programs effector pathways that are stably expressed in human CD8+ effector memory T cells in vivo. Blood. 2011;118(14):3890–3900. doi: 10.1182/blood-2011-05-357111 [DOI] [PMC free article] [PubMed] [Google Scholar]
- 57.Richer MJ, Nolz JC, Harty JT. Pathogen-specific inflammatory milieux tune the antigen sensitivity of CD8(+) T cells by enhancing T cell receptor signaling. Immunity. 2013;38(1):140–152. doi: 10.1016/j.immuni.2012.09.017 [DOI] [PMC free article] [PubMed] [Google Scholar]
- 58.Zhang C, Zhang J, Wei H, Tian Z. Imbalance of NKG2D and its inhibitory counterparts: How does tumor escape from innate immunity? Int Immunopharmacol. 2005;5(7–8):1099–1111. doi: 10.1016/j.intimp.2005.03.003 [DOI] [PubMed] [Google Scholar]
- 59.Wada H, Matsumoto N, Maenaka K, Suzuki K, Yamamoto K. The inhibitory NK cell receptor CD94/NKG2A and the activating receptor CD94/NKG2C bind the top of HLA-E through mostly shared but partly distinct sets of HLA-E residues. Eur J Immunol. 2004;34(1):81–90. doi: 10.1002/eji.200324432 [DOI] [PubMed] [Google Scholar]
- 60.Chan CJ, Martinet L, Gilfillan S, et al. The receptors CD96 and CD226 oppose each other in the regulation of natural killer cell functions. Nat Immunol. 2014;15(5):431–438. doi: 10.1038/ni.2850 [DOI] [PubMed] [Google Scholar]
- 61.Martinet L, Smyth MJ. Balancing natural killer cell activation through paired receptors. Nat Rev Immunol. 2015;155(March):1–12. doi: 10.1038/nri3799 [DOI] [PubMed] [Google Scholar]
- 62.Novick D, Kim S, Kaplanski G, Dinarello CA. Interleukin-18, more than a Th1 cytokine. Semin Immunol. 2013;25(6):439–448. doi: 10.1016/j.smim.2013.10.014 [DOI] [PubMed] [Google Scholar]
- 63.Sutherland CL, Chalupny NJ, Schooley K, VandenBos T, Kubin M, Cosman D. UL16-binding proteins, novel MHC class I-related proteins, bind to NKG2D and activate multiple signaling pathways in primary NK cells. J Immunol. 2002;168(2):671–679. doi: 10.4049/JIMMUNOL.168.2.671 [DOI] [PubMed] [Google Scholar]
- 64.Wilkinson GWG, Tomasec P, Stanton RJ, et al. Modulation of natural killer cells by human cytomegalovirus. J Clin Virol. 2008;41(3):206–212. doi: 10.1016/j.jcv.2007.10.027 [DOI] [PMC free article] [PubMed] [Google Scholar]
- 65.Hammer Q, Rückert T, Dunst J, Romagnani C. Adaptive Natural Killer Cells Integrate Interleukin-18 during Target-Cell Encounter. Front Immunol. 2018;8:1976. doi: 10.3389/fimmu.2017.01976 [DOI] [PMC free article] [PubMed] [Google Scholar]
- 66.Ekman I, Vuorinen T, Knip M, et al. Early childhood CMV infection may decelerate the progression to clinical type 1 diabetes. Pediatr Diabetes. 2019;20(1):73–77. doi: 10.1111/pedi.12788 [DOI] [PubMed] [Google Scholar]
- 67.Salvatoni A, Baj A, Bianchi G, Federico G, Colombo M, Toniolo A. Intrafamilial spread of enterovirus infections at the clinical onset of type 1 diabetes. Pediatr Diabetes. 2013;14(6):407–416. doi: 10.1111/pedi.12056 [DOI] [PubMed] [Google Scholar]
- 68.Dotta F, Censini S, van Halteren AGS, et al. Coxsackie B4 virus infection of beta cells and natural killer cell insulitis in recent-onset type 1 diabetic patients. Proc Natl Acad Sci U S A. 2007;104(12):5115–5120. doi: 10.1073/pnas.0700442104 [DOI] [PMC free article] [PubMed] [Google Scholar]
- 69.Richardson SJ, Leete P, Bone AJ, Foulis AK, Morgan NG. Expression of the enteroviral capsid protein VP1 in the islet cells of patients with type 1 diabetes is associated with induction of protein kinase R and downregulation of Mcl-1. Diabetologia. 2013;56(1):185–193. doi: 10.1007/s00125-012-2745-4 [DOI] [PubMed] [Google Scholar]
- 70.Schulte BM, Gielen PR, Kers-Rebel ED, et al. Enterovirus Exposure Uniquely Discriminates Type 1 Diabetes Patients with a Homozygous from a Heterozygous Melanoma Differentiation-Associated Protein 5/Interferon Induced with Helicase C Domain 1 A946T Genotype. Viral Immunol. 2016;29(7):389–397. doi: 10.1089/vim.2015.0140 [DOI] [PubMed] [Google Scholar]
- 71.Cinek O, Tapia G, Witsø E, et al. Enterovirus RNA in peripheral blood may be associated with the variants of rs1990760, a common type 1 diabetes associated polymorphism in IFIH1. PLoS One. 2012;7(11):e48409. doi: 10.1371/journal.pone.0048409 [DOI] [PMC free article] [PubMed] [Google Scholar]
- 72.Honkanen H, Oikarinen S, Nurminen N, et al. Detection of enteroviruses in stools precedes islet autoimmunity by several months: possible evidence for slowly operating mechanisms in virus-induced autoimmunity. Diabetologia. 2017;60(3):424–431. doi: 10.1007/s00125-016-4177-z [DOI] [PubMed] [Google Scholar]
- 73.Winkler C, Krumsiek J, Lempainen J, et al. A strategy for combining minor genetic susceptibility genes to improve prediction of disease in type 1 diabetes. Genes Immun. 2012;13(7):549–555. doi: 10.1038/gene.2012.36 [DOI] [PubMed] [Google Scholar]
- 74.Concannon P, Rich SS, Nepom GT. Genetics of Type 1A Diabetes. N Engl J Med. 2009;360(16):1646–1654. doi: 10.1056/NEJMra0808284 [DOI] [PubMed] [Google Scholar]
- 75.Sitrin J, Ring A, Garcia KC, Benoist C, Mathis D. Regulatory T cells control NK cells in an insulitic lesion by depriving them of IL-2. J Exp Med. 2013;210(6):1153–1165. doi: 10.1084/jem.20122248 [DOI] [PMC free article] [PubMed] [Google Scholar]
- 76.Nielsen CM, Wolf AS, Goodier MR, Riley EM. Synergy between common γ chain family cytokines and IL-18 potentiates innate and adaptive pathways of NK cell activation. Front Immunol. 2016;7(MAR). doi: 10.3389/fimmu.2016.00101 [DOI] [PMC free article] [PubMed] [Google Scholar]
- 77.Garg G, Tyler JR, Yang JHM, et al. Type 1 Diabetes-Associated IL2RA Variation Lowers IL-2 Signaling and Contributes to Diminished CD4+CD25+ Regulatory T Cell Function. J Immunol. 2012;188(9):4644–4653. doi: 10.4049/jimmunol.1100272 [DOI] [PMC free article] [PubMed] [Google Scholar]
- 78.Ryba-Stanisławowska M, Rybarczyk-Kapturska K, Myśliwiec M, Myśliwska J. Elevated Levels of Serum IL-12 and IL-18 are Associated with Lower Frequencies of CD4+CD25highFOXP3+ Regulatory T cells in Young Patients with Type 1 Diabetes. Inflammation. 2014;37(5):1513–1520. doi: 10.1007/s10753-014-9878-1 [DOI] [PMC free article] [PubMed] [Google Scholar]
- 79.Rosenzwajg M, Churlaud G, Mallone R, et al. Low-dose interleukin-2 fosters a dose-dependent regulatory T cell tuned milieu in T1D patients. J Autoimmun. 2015;58:48–58. doi: 10.1016/j.jaut.2015.01.001 [DOI] [PMC free article] [PubMed] [Google Scholar]
- 80.Saadoun D, Rosenzwajg M, Joly F, et al. Regulatory T-Cell Responses to Low-Dose Interleukin-2 in HCV-Induced Vasculitis. N Engl J Med. 2011;365(22):2067–2077. doi: 10.1056/NEJMoa1105143 [DOI] [PubMed] [Google Scholar]
- 81.Long SA, Buckner JH, Greenbaum CJ. IL-2 therapy in type 1 diabetes: “Trials” and tribulations. Clin Immunol. 2013;149(3). doi: 10.1016/j.clim.2013.02.005 [DOI] [PubMed] [Google Scholar]
- 82.Long SA, Rieck M, Sanda S, et al. Rapamycin/IL-2 Combination Therapy in Patients With Type 1 Diabetes Augments Tregs yet Transiently Impairs -Cell Function. Diabetes. 2012;61(9):2340–2348. doi: 10.2337/db12-0049 [DOI] [PMC free article] [PubMed] [Google Scholar]
- 83.Leonardi CL, Kimball AB, Papp KA, et al. Efficacy and safety of ustekinumab, a human interleukin-12/23 monoclonal antibody, in patients with psoriasis: 76-week results from a randomised, double-blind, placebo-controlled trial (PHOENIX 1). Lancet (London, England). 2008;371(9625):1665–1674. doi: 10.1016/S0140-6736(08)60725-4 [DOI] [PubMed] [Google Scholar]
- 84.Gitelman SE, Bluestone JA. Regulatory T cell therapy for type 1 diabetes: May the force be with you. J Autoimmun. 2016;71:78–87. doi: 10.1016/j.jaut.2016.03.011 [DOI] [PubMed] [Google Scholar]
- 85.Hull CM, Peakman M, Tree TIM. Regulatory T cell dysfunction in type 1 diabetes: what’s broken and how can we fix it? Diabetologia. 2017;60(10):1839–1850. doi: 10.1007/s00125-017-4377-1 [DOI] [PMC free article] [PubMed] [Google Scholar]
Associated Data
This section collects any data citations, data availability statements, or supplementary materials included in this article.