

Abstract
Background:
Cerebrospinal fluid (CSF) levels of total tau (t-tau) protein are thought to reflect the intensity of the neuronal damage in neurodegeneration, including Alzheimer’s disease (AD). The recent link of CSF t-tau to rapidly progressive AD raises the question among other AD clinical variants regarding CSF t-tau. We investigated the clinical phenotypes of AD patients with varying CSF t-tau levels.
Objective:
We tested the hypothesis that highly elevated CSF t-tau level would have a higher likelihood of presenting with atypical non-amnestic variants of AD.
Methods:
Retrospective comparative case study of 97 patients evaluated in a memory clinic with clinical presentation and CSF biomarkers consistent with AD. We compared the age, sex, education, APOE ε4 status, Montreal Cognitive Assessment (MoCA) score, clinical phenotype, and MRI volumetric measures by CSF t-tau quartile at baseline. Multivariable logistic regression models were used to evaluate if CSF t-tau levels predict non-amnestic presentations controlling for covariates.
Results:
Non-amnestic AD had a higher median CSF t-tau level compared to amnestic-AD (p = 0.014). Each 50 pg/ml increase in CSF t-tau was associated with an increase in the odds of having a non-amnestic presentation (7.4%) and aphasia (10.6 %) as the initial presenting symptom even after taking into account; age, sex, education, APOE ε4, MoCA, and CSF Aβ42. Logopenic AD had higher t-tau and p-tau levels compared to other variants.
Conclusions:
Highly elevated CSF t-tau levels could indicate more cortical involvement presenting with early non-amnestic symptoms in atypical AD subtypes, particularly in the logopenic variant.
Keywords: Alzheimer’s disease, atypical variant, biomarkers, cerebrospinal fluid, cortical atrophy, hippocampal atrophy, mild cognitive impairment, tau
INTRODUCTION
Clinical diagnosis of cognitive impairment from Alzheimer’s disease (AD) has significantly been improved by the availability of biomarkers of underlying AD pathology, including cerebrospinal fluid (CSF) levels of amyloid-β (Aβ)42, total tau (t-tau), and phosphorylated tau (p-tau), magnetic resonance imaging (MRI) volumetric estimation of hippocampal and medial temporal atrophy, and amyloid brain positron emission tomography (PET) imaging [1–3]. These biomarkers are currently used in the clinical criteria for the diagnosis of AD in both the NIA/AA and International Working Group (IWG) criteria [4–6], as well as the ATN biological research classifications [7]. Increasingly, there has been a recognition of significant heterogeneity of clinical phenotypes in AD, with atypical non-amnestic AD presentations formalized in the IWG clinical diagnosis criteria [6]. Consistent with this, pathologic heterogeneity has also been described in AD [8–10], where up to 25% of AD cases do not show the typical distribution of neurofibrillary tangles as expected by Braak sequential staging in the brain [9, 11]. Brain imaging has also noted differences in cortical and hippocampal atrophy patterns among the different AD subtypes [10, 11]. As CSF levels of t-tau protein is thought to reflect the intensity of the neuronal damage, it is possible that very high CSF t-tau levels, compared to moderately elevated levels, could relate to corresponding differences in the degree of cortical atrophy and the clinical, neuroimaging, and neuropathology defined subtypes of AD.
High CSF t-tau levels have been previously related to a faster rate of clinical progression [12–15] and cognitive profiles in AD [16]. However, evaluation of clinical rate of progression has often been limited to the Mini-Mental State Examination (MMSE) scores and therefore had limited patient characterization [12, 17]. The MMSE score, as it is heavily dependent on language skills, is also known to overestimate dementia severity in aphasic patients [17, 18], and thus language variant AD patients could be perceived as having a more rapid rate of decline. We therefore undertook to determine if CSF t-tau levels related to the clinical and neuroimaging phenotypes in AD.
We hypothesized that among biomarker-confirmed AD patients, the phenotype with the highest quartile of CSF t-tau would have a higher likelihood of presenting with non-amnestic cortical symptoms (logopenic, frontal, and posterior variants of AD). We further determined if patients with different AD clinical phenotypes would also have corresponding differences in other CSF biomarkers and radiological and neuropsychological characteristics.
MATERIALS AND METHODS
Participants
This was a retrospective comparative case study approved by the Cleveland Clinic Institutional Review Board. We identified all patients from the Cleveland Clinic Lou Ruvo Center for Brain Health biobank enrolled between January 2013 and March 2018 with a clinical diagnosis of AD supported by AD biomarkers (Aβ42, t-tau, p-tau) [4, 5]. Ninety-seven patients met the above criteria; of these, 54 patients were evaluated less than 2 years from symptom onset. Reversible causes of cognitive impairment and other common mimickers of dementia (nutritional deficiencies, endocrine disorders, stroke, paraneoplastic process tumor, hemorrhage) were ruled out as the primary etiology of their dementing process. Clinical consensus with a neuropsychologist (ABJ) and two behavioral neurologists (JAP, JBL), blinded to the CSF results, categorized patients into typical and atypical AD based on the IWG-2 research diagnostic criteria [6], including typical amnestic AD n = 69, and atypical AD subtypes including logopenic AD n = 17, posterior-biparietal AD n = 4, and frontal AD n = 4. Patients diagnosed as Lewy body variant of AD (n = 4) were excluded from further analysis
CSF biomarkers of AD
CSF was collected after lumbar puncture between 9am and 11am following standard clinical protocols in polypropylene test tubes, and frozen within 30 min of collection and shipped frozen for further analysis. Presence of biomarkers supporting AD was confirmed by a commercially available test via Athena Diagnostics (Marlborough, MA). The ADmark® Alzheimer’s evaluation uses sandwich Enzyme Linked Immunosorbant Assay (ELISA) kits [Innotest β-amyloid[1–42], Innotest hTAU-Ag, Innotest Phospho-Tau[181P], Innogenetics, Ghent, Belgium], the characteristics of which have been previously published [19–21]. These tests measure CSF levels of Aβ42, t-tau, and p-tau levels, respectively. Patients were labeled as the ‘high tau’ group if they had t-tau in the highest quartile for this cohort (≥960 pg/ml). The possibility of an underlying prion etiology was ruled out on all CSF samples meeting high tau criteria by RT-QuIC analysis as previously described [16].
Cognitive assessment
The majority of patients (n = 94 out of 97) underwent Montreal Cognitive Assessment (MoCA) [22] at baseline, which was therefore included in the primary analysis. Thirty-two patients (n = 8 in high t-tau quartile) completed more detailed neuropsychological assessment and were therefore evaluated in an exploratory analysis due to the smaller number. The cognitive tests in this subset of patients included: a prose memory test (Logical Memory subtest of WMS-IV), a word list memory test (either Rey Auditory Verbal Learning Test, Hopkins Verbal Learning Test, or California Verbal Learning Test), confrontation naming (Boston Naming Test), lexical and semantic verbal fluency, verbal abstract reasoning (Similarities subtest of WAIS-IV), angle estimation (Judgment of Line Orientation), and visuoconstruction (Block Design subtest of WAIS-IV).
MRI brain volumetric analysis
Of the total 97, 51 patients had in-house MRI brain scans using a 20-channel receive-only head/neck coil on a Siemens Skyra (Erlangen, Germany) on a 12-channel receive only head coil on a Siemens TIM Trio 3T MRI scanner. Volumetric data were derived using a volumetric T1 MPRAGE sequence from the Alzheimer’s Disease Neuroimaging Initiative (ADNI) protocol [23] with one of the following sets of parameters (slightly varying depending on the MRI): (1) 176 coronal slices; thickness 1.2 mm; FOV 256 × 240 mm; TI/TE/TR/flip angle, 900/2.98/2300.0 ms/9°; matrix 256 × 256; BW 240 Hz/Px, voxel size = 1.0 × 1.0 × 1.2 mm. (2) 176 coronal slices; thickness 1.2 mm; FOV 256 × 256 mm; TI/TE/TR/flip angle, 900/2.77/2300.0 ms/9°; matrix 192×192; BW 240 Hz/Px, voxel size = 1.3 × 1.3 × 1.2 mm. T1-weighted volumetric images were processed using the NeuroQuant™ software (Cortech Labs Inc, La Jolla, California). Manual image correction and quality control procedures were conducted during image processing to avoid segmentation errors.
APOE status
APOE status was determined by using genomic DNA extracted from whole blood. Briefly, 10 ng DNA of each subject was analyzed by TaqMan allelic discrimination detection of SNPs that discriminate the APOE ε4, ε3, and ε2 alleles (rs429358, rs7412) (Life Technologies). Allelic discrimination analyses were carried out using a 9700 Gene Amp PCR System (Applied Biosystems, CA) and an end-point read in a 7500 Real-Time PCR System (Applied Biosystems, CA).
Statistical analysis
In order to evaluate the impact of CSF biomarker levels of t-tau on clinical phenotypes across the whole range, we grouped them by quartiles. After checking for normality of data, analysis of variance tests (ANOVA) was used to compare the quartiles on continuous variables. The nonparametric statistical test, Kurskal Wallis was used to establish significant group differences when appropriate. Differences in categorical variables between groups were assessed with χ2 test. Pearson correlation was used to check for the degree of expected correlation between CSF t-tau and p-tau levels. As CSF t-tau and p-tau were significantly correlated (ρ = 0.90, p < 0.0001), only the t-tau levels were used in additional model calculations to avoid multicollinearity. To evaluate if t-tau (as a continuous variable) could be a factor in predicting atypical AD phenotype (all non-amnestic presentations or aphasia) our multivariable logistic regression model included age, sex, education, MoCA score, APOE ε4 status, CSF Aβ42, and t-tau as independent variables and non-amnestic presentation present/absent (model 1) and aphasia relating to a logopenic variant present/absent (model 2) as the dependent variable. Statistical analyses were performed using SPSS ™ (Chicago, IL) and R3.5.2 statistical software packages.
RESULTS
Among all patients in the cohort, non-amnestic AD had a higher median CSF t-tau level compared to amnestic-AD (p = 0.014) (Fig. 1). When the data was next analyzed by quartiles, we did not observe a significant difference in age, sex, APOE ε4, MoCA scores, or duration of symptoms across the t-tau quartiles (Table 1). The t-tau quartiles differed in the frequency of aphasia as a frequent early clinical sign (χ2 = 11.3, p = 0.01).
Fig. 1.
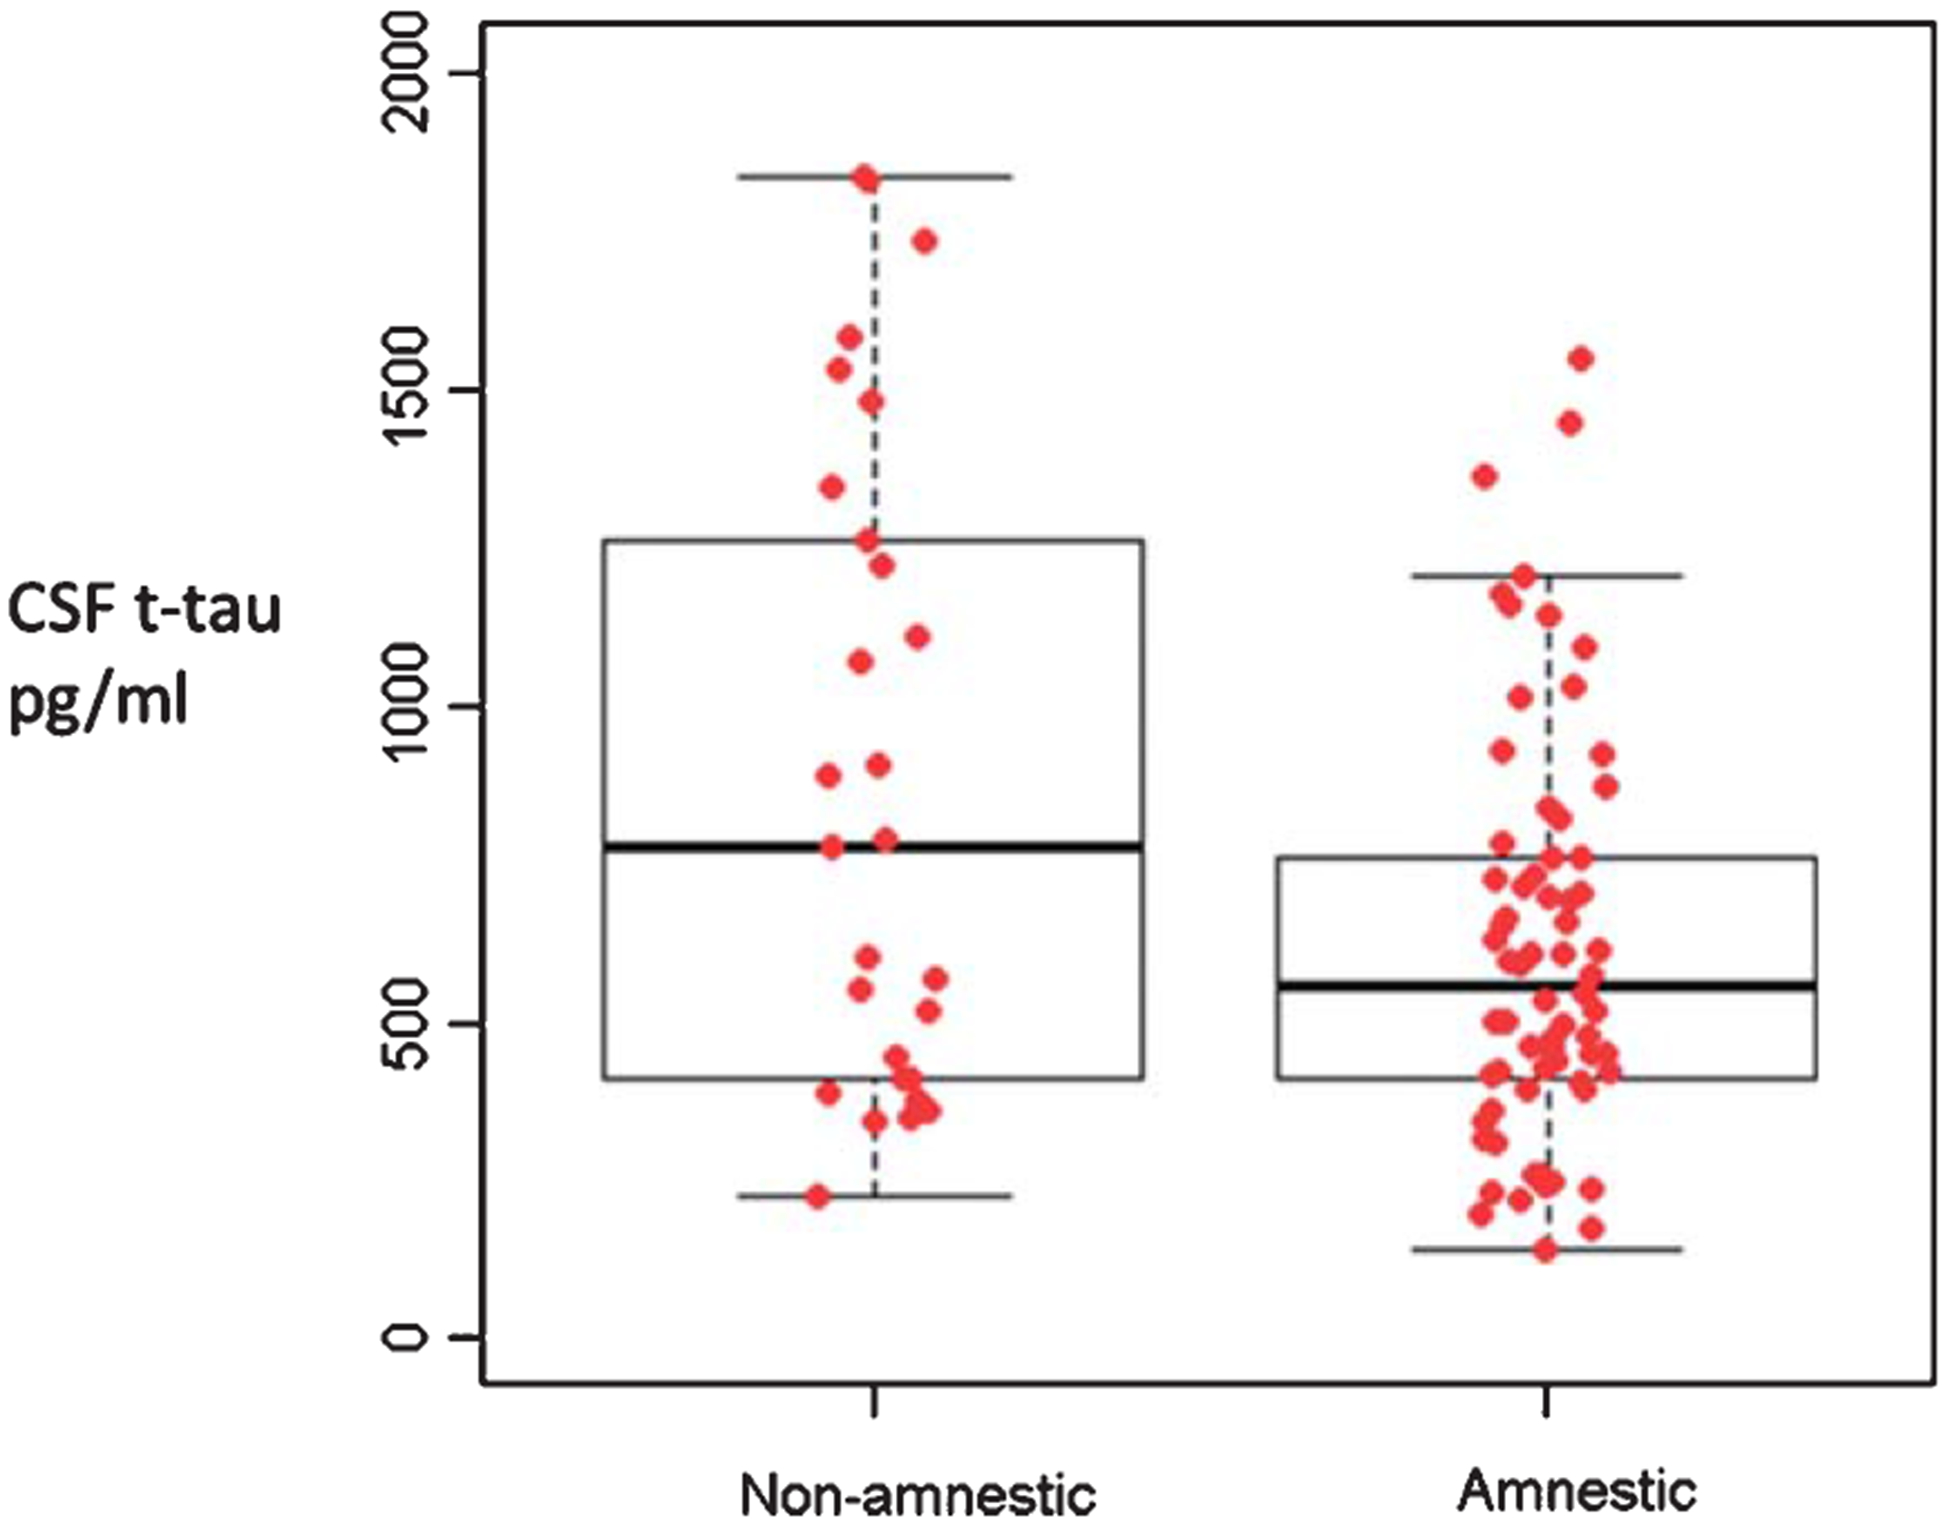
Median and range of total tau levels in amnestic (n = 69) and non-amnestic (n = 27) clinical presentations of Alzheimer’s disease. Mann Whitney p = 0.014. [The box notes values between 25th percentile and 75th percentile. Midline marks the median and the whiskers extend to 1.5 times the height of the box].
Table 1.
Demographics and pertinent clinical variables
| t-tau quartile 1 | t-tau quartile 2 | t-tau quartile 3 | t-tau quartile 4 | F/χ2 | P | |
|---|---|---|---|---|---|---|
| Number of patients | 25 | 24 | 24 | 24 | ||
| Age, y | 67.32 (5.6) | 64.46 (6.6) | 66.5(8.4) | 68.2(8.8) | 1.09 | 0.35 |
| Sex, %F | 52% | 37.5% | 54.1% | 66.6% | 4.12 | 0.24 |
| Education, y | 15.3 (2.8) | 15.1 (2.9) | 14.9(3.6) | 13.8(1.9) | 1.39 | 0.25 |
| APOE ε4% | 64% | 75% | 66.6% | 50% | 2.86 | 0.41 |
| Duration of symptoms, y | 3 (2.3) | 2.7 (1.5) | 2.9 (1.3) | 2.3 (0.9) | 1.06 | 0.36 |
| MOCA | 15.8 (5.4) | 18.38 (4.3) | 16.24 (6.1) (n = 21) | 14.08 (6.2) | 2.42 | 0.07 |
| CSF Aβ42 | 213.9 (73) | 258.8 (74.8) | 285.9 (82.8) | 315.8(123.5) | 5.57 | 0.001 |
| CSF t-tau | 302.9 (79.8) | 487.06 (55.2) | 718.5 (87.8) | 1303.2 (277.2) | 196.94 | 0.0001 |
| CSF p-tau | 55.8(11.8) | 78.3 (8.7) | 98.9 (16.5) | 142.9 (40) | 64.35 | 0.001 |
| % non-amnestic presentation | 24% | 20.8% | 16.6% | 52.1% | 8.9 | 0.03 |
| % logopenic aphasia | 4.1% | 16.6% | 8.3% | 43.4% | 15.17 | 0.002 |
CSF Aβ42, t-tau, and p-tau in pg/ml, t-tau quartile 4: ‘High tau’ ≥960 pg/ml. t-tau quartile 1: ≤411 pgm/ml.
In a secondary analysis, limited to the 54 patients who were evaluated within 2 years of symptom onset, there were 17 patients in the revised highest t-tau quartile. The results across all clinical variables of interest for the entire cohort noted previously were similar in the patients with symptoms onset within 2 years (detailed analysis not presented). As in the full cohort, those within the highest quartile t-tau group within two years of symptom onset again had a significantly higher frequency of non-amnestic presentations (χ2 = 10.1, p = 0.002) and aphasia as an early clinical sign compared to the rest (χ2 = 13.3, p < 0.0001).
CSF AD biomarker differences between AD variants
When comparing the mean CSF t-tau levels between the AD variants (amnestic, logopenic, posterior-biparietal, frontal/executive), when all subjects were considered, mean CSF t-tau levels between the AD variants reached threshold of significance (Kruskal Wallis p = 0.05), but there were no differences in p-tau (p = 0.13) (Fig. 2) or Aβ42 levels (data not shown) (p = 0.11). There was a significantly lower frequency of amnestic AD patients in the ‘high t-tau’ quartile (χ2 = 10.7, p = 0.013) with no differences in the frequency of other AD variants. When patients within two years of symptoms onset were considered alone, there were significant differences between the AD variants in t-tau (Kruskal Wallis p = 0.006) and p-tau (p = 0.006) levels (Fig. 3) but not Aβ42 levels (data not shown) (p = 0.078).
Fig. 2.
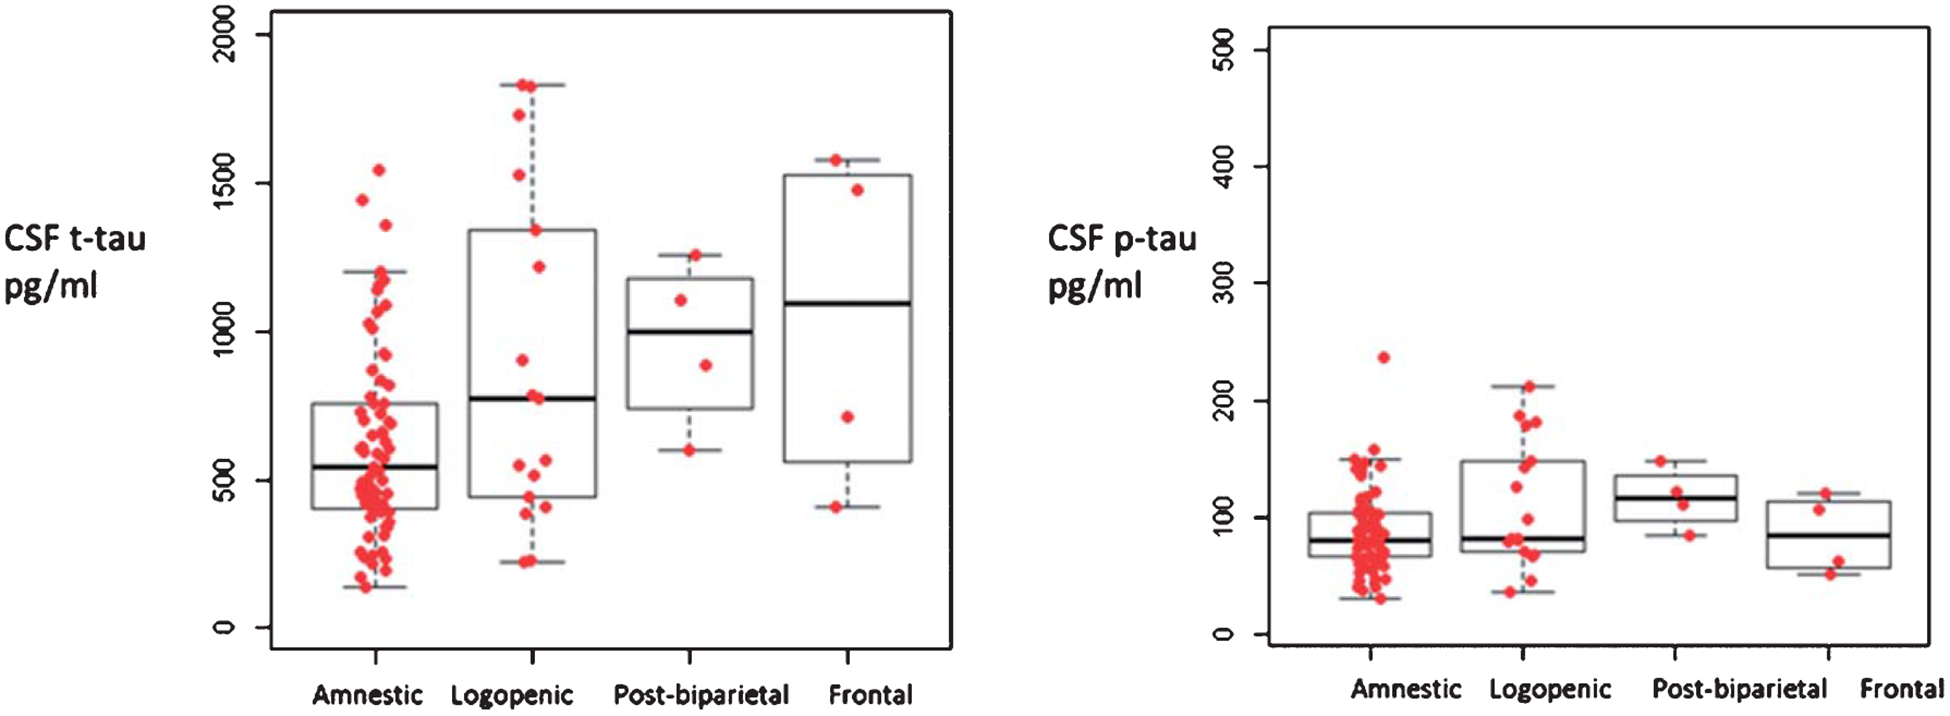
Median values of total tau and p-tau levels in AD patients with varying disease duration, Amnestic, n = 69, logopenic variant, n = 17, posterior-biparietal, n = 4, Frontal/executive n = 4. Independent samples Kruskal Wallis test p = 0.05 for t-Tau, p = 0.138 for pTau. [The box notes values between 25th percentile and 75th percentile. Midline marks the median and the whiskers extend to 1.5 times the height of the box].
Fig. 3.
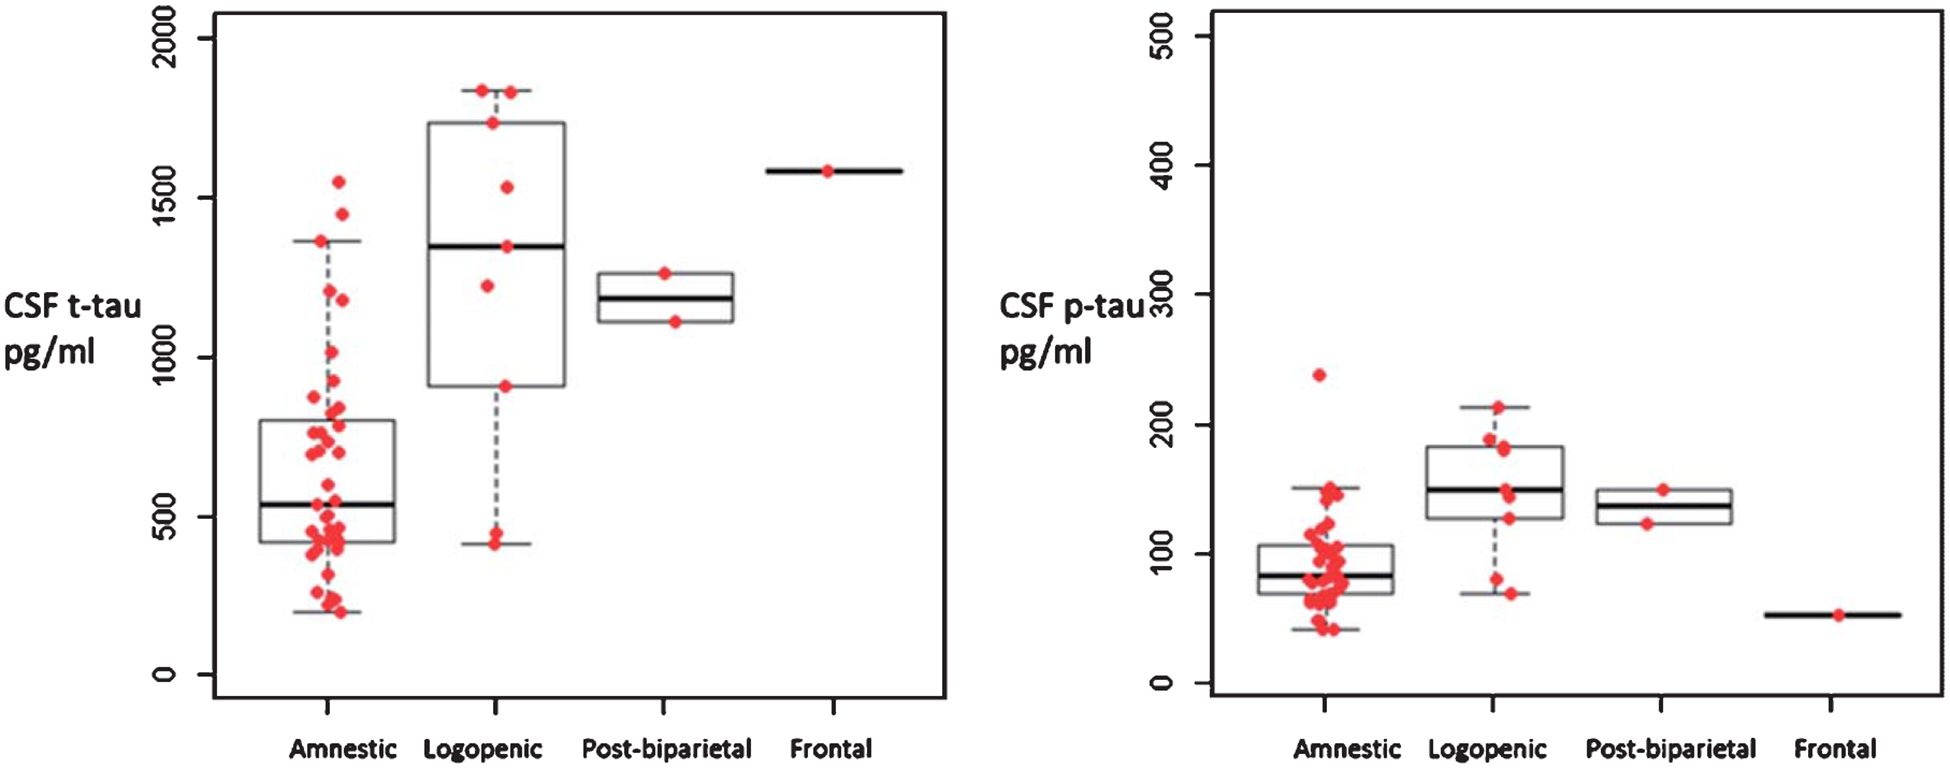
Median values of total tau and p-tau levels in AD variants within two years of symptom onset, Amnestic, n = 39, logopenic variant, n = 9, posterior-biparietal, n = 2, Frontal/executive n = 1. Independent samples Kruskal Wallis test p = 0.006 for t-Tau, and p-Tau. [The box notes values between 25th percentile and 75th percentile. Midline marks the median and the whiskers extend to 1.5 times the height of the box].
Prediction models
In the multivariate logistic regression model 1, each 50 pg/ml increase in CSF t-tau was associated with a 7.4% increase in the odds of having a non-amnestic presentation. Similar results were noted in model 2, where each 50 pg/ml increase in CSF t-tau was associated with a 10.6% increase in the odds of having aphasia as an initial clinical presentation (Table 2).
Table 2.
Logistic regression analysis with models predicting non-amnestic presentation (model 1) and logopenic variant (model 2) with age, sex, education, MoCA score, APOE ε4 status, CSF Aβ42 and t-tau as independent variables
| Model 1 | Estimate Std. | Error | z value | P |
|---|---|---|---|---|
| (Intercept) | −0.95 | 2.99 | −0.32 | 0.75 |
| Age | −0.002 | 0.038 | −0.053 | 0.96 |
| Sex | 0.19 | 0.54 | 0.35 | 0.73 |
| Education | 0.075 | 0.10 | 0.72 | 0.47 |
| APOE ε4 | −0.90 | 0.59 | −1.53 | 0.13 |
| MoCA | 0.016 | 0.053 | 0.30 | 0.77 |
| CSFAβ42 | −0.0053 | 0.0031 | −1.70 | 0.09 |
| CSF t-tau | 0.0015 | 0.00069 | 2.25 | 0.025* |
| Model 2 | Estimate Std. | Error | z value | P |
| (Intercept) | −2.84 | 3.95 | −0.72 | 0.47 |
| Age | −0.0015 | 0.045 | −0.30 | 0.98 |
| Sex | 0.18 | 0.72 | 0.25 | 0.81 |
| Education | 0.11 | 0.14 | 0.81 | 0.42 |
| APOE ε4 | −1.02 | 0.78 | −1.31 | 0.19 |
| MoCA | 0.0078 | 0.072 | 0.11 | 0.91 |
| CSF Aβ42 | −0.0077 | 0.0042 | −1.83 | 0.067 |
| CSF t-Tau | 0.0022 | 0.00084 | 2.68 | 0.0075* |
p < 0.05.
Neuropsychology score differences between AD variants
An exploratory analysis comparing performance of ‘highest t-tau’ quartile compared to others was done among the 32 patients (8 high tau) who underwent more detailed cognitive assessments. There was a significant between-group difference with the high t-tau group performing worse on the verbal abstraction measure (WAIS-IV Similarities) (t (30) = 2.25, p = 0.03). A trend-level effect with worse non-verbal delayed recall (p = 0.06) was also noted. No other comparisons reached statistical significance.
On more detailed evaluation of MoCA scores which most patients completed, the ‘high t-tau’ quartile performed significantly worse than others across a range of MoCA subtests including, clock drawing (t(90) = 2.9, p = 0.005), vigilance (t(90) = 2.64, p = 0.01), serial 7 s (t(90) = 2.32, p = 0.02), and lexical fluency (t(89) = 2.06, p = 0.04), as well as a trend-level effect (p = 0.06) for sentence repetition. Comparison of the highest versus lowest tau quartile groups on the total MoCA scores also revealed a trend-level between-groups difference (t (106) = 1.87, p = 0.064), with the low tau group performing 2 points higher (M = 16.94) than the high tau group (M = 14.91).
MRI brain volumetric measures in relation to CSF t-tau and p-tau levels
In an exploratory analysis, we evaluated the correlations between MRI volumetric measures and CSF t-tau and p-tau values among the 54 patients who had concomitant MRI volumetric measures. There were no significant correlations between MRI measures of hippocampal and cortical volumes corrected for ICV and CSF t-tau and p-tau values. There were small but consistent negative correlations noted between CSF p-tau and left (ρ = −0.32, p = 0.019) and right inferior lateral ventricles (ρ = −0.33, p = 0.014), which did not meet statistical significance threshold at p = 0.05 with CSF t-tau (left: ρ = −0.25 p = 0.06, right: ρ = −0.23 p = 0.08).
DISCUSSION
Among the patients with clinical and biomarkers supportive of underlying AD, those patients within the highly elevated CSF t-tau levels in our cohort (with the highest tau quartile) had a higher likelihood of non-amnestic presentations (frontal/executive, logopenic, posterior-biparietal). Logopenic variant of AD was the most common of the AD subtype among the non-amnestic presentations noted in the highest tau group. A key inference from these results is that highly elevated CSF t-tau, implying more neuronal loss, is related to a higher likelihood of more extensive cortical changes as noted in the preponderance of cortical symptoms at initial presentation. The negative correlations between CSF p-tau levels and inferior lateral ventricle volume also raises the possibility of more extensive neuronal loss beyond the medial temporal regions in the high-tau cases. This is supported by recent studies on Tau PET imaging which have also noted the magnitude of cortical atrophy was associated closely with that of [18F] AV-1451 binding [24, 25]. Future studies into potential differences in diffusion characteristics of tau among the different clinical phenotypes relating to regional neuropathology is also warranted.
Prior studies evaluating CSF t-tau levels in atypical AD variants compared mean values alone and did not find significant mean group differences across all atypical AD variants [26, 27]. We note that in the above studies, even as the range of t-tau was comparable with the current report, analysis by quartiles was not done to see if higher tau quartiles had a higher frequency of atypical AD variants as in the current study. Higher mean CSF tau levels have also been reported in the frontal variant AD than in posterior cortical atrophy (PCA) for both t-tau and p-tau with intermediate levels in the logopenic variant AD (n = 11) [27] and in typical AD than PCA [28]. Concentrations of CSF tau have also been noted to decline in the later stages of the AD process [29]. This raises the possibility that highly elevated CSF tau levels could be likely noted in the earlier stages of symptoms in the cortical variants of AD accounting for the differences among the cohorts or that PCA has a distinct biomarker profile. We also note that the relationship of the high CSF t-tau and p-tau to non-amnestic AD was most striking in our subgroup analysis of subjects with less than two years of symptom duration. This has not been previously reported.
Previous studies have also reported highly elevated CSF t-tau levels as a marker of more severe cognitive impairment [13, 14, 28–30], rapidly progressive AD [12, 17], conversion to moderate dementia [31] and early nursing home placement [32]. Our results complement these results by describing the higher frequency of atypical AD clinical phenotypes with cortical predominant symptoms among highly elevated CSF t-tau patients who are therefore likely to have more severe functional deficits accounting for these results. This may be due in part to often more impairment on cognitive testing, when language impairment is an early prominent issue.
Strengths and limitations
A cross-sectional approach was used based on a scientifically sound rationale that CSF levels of t-tau protein are thought to reflect the intensity of the neuronal damage in neurodegeneration and are therefore likely to reflect the extent of cortical involvement at least in earlier stages of AD. The smaller number of patients in this retrospective study of highly elevated CSF t-tau patients is representative of the frequency of these cases in a tertiary memory clinic. However, given the nature of the frequency of atypical presentations and that they are often missed in longitudinal studies like the ADNI, the current study enriches our understanding of AD pathophysiology among a wider spectrum of AD patients in the community. Another limitation is the lack of detailed longitudinal follow up at predefined time points for cognitive and functional assessments, as well as the lack of formal activities of daily living and behavior assessments due to the limitations of the clinical populations. There is, therefore, a clear and critical need for a systematic prospective follow-up to see if rapid clinical progression in AD is related to elevated CSF t-tau and distinct AD subtypes.
Summary
Highly elevated CSF t-tau levels could be a surrogate biomarker for more cortical involvement presenting with early non-amnestic symptoms including aphasia in early symptomatic stages of atypical AD subtypes.
ACKNOWLEDGMENTS
The Jane and Lee Seidman Fund, JAP: K23AG055685-01.
Footnotes
Authors’ disclosures available online (https://www.j-alz.com/manuscript-disclosures/19-0519).
REFERENCES
- [1].Jack CR Jr, Dickson DW, Parisi JE, Xu YC, Cha RH, O’Brien PC, Edland SD, Smith GE, Boeve BF, Tangalos EG, Kokmen E, Petersen RC (2002) Antemortem MRI findings correlate with hippocampal neuropathology in typical aging and dementia. Neurology 58, 750–757. [DOI] [PMC free article] [PubMed] [Google Scholar]
- [2].Whitwell JL, Josephs KA, Murray ME, Kantarci K, Przybelski SA, Weigand SD, Vemuri P, Senjem ML, Parisi JE, Knopman DS, Boeve BF, Petersen RC, Dickson DW, Jack CR Jr (2008) MRI correlates of neurofibrillary tangle pathology at autopsy: A voxel-based morphometry study. Neurology 71, 743–749. [DOI] [PMC free article] [PubMed] [Google Scholar]
- [3].Dubois B, Feldman HH, Jacova C, Dekosky ST, Barberger-Gateau P, Cummings J, Delacourte A, Galasko D, Gauthier S, Jicha G, Meguro K, O’brien J, Pasquier F, Robert P, Rossor M, Salloway S, Stern Y, Visser PJ, Scheltens P (2007) Research criteria for the diagnosis of Alzheimer’s disease: Revising the NINCDS-ADRDA criteria. Lancet Neurol 6, 734–746. [DOI] [PubMed] [Google Scholar]
- [4].McKhann GM, Knopman DS, Chertkow H, Hyman BT, Jack CR Jr, Kawas CH, Klunk WE, Koroshetz WJ, Manly JJ, Mayeux R, Mohs RC, Morris JC, Rossor MN, Scheltens P, Carrillo MC, Thies B, Weintraub S, Phelps CH (2011) The diagnosis of dementia due to Alzheimer’s disease: Recommendations from the National Institute on Aging-Alzheimer’s Association workgroups on diagnostic guidelines for Alzheimer’s disease. Alzheimers Dement 7, 263–269. [DOI] [PMC free article] [PubMed] [Google Scholar]
- [5].Albert MS, DeKosky ST, Dickson D, Dubois B, Feldman HH, Fox NC, Gamst A, Holtzman DM, Jagust WJ, Petersen RC, Snyder PJ, Carrillo MC, Thies B, Phelps CH (2011) The diagnosis of mild cognitive impairment due to Alzheimer’s disease: Recommendations from the National Institute on Aging-Alzheimer’s Association workgroups on diagnostic guidelines for Alzheimer’s disease. Alzheimers Dement 7, 270–279. [DOI] [PMC free article] [PubMed] [Google Scholar]
- [6].Dubois B, Feldman HH, Jacova C, Hampel H, Molinuevo JL, Blennow K, DeKosky ST, Gauthier S, Selkoe D, Bateman R, Cappa S, Crutch S, Engelborghs S, Frisoni GB, Fox NC, Galasko D, Habert MO, Jicha GA, Nordberg A, Pasquier F, Rabinovici G, Robert P, Rowe C, Salloway S, Sarazin M, Epelbaum S, de Souza LC, Vellas B, Visser PJ, Schneider L, Stern Y, Scheltens P, Cummings JL (2014) Advancing research diagnostic criteria for Alzheimer’s disease: The IWG-2 criteria. Lancet Neurol 13, 614–629. [DOI] [PubMed] [Google Scholar]
- [7].Jack CR Jr, Bennett DA, Blennow K, Carrillo MC, Dunn B, Haeberlein SB, Holtzman DM, Jagust W, Jessen F, Karlawish J, Liu E, Molinuevo JL, Montine T,Phelps C, Rankin KP, Rowe CC, Scheltens P, Siemers E, Snyder HM, Sperling R; Contributors (2018) NIA-AA Research Framework: Toward a biological definition of Alzheimer’s disease. Alzheimers Dement 14, 535–562. [DOI] [PMC free article] [PubMed] [Google Scholar]
- [8].Cummings JL (2000) Cognitive and behavioral heterogeneity in Alzheimer’s disease: Seeking the neurobiological basis. Neurobiol Aging 21, 845–861. [DOI] [PubMed] [Google Scholar]
- [9].Murray ME, Graff-Radford NR, Ross OA, Petersen RC, Duara R, Dickson D (2011) Neuropathologically defined subtypes of Alzheimer’s disease with distinct clinical characteristics: A retrospective study. Lancet Neurol 10, 785–796. [DOI] [PMC free article] [PubMed] [Google Scholar]
- [10].Whitwell JL, Dickson DW, Murray ME, Weigand SD, Tosakulwong N, Senjem ML, Knopman DS, Boeve BF, Parisi JE, Petersen RC, Jack CR Jr, Josephs KA (2012) Neuroimaging correlates of pathologically defined subtypes of Alzheimer’s disease: A case-control study. Lancet Neurol 11, 868–877. [DOI] [PMC free article] [PubMed] [Google Scholar]
- [11].Risacher SL, Anderson WH, Charil A, Castelluccio PF, Shcherbinin S, Saykin AJ, Schwarz AJ; Alzheimer’s Disease Neuroimaging Initiative (2017) Alzheimer disease brain atrophy subtypes are associated with cognition and rate of decline. Neurology 89, 2176–2186. [DOI] [PMC free article] [PubMed] [Google Scholar]
- [12].Kester MI, van der Vlies AE, Blankenstein MA, Pijnenburg YA, van Elk EJ, Scheltens P, van der Flier WM (2009) CSF biomarkers predict rate of cognitive decline in Alzheimer disease. Neurology 73, 1353–1358. [DOI] [PubMed] [Google Scholar]
- [13].Sämgård K, Zetterberg H, Blennow K, Hansson O, Minthon L, Londos E (2010) Cerebrospinal fluid total tau as a marker of Alzheimer’s disease intensity. Int J Geriatr Psychiatry 25, 403–410. [DOI] [PubMed] [Google Scholar]
- [14].Wallin AK, Blennow K, Zetterberg H, Londos E, Minthon L, Hansson O (2010) CSF biomarkers predict a more malignant outcome in Alzheimer disease. Neurology 74, 1531–1537. [DOI] [PubMed] [Google Scholar]
- [15].van der Vlies AE, Verwey NA, Bouwman FH, Blankenstein MA, Klein M, Scheltens P, van der Flier WM (2009) CSF biomarkers in relationship to cognitive profiles in Alzheimer disease. Neurology 72, 1056–1061. [DOI] [PubMed] [Google Scholar]
- [16].Cohen ML, Kim C, Haldiman T, ElHag M, Mehndiratta P, Pichet T, Lissemore F, Shea M, Cohen Y, Chen W, Blevins J, Appleby BS, Surewicz K, Surewicz WK, Sajatovic M, Tatsuoka C, Zhang S, Mayo P, Butkiewicz M, Haines JL, Lerner AJ, Safar JG (2015) Rapidly progressive Alzheimer’s disease features distinct structures of amyloid-β. Brain 138, 1009–1022. [DOI] [PMC free article] [PubMed] [Google Scholar]
- [17].Pillai JA, Appleby BS, Safar J, Leverenz JB (2018) Rapidly progressive Alzheimer’s disease in two distinct autopsy cohorts. J Alzheimers Dis 64, 973–980. [DOI] [PMC free article] [PubMed] [Google Scholar]
- [18].Osher JE, Wicklund AH, Rademaker A, Johnson N, Weintraub S (2007) The mini-mental state examination in behavioral variant frontotemporal dementia and primary progressive aphasia. Am J Alzheimers Dis Other Demen 22, 468–473. [DOI] [PMC free article] [PubMed] [Google Scholar]
- [19].Hulstaert F, Blennow K, Ivanoiu A, Schoonderwaldt HC, Riemenschneider M, De Deyn PP, Bancher C, Cras P, Wilt-fang J, Mehta PD, Iqbal K, Pottel H, Vanmechelen E, Vanderstichele H (1999) Improved discrimination of AD patients using beta-amyloid(1–42) and tau levels in CSF. Neurology 52, 1555–1562. [DOI] [PubMed] [Google Scholar]
- [20].Hansson O, Zetterberg H, Buchhave P, Londos E, Blennow K, Minthon L (2006) Association between CSF biomarkers and incipient Alzheimer’s disease in patients with mild cognitive impairment: A follow-up study. Lancet Neurol 5, 228–234. [DOI] [PubMed] [Google Scholar]
- [21].Teng E, Yamasaki TR, Tran M, Hsiao JJ, Sultzer DL, Mendez MF (2014) Cerebrospinal fluid biomarkers in clinical subtypes of early-onset Alzheimer’s disease. Dement Geriatr Cogn Disord 37, 307–314. [DOI] [PMC free article] [PubMed] [Google Scholar]
- [22].Nasreddine ZS, Phillips NA, Bédirian V, Charbonneau S, Whitehead V, Collin I, Cummings JL, Chertkow H (2005) The Montreal Cognitive Assessment, MoCA: A brief screening tool for mild cognitive impairment. J Am Geriatr Soc 53, 695–699. [DOI] [PubMed] [Google Scholar]
- [23].Jack CR Jr, Bernstein MA, Fox NC, Thompson P, Alexander G, Harvey D, Borowski B, Britson PJ, L Whitwell J, Ward C, Dale AM, Felmlee JP, Gunter JL, Hill DL, Killiany R, Schuff N, Fox-Bosetti S, Lin C, Studholme C, DeCarli CS, Krueger G, Ward HA, Metzger GJ, Scott KT, Mallozzi R, Blezek D, Levy J, Debbins JP, Fleisher AS, Albert M, Green R, Bartzokis G, Glover G, Mugler J, Weiner MW (2008) The Alzheimer’s Disease Neuroimaging Initiative (ADNI): MRI methods. J Magn Reson Imaging 27, 685–691. [DOI] [PMC free article] [PubMed] [Google Scholar]
- [24].Xia C, Makaretz SJ, Caso C, McGinnis S, Gomperts SN, Sepulcre J, Gomez-Isla T, Hyman BT, Schultz A, Vasdev N, Johnson KA, Dickerson BC (2017) Association of in vivo [18F]AV-1451 tau PET imaging results with cortical atrophy and symptoms in typical and atypical Alzheimer disease. JAMA Neurol 74, 427–436. [DOI] [PMC free article] [PubMed] [Google Scholar]
- [25].Ossenkoppele R, Schonhaut DR, Schöll M, Lockhart SN, Ayakta N, Baker SL, O’Neil JP, Janabi M, Lazaris A, Cantwell A, Vogel J, Santos M, Miller ZA, Bettcher BM, Vossel KA, Kramer JH, Gorno-Tempini ML, Miller BL, Jagust WJ, Rabinovici GD (2016) Tau PET patterns mirror clinical and neuroanatomical variability in Alzheimer’s disease. Brain 139, 1551–1567. [DOI] [PMC free article] [PubMed] [Google Scholar]
- [26].Ossenkoppele R, Mattsson N, Teunissen CE, Barkhof F, Pijnenburg Y, Scheltens P, van der Flier WM, Rabinovici GD (2015) Cerebrospinal fluid biomarkers and cerebral atrophy in distinct clinical variants of probable Alzheimer’s disease. Neurobiol Aging 36, 2340–2347. [DOI] [PMC free article] [PubMed] [Google Scholar]
- [27].Paterson RW, Toombs J, Slattery CF, Nicholas JM, Andreasson U, Magdalinou NK, Blennow K, Warren JD, Mummery CJ, Rossor MN, Lunn MP, Crutch SJ, Fox NC, Zetterberg H, Schott JM (2015) Dissecting IWG-2 typical and atypical Alzheimer’s disease: Insights from cerebrospinal fluid analysis. J Neurol 262, 2722–2730. [DOI] [PubMed] [Google Scholar]
- [28].Wellington H, Paterson RW, Suárez-González A, Poole T, Frost C, Sjöbom U, Slattery CF, Magdalinou NK, Lehmann M, Portelius E, Fox NC, Blennow K, Zetterberg H, Schott JM (2018) CSF neurogranin or tau distinguish typical and atypical Alzheimer disease. Ann Clin Transl Neurol 5, 162–171. [DOI] [PMC free article] [PubMed] [Google Scholar]
- [29].Seppälä TT, Koivisto AM, Hartikainen P, Helisalmi S, Soininen H, Herukka SK (2011) Longitudinal changes of CSF biomarkers in Alzheimer’s disease. J Alzheimers Dis 25, 583–594. [DOI] [PubMed] [Google Scholar]
- [30].Degerman Gunnarsson M, Lannfelt L, Ingelsson M, Basun H, Kilander L (2014) High tau levels in cerebrospinal fluid predict rapid decline and increased dementia mortality in Alzheimer’s disease. Dement Geriatr Cogn Disord 37, 196–206. [DOI] [PubMed] [Google Scholar]
- [31].Vemuri P, Wiste HJ, Weigand SD, Shaw LM, Trojanowski JQ, Weiner MW, Knopman DS, Petersen RC, Jack CR Jr; Alzheimer’s Disease Neuroimaging Initiative (2009) MRI and CSF biomarkers in normal, MCI, and AD subjects: Predicting future clinical change. Neurology 73, 294–301. [DOI] [PMC free article] [PubMed] [Google Scholar]
- [32].Degerman Gunnarsson M, Ingelsson M, Blennow K, Basun H, Lannfelt L, Kilander L (2016) High tau levels in cerebrospinal fluid predict nursing home placement and rapid progression in Alzheimer’s disease. Alzheimers Res Ther 8, 22. [DOI] [PMC free article] [PubMed] [Google Scholar]