

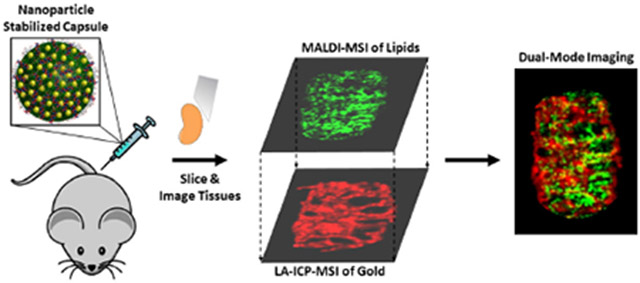
Abstract
Nanomaterial-based drug delivery vehicles are able to deliver therapeutics in a controlled, targeted manner. Currently, however, there are limited analytical methods that can detect both nanomaterial distributions and their biochemical effects concurrently. In this study, we demonstrate that matrix assisted laser desorption/ionization mass spectrometry imaging (MALDI-MSI) and laser ablation inductively coupled plasma mass spectrometry imaging (LA-ICP-MSI) can be used together to obtain nanomaterial distributions and biochemical consequences. These studies employ nanoparticle-stabilized capsules (NPSCs) loaded with siRNA as a testbed. MALDI-MSI experiments on spleen tissues from intravenously injected mice indicate that NPSCs loaded with TNF-a-specific siRNA cause changes to lipid composition in white pulp regions of the spleen, as anticipated, based on pathways known to be affected by TNF-a, whereas NPSCs loaded with scrambled siRNA do not cause the predicted changes. Interestingly, FA-ICP- MSI experiments reveal that the NPSCs primarily localize in the red pulp, suggesting that the observed changes in lipid composition are due to diffusive rather than localized effects on TNF-α production. Such information is only accessible by combining data from the two modalities, which we accomplish by using the heme signals from MAFDI-MSI and Fe signals from FA-ICP-MSI to overlay the images. Several unexpected changes in lipid composition also occur in regions where the NPSCs are found, suggesting that the NPSCs themselves can influence tissue biochemistry as well.
Graphical Abstract
Introduction:
Nanomaterials have been widely employed over the past two decades for therapeutic delivery1 due to their tunable size, structure, and physical properties.2 Nanomaterial-based drug delivery systems, generally directed by macromolecular self-assembly, provide a great deal of tunability for delivery purposes.3 Nanoparticles (NPs) can be designed to carry drugs/cargo either on their surfaces or in their interiors.4 Other molecules, such as lipids, can be incorporated to improve cargo loading.5,6 The versatility of these systems allows for delivery of a range of therapeutic cargos, including siRNA.7–9 hydrophobic drugs,10,11 proteins,12 and combination therapies,13,14 often at safer and more effective dosages than those used for the corresponding therapeutics alone.4 While nano-based delivery systems have great potential, there is a need for analytical tools to map their biodistributions and the biochemical changes they may cause in vivo to fully assess their effectiveness.
Obtaining site-specific information about carriers and their biochemical effects is challenging. Fluorescence microscopy is the most commonly utilized technique for evaluating the biodistribution of nano-based delivery vehicles because of its accessibility and excellent spatial resolution. This technique, however, is limited in its ability to identify biochemical changes, and some nanomaterials do not readily lend themselves to being tracked by fluorescence. Liquid chromatography coupled with mass spectrometry (LC-MS) is a powerful tool to determine biochemical changes that arise upon injection of nano-based drug delivery systems,15 but LC-MS does not readily provide spatial information. Spatial context is essential for understanding the direct and indirect biochemical effects of the nanocarrier in relation to its distribution. Sub-organ distributions in the liver and spleen, for example, can reveal how the reticuloendothelial system responds to the presence of nanomaterials.16,17
Mass spectrometry imaging (MSI) has the potential to provide needed site-specific information for nano-based drug delivery systems and their biochemical effects due to its ‘universal’ detection capability. MALDI-based MSI has emerged as a powerful tool for determining the distributions of a wide range of compounds, including small molecules,18,19 lipids,20 drugs and their metabolites,21 and peptides and proteins22 in biological samples such as tissues, cell cultures, and even whole organisms.21,23,24 Using MALDI-MSI to study the biodistributions of nano-based delivery vehicles, however, has been quite limited. In one example the distribution of a liposomal carrier, loaded with a fluorophore, was monitored by MALDI-MSI,25 and in another, MALDI-MSI was used to determine the distribution of liposomal- conjugated doxorubicin in 3D cell culture.26 In no instances have nano-based drug delivery carriers and their corresponding biochemical effects been site-specifically monitored together in the same tissue.
While MALDI-MSI techniques have not been commonly applied to monitor the distribution of nano- based delivery systems, laser ablation inductively coupled plasma (LA-ICP) MSI16,17,27,28 and laser desorption ionization MSI techniques29–31 have been used for inorganic-based NP systems. Together, MALDI-MSI and LA-ICP-MSI can provide complementary information about the biodistributions of molecules that have both inorganic and organic components. Recent work has demonstrated the benefits of combining MALDI-MS and LA-ICP-MS imaging techniques to evaluate the inorganic and organic portions of small molecule drugs,32 enzymes and their potential regulators,33 as well as uptake of arsenic-containing lipids in a fruit fly model.34 When used together, the two techniques have even greater potential to reveal the sub-organ biodistributions of nano-based drug delivery systems while at the same time monitoring any biochemical effects caused by the presence of these systems.
Here, we describe a dual-mode imaging approach based on MALDI-MS and LA-ICP-MS for monitoring the distributions and biochemical effects of a nano-based drug-delivery system. For proof of concept, we use NP stabilized capsules (NPSCs) loaded with tumor necrosis factor alpha (TNF-a)-targeting small interfering RNA (siRNA) as a test-bed material (Figure 1). NPSCs are gold NP-based nanocarriers that have been used to deliver proteins, small molecules, and siRNA directly to the cytoplasm of cells.7,11,12,14,35 NPSCs bearing anti-TNF-α siRNA have been shown to result in knock-down in vitro and in vivo.1 Separate studies show that the reduction of TNF-α results in predictable biochemical responses, specifically lipid changes.36 Hence, NPSCs loaded with anti-TNF-α are excellent system for mapping the relationship between these biochemical changes and NP carrier distributions. By utilizing MALDI-MSI to monitor the predicted, altered lipid composition and LA-ICP-MS to monitor the NP carrier, we can determine whether biochemical changes occur only at sites of delivery agent accumulation or more broadly. When used together, the two imaging techniques reveal both local and systemic changes caused by anti- TNF-a-loaded NPSCs, highlighting the power of this dual-mode imaging approach.
Figure 1.
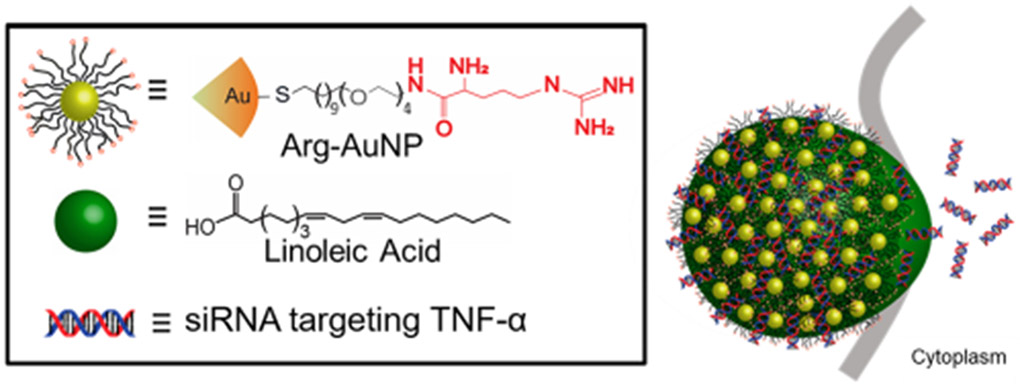
NPSC composition and AuNP-ligand structure. Arginine-based ligands (arginine shown in red) are conjugated to the AuNPs. The Arg-AuNPs are emulsified with linoleic acid and allowed to associate with the siRNA cargo.
Experimental Section
The chemicals and materials used in this work, the synthetic procedures for the NPSCs, and detailed information about all animal handling and tissue sectioning methods can be found in the supporting information.
MALDI Imaging Analysis.
MALDI-MS imaging experiments were conducted on a Bruker ultrafleXtreme MALDI-TOF/TOF at 50 pm resolution. The laser offset was set to 60%. All experiments were performed on at least three different sets of tissue sections to ensure reproducibility. MS/MS experiments were conducted using the LIFT cell with collision-induced dissociation. Compound identification was performed using MS/MS and/or accurate m/z measurements after internal standard alignment post-acquisition. Internal standards of m/z 273.04 (2DHB - 2H20 + H) and m/z 772.57 (PC (32:0) + K+) were used.
LA-ICP-MS Imaging Analysis
LA-ICP-MS experiments were conducted on a PerkinElmer NEXION 300 ICP-MS using a Teledyne CETAC LSX-213 G2 laser ablation system attached to the ICP-MS via Teflon tubing. Tissues were ablated via line scanning with a spot size of 50 pm, scan rate of 15 pm/s, 10 Hz laser frequency, 10 seconds of shutter delay, and a carrier He gas flow of 0.6 L/min. Images were reconstructed, as described in our previous work,16,17 by performing data reduction to produce an image with 50 pm resolution. In short, raw data were binned into pixelated data by averaging the 33 data points needed to create a single 50×50 pm pixel (see Figure SI for details and Figure S-2 for an example). These raw data were analyzed and reconstructed using a custom script written in Python. Because the zinc signal is relatively constant throughout spleen tissues (e.g. Figures S1 & S2), each metal of interest (i.e. iron, gold) was normalized to zinc distributions to account for folds or tears in the tissues that could give rise to “hot spots.”
Statistical Evaluation
SCiLS Lab 2015b was used to determine significant differences between tissue images. Baseline subtraction was conducted using the TopHat method, which is an operator used in mathematical morphology for image analysis.37 Baseline subtraction is followed by total ion count (TIC) normalization, peak picking, and discriminative value determination using both receiver operating characteristic (ROC) curves and ion abundance box-and-whisker plots. ROC curves are used to assess the performance of particular m/z values as binary classifiers for comparative tissues. ROC curves of the pooled data from given images were used to identify significant changes in ion signals between control and treated tissues. An ROC area under the curve (AUC) threshold of greater than 0.65 or lower than 0.35 was used to identify significant differences between tissues (see Figure S3).38–40 and differences for a given lipid are indicated if the AUC thresholds are surpassed for tissue images from three separate mice. Ion abundance box plots were also used in combination with ROCs to determine the degree of difference between pooled sets of data from given tissue images by comparing both the range and median points of the compared lipid peaks (Figure S4). In overlaid images, pixel colocalization was determined by translating each pixel into an RGB value, setting thresholds for background and noise, and calculating the number of overlapped pixels in each overlaid image (see SI for more details).
Results & Discussion
MALDI-MS imaging of spleen tissues from control mice and mice injected with NPSCs
The spleen was chosen for imaging because high concentrations of gold are measured by ICP-MS in this organ after injection of the NPSCs into mice (Table SI). In addition, this tissue has three distinct sub-organ regions with different cell types, including the white pulp that is rich in macrophages that produce TNF-α. We focused on the analysis of lipids because dysregulation of the lipidome is an indicator of variations in TNF-α production.41–42
Using MALDI-MSI, 52 identifiable lipids were detected in positive mode in separate imaging experiments (see Table S2 for the complete list of lipids), with 44 of these having been previously shown to correlate with TNF-α levels (Table l)43 Relative to tissues from control mice, some lipid levels from NPSC-injected mice undergo statistically significant increases (e.g. Figure 2a & 2d) or decreases (e.g. Figure 2b & 2e), while others remain the same (e.g. Figure 2c & 2f) according to both ROC curves and box-and-whisker plots (Figure S3–S5). As an example, relative ion abundances for phosphatidylcholine (PC) (p-40:5), where “p” indicates a plasmalogen species (Figure 2a), results in an AUC of 0.715 when comparing tissues from control and NPSC-treated mice (Figure S5), indicating that the level of this lipid increases significantly. A similar conclusion is obtained from ion abundance box-and-whisker plots (Figure S4). In contrast, carnitine (CAR) (16:0) (Figure 2b) has an AUC value of 0.293, indicating a significant decrease in the level of this lipid between the control and NPSC-treated tissues. To check if the AuNPs themselves were affecting lipid ionization efficiencies in the MAUDI experiments, control experiments were performed with biologically relevant concentrations of AuNPs. Uipid levels were found to be relatively unaffected by the presence of AuNPs even at concentrations above those detected in mouse tissues (Figure S6).
Table 1.
Characteristic lipid ions in the spleen of anti-TNF-α NPSC-injected mice.
| Lipid I.D.a | Detected m/z |
Ion(s) | Increased (+) or Decreased (−) levels in NPSC-injected Mouse Tissues | Change as Predicted?b | ROC aucc |
Spleen Region |
|---|---|---|---|---|---|---|
| LPC (16:0) | 496.3 518.4 |
[M + H+] [M + Na+] |
(+) | Yes | 0.745 0.684 |
White Pulp |
| LPC (18:0) | 524.4 | [M + H+] | (+) | Yes | 0.682 | White Pulp |
| LPC (p-18:0) | 508.6 | [M + H+] | (−) | No | 0.306 | Red Pulp |
| LPC (18:2) | 520.2 | [M + H+] | None | Yes | 0.501 | White Pulp |
| LPC (20:4) | 544.3 | [M + H+] | (−) | No | 0.345 | Red Pulp |
| PC (30:0) | 706.6 | [M + H+] | None | Yes | 0.550 | White Pulp |
| PC (32:0) | 734.5 772.5 |
[M + H+] [M + K+] |
(+) | No | 0.724 | White Pulp |
| PC (p-32:0) | 756.5 | [M + Na+] | (+) | Yes | 0.706 | White Pulp |
| PC (34:0) | 762.6 | [M + H+] | (+) | Yes | 0.785 | White Pulp |
| PC (p-34:0) | 746.6 | [M + H+] | (+) | Yes | 0.692 | White Pulp |
| PC (34:1) | 760.6 798.6 |
[M + H+] [M + K+] |
None | Yes | 0.418 0.616 |
White Pulp |
| PC (p-34:l) | 744.6 | [M + H+] | None | Yes | 0.446 | White Pulp |
| PC (34:2) | 780.5 | [M + Na+] | None | Yes | 0.450 | White Pulp |
| PC (34:3) | 756.6 | [M + H+] | (+) | No | 0.718 | White Pulp |
| PC (p-36:5) | 786.6 802.5 |
[M + Na+] [M + K+] |
(+) | Yes | 0.721 0.733 |
White Pulp |
| PC (p-36:4) | 788.6 804.5 |
[M + Na+] [M + K+] |
(+) | Yes | 0.684 | White Pulp |
| PC (p-36:2) | 770.6 792.6 808.5 |
[M + H+] [M + Na+] [M + K+] |
(+) | Yes | 0.730 0.754 0.733 |
White Pulp |
| PC (36:0)d | 790.6 812.6 828.5 |
[M + H+] [M + Na+] [M + K+] |
(+) | Yes | 0.695 0.752 0.704 |
White Pulp |
| PC (p-38:6)d | 790.6 812.6 828.5 |
[M + H+] [M + Na+] [M + K+] |
(+) | Yes | 0.695 0.752 0.704 |
White Pulp |
| PC (p-38:5) | 792.5 830.5 |
[M + H+] [M + K+] |
(+) | Yes | 0.754 0.786 |
White Pulp |
| PC (p-38:4) | 794.7 816.6 832.5 |
[M + H+] [M + Na+] [M + K+] |
(+) | Yes | 0.737 0.682 0.733 |
White Pulp |
| PC (p-40:5) | 820.6, 858.6 |
[M + H+], [M + K+] |
(+) | Yes | 0.715 0.716 |
White Pulp |
| 2H OH Cer (dl8:1/20:0) | 632.5 650.5 |
[M - H20 + K+] [M + K+] |
(−) | Yes | 0.258 0.343 |
Red Pulp |
| 2H Cer (dl8:l/25:l) | 681.7 | [M + NH4+] | (−) | Yes | 0.331 | Red Pulp |
| 2H Cer (dl8:1/20:1) | 632.5 | [M + K+] | (−) | No | 0.343 | Red Pulp |
| SM (dl8:1/17:0) | 741.6 757.6 |
[M + Na+] [M + K+] |
(+) | Yes | 0.714 0.759 |
White Pulp |
| SM (dl8:1/20:0) | 759.6 | [M + H+] | (+) | Yes | 0.767 | White Pulp |
| SM (dl8:l/21:l) | 771.6 809.6 |
[M + H+] [M + K+] |
(+) | Yes | 0.734 0.709 |
Both |
| SM (dl8:1/23:2) | 819.6 | [M + Na+] | (−) | Yes | 0.283 | White Pulp |
| SM (dl8:1/24:0) | 853.7 | [M + K+] | (+) | Yes | 0.740 | White Pulp |
| SM (dl8:1/24:3) | 809.6 847.6 |
[M + H+] [M + K+] |
(+) | No | 0.709 0.703 |
Both |
| PE (26:4) | 497.2 | [M - HG + K+] | (+) | Yes | 0.745 | Both |
| PE (p-34:3) | 557.5 | [M - HG + H+] | (+) | Yes | 0.664 | Red Pulp |
| PE (p-34:2) | 559.5 581.5 |
[M - HG + H+] [M - HG + Na+] |
None | No | 0.476 | Both |
| PE (p-34:l)d | 583.5 | [M - HG + H+] | (−) | No | 0.324 | Red Pulp |
| PE (p-36:4)d | 583.5 | [M - HG + Na+] | (−) | No | 0.324 | Red Pulp |
| PE (p-34:l)d | 732.5 | [M + H+] | (+) | Yes | 0.661 | White Pulp |
| PE (p-36:4)d | 724.5 | [M + Na+] | (+) | Yes | 0.661 | White Pulp |
| PE (p-36:3) | 585.5 | [M - HG + H+] | (+) | Yes | 0.693 | Red Pulp |
| PE (38:2) | 669.5 | [M - HG + K+] | (+) | Yes | 0.653 | Red Pulp |
| PE (38:l)d | 671.5 | [M - HG + K+] | None | No | 0.546 | Red Pulp |
| PE (p-40:5)d | 671.5 | [M - HG + K+] | None | No | 0.546 | Red Pulp |
| CAR (16:0) | 400.4 | [M + H+] | (−) | Yes | 0.293 | White Pulp |
| CAR (18:1) | 426.6 | [M + H+] | (−) | Yes | 0.318 | White Pulp |
The included lipids were measured in separate imaging experiments of spleen tissue slices from three different mice. A combination of exact mass determination from post-acquisition calibration, LIPIDMAPS, and MS/MS were used to identify each lipid. (Abbreviations: LPC - lysophosphatidylcholine; PC - phosphatidylcholine; Cer - ceramide; SM - sphingomyelin; PE - phosphatidylethanolamine; CAR - carnitine; “p-” - plasmalogen; HG - headgroup)
Changes correlated to previously reported lipidomics data.43
ROC AUCs were determined using SCiLS lab software. Values represent anti-TNF-α NPSC tissues vs. control tissues. Values greater than 0.65 and less than 0.35 were considered significantly different.
These lipids are not distinguishable by MS/MS.
Figure 2.
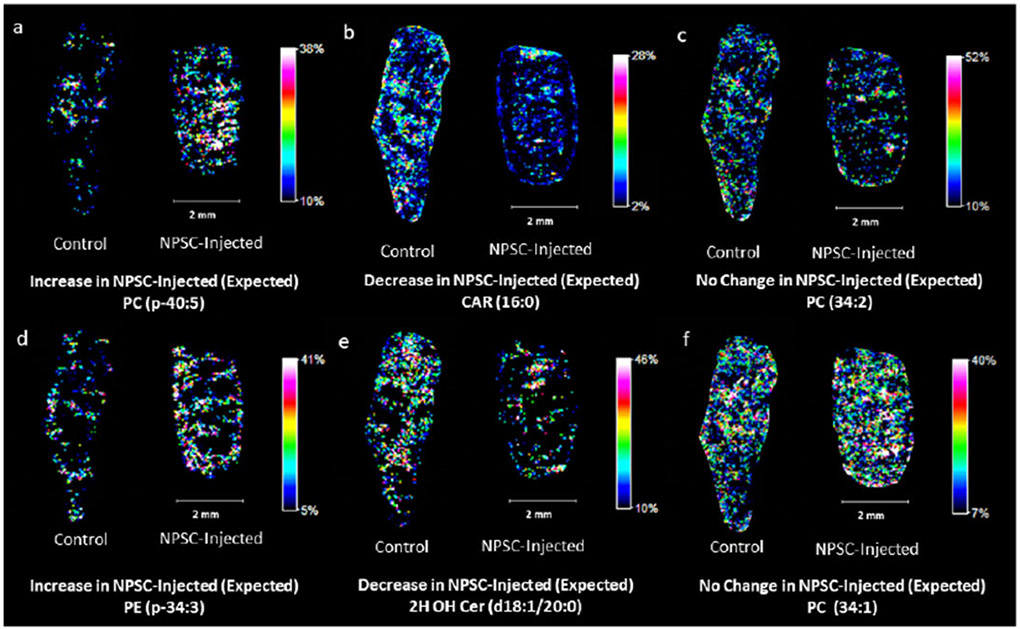
Representative images of lipid responses in NPSC-injected mouse spleen tissues (right in each image pair) compared to control tissues (left in each image pair). Panels (a) and (d) are examples of lipids predicted to increase in the spleen upon TNF-α knockdown. Panels (b) and (e) are examples of lipids predicted to decrease in the spleen upon TNF-α knockdown. Panels (c) and (f) are examples of lipids predicted to retain consistent levels upon TNF-α knockdown.36
Of the 44 measured lipids that have known responses in serum to TNF-α knockdown, we find that 75% respond as predicted in the spleen tissues (Table 1), indicating that MAUDI-MSI can provide data that are consistent with previous lipidomics experiments from serum samples.36 The concentration of phosphatidylethanolamine (PE) (p-34:3), for example, has been shown to increase when TNF-α is knocked down, and indeed, we observe a clear increase in the signal of this lipid (Figure 2d). Fikewise, the concentration of ceramide (Cer) (dl8:1/20:0) decreases upon TNF-α knockdown, and we observe the same effect in our MAFDI-MSI data (Figure 2e). Other lipids, such as PC (34:2), were not expected to change, and that is what we observe (Figure 2c). Of the remaining 11 lipids that do not respond as expected (e.g. PC (32:0), FPC p-18:0, and PE p-34:2 in Figure S7), their changes could be due to relatively low signal, differences between spleen and serum biochemistry, or the NPSC carrier itself.
To validate that our imaging method successfully monitors lipid changes caused by TNF-α knockdown from the NPSC injection, we also imaged tissues from mice injected with NPSCs containing scrambled siRNA that does not knock-down TNF-α. Of the detected lipids in the scrambled siRNA experiments, only eight change in a manner predicted for TNF-α knockdown (Table S3), as opposed to the 33 observed to change in the NPSCs with siRNA specific for TNF-α. A majority of the lipids have no significant changes between control mice and those injected with scrambled siRNA containing NPSCs (Table S3 & Figure S8). This control experiment indicates that the lipid changes observed after injecting the NPSCs with TNF-a specific siRNA (Table 1) are caused by TNF-α knockdown. The differences in lipid signals after TNF-a knockdown also highlight the fact that the AuNPs themselves are not influencing lipid signal as the total amount of gold in the spleen is comparable for mice injected with the TNF-α specific NPSCs and those injected with scrambled siRNA (Table SI). Interestingly, five of the 11 unexpected lipid changes that are observed upon TNF-α knockdown are also observed in the mice treated with scrambled siRNA, perhaps suggesting that the NPSC carrier itself is causing a biochemical response in the spleen tissue. The origin of these lipid changes will be further explored in future experiments.
While lipid levels largely correspond with previous results, completely new information is obtained about the locations of these lipid level changes, highlighting the value of MALDI-MSI. MALDI-MSI of heme B distributions (Figure 3) allow us to readily distinguish between the red pulp and white pulp of the spleen, which are sub-organ regions that were confirmed by traditional histology (Figure S9). Heme B signals, which are a proxy for hemoglobin, are high in the vascularized red pulp and very low in the immune-cell rich white pulp. The sub-organ distributions of the measured lipid changes provide new insight about the cell types that undergo changes upon TNF-α knockdown. The levels of 26 of the 44 lipids increase in the NPSC-treated mice (Table 1), and the vast majority (77%) of these increases are found in the white pulp (e.g. Figure 3a). Of the 8 lipids that show no change in abundance, 63% of these are in the white pulp (e.g. Figure 3c and 3f). In contrast, of the 10 lipids that decrease in abundance, only 30% of these are found exclusively in the white pulp as illustrated in Figure 3b. More interestingly, of the 33 lipids that respond to TNF-α as predicted, 79% of these responses occur exclusively in the white pulp, whereas 15% occur in the red pulp (e.g. Figures 3d & 3e) and 6% occur in both regions. This prevalence of lipid level changes in the white pulp likely reflects the fact that TNF-α is produced by immune-related macrophages, which are a primary component of the white pulp. Of the 11 lipids that do not respond to TNF-α knockdown as expected, only two are exclusively found in the white pulp, whereas the remainder are found in the red pulp or both regions (Figure S11). Together, these data provide new sub-organ locational information about lipid responses to TNF-α knockdown and hint at other intriguing changes that occur when TNF-α knockdown is accomplished using nano-based delivery agents.
Figure 3.
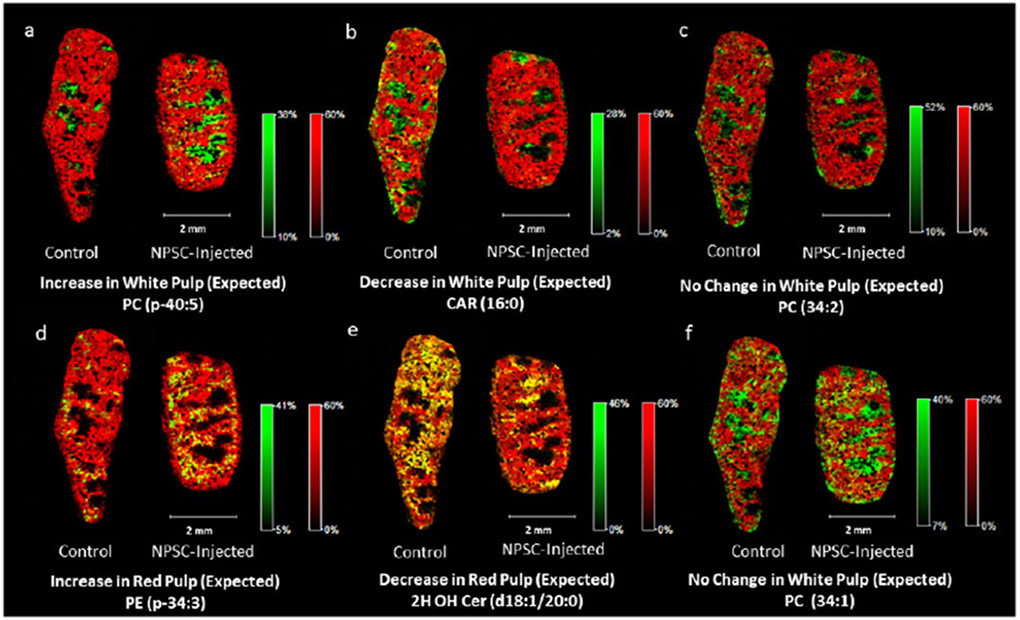
Example images of lipid responses in NPSC-injected mouse spleen tissues (right in each image pair) compared to control tissues (left in each image pair) with heme B overlays to determine sub-organ distribution. Heme B is indicated by red. Regions of high co-localization between the lipid and heme signals appear in yellow, whereas those with low or no co-localization appear in green. Panels (a), (b), (c), and (f) are example images of lipids that respond to the NPSCs in the white pulp of the spleen tissues, as indicated by their intense green color. In panel (f), only 22% of the control tissue lipids and 23% of the NPSC-injected lipids overlap with the heme peaks. Panels (d) and (e) are example images of lipids that respond to NPSCs in the red pulp of the spleen as indicated by their intense yellow color. In panel (d), 76% of the control tissue lipids and 85% of the NPSC-injected tissue lipids overlap with the heme peaks. In panel (e), 76% of the control tissue lipids and 71% of the NPSC-injected tissue lipids overlap with the heme peaks.
LA-ICP-MS imaging of spleen tissues from control mice and mice injected with NPSCs
To determine whether the observed lipid changes are systemic or co-localized with regions of NPSC accumulation, we also measured the distribution of gold in the tissue slices using LA-ICP-MSI. Previous work from our group has shown that AuNPs similar to those present in the NPSCs are stable for up to 48 h in vivo and in spleen tissues,16,17,44,45 making gold a good marker for these nanomaterials. A spleen tissue slice, immediately adjacent to the one used for MALDI-MSI analysis, was used for LA-ICP-MSI analysis. Fe levels in LA-ICP-MS images provide a convenient means of distinguishing between the red and white pulp regions of the spleen because blood flow is very different in these regions (Figure 4). When the LA- ICP-MS images of Fe and Au are overlaid, we find that Au is primarily found in the red pulp (Figure 4). When the Au and Fe levels are considered on a pixel-by-pixel basis, we find that about 90% of the Au is found in the red pulp. This distribution of Au is similar to what was found in previous LA-ICP-MS imaging results for AuNPs with positively-charged surface coatings.16,17,44
Figure 4.
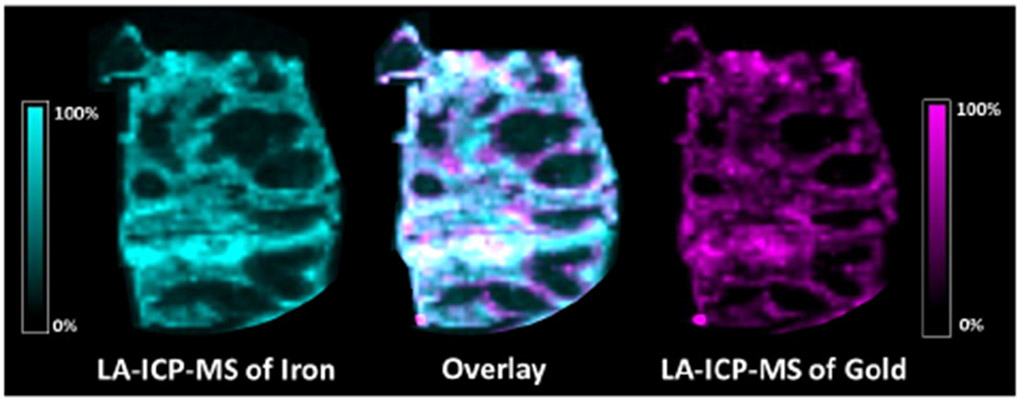
LA-ICP-MS images showing the distributions of iron (left) and gold (right) in a spleen tissue slice from an NPSC-injected mouse. The overlaid image (center) contains 83% co-registered (white) pixels, indicating that gold is primarily distributed in the red pulp region of the spleen where iron signals are high.
Because the majority of Fe in blood is associated with hemoglobin, Fe distributions in LA-ICP-MS images can be correlated with heme distributions from MALDI-MSI images, enabling an overlay of images from the two modalities (Figure 5). Such correlations allow us to compare the distributions of Au and lipid signals to determine if the lipid changes co-localize with the NPSCs. From these comparisons, we find that the majority of lipid changes occur in regions that have low gold concentrations. As an example, the distribution of the lipid PC (36:0) has minimal overlap with the gold distribution (Figure 6). Indeed, as indicated earlier, almost 80% of the predicted lipid changes occur in the white pulp where the gold content is almost 10-fold lower than in the red pulp. In many cases, predicted lipid changes that do occur in the red pulp, such as PE (p-34:3), also appear not to be dependent on gold levels, based on the poor overlap of lipid signal increases and Au signals (Figure S10). These observations suggest that the TNF-a-induced lipid changes are systemic and are not occurring where the NPSCs ultimately localize. This systemic effect likely arises because the NPSCs circulate for 48 h before the mice are sacrificed, providing ample time for siRNA to result in TNF-α knock-down and cause the observed changes in lipid levels. The ability to draw correlations between nanomaterial location and the resulting biochemical effect is uniquely possible with the combined imaging approach described here.
Figure 5.
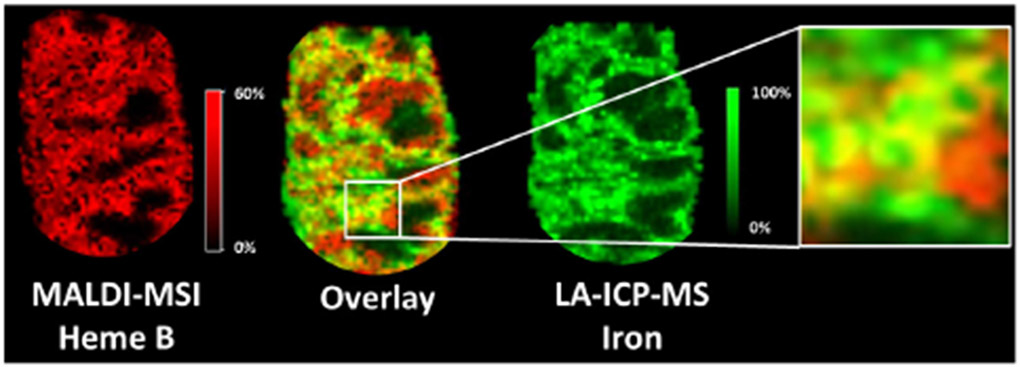
LA-ICP-MSI and MALDI-MSI image overlays of iron and heme B distributions to correlate the two imaging modalities. These analytes are markers for hemoglobin, which has a high concentration in the vascularized red pulp of the spleen. In the overlaid images, 70% of the signal pixels are yellow, indicating the expected high co-localization of iron and heme B in the red pulp.
Figure 6.
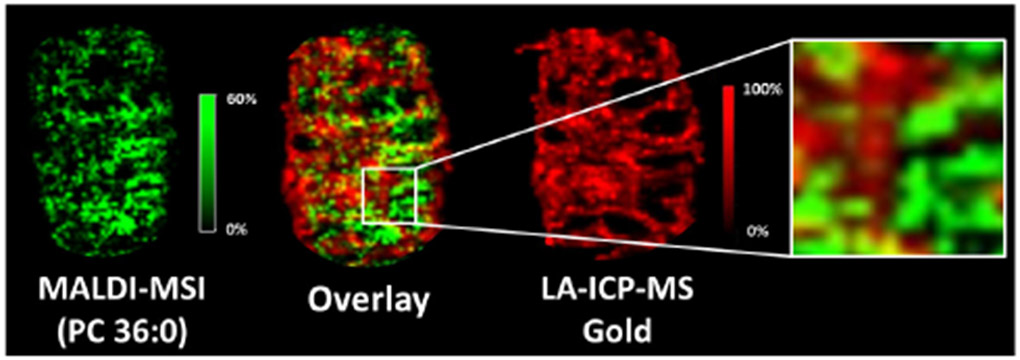
MALDI-MSI and LA-ICP-MSI image overlays of a lipid (i.e. PC 36:0) that changes upon NPSC injection and gold from the NPSCs, illustrating that the lipid changes occur in regions low in gold. In the overlaid images, only 34% of the signal pixels are yellow, indicating relatively how colocalization between the lipid of interest and gold.
Another important feature of combining the two imaging modalities is that we obtain intriguing site- specific information about lipids that do not change as predicted upon TNF-α knockdown. Of the 11 lipids whose levels change in an unexpected fashion, seven exclusively undergo changes in the red pulp, which has high concentrations of NPSCs (Figure S 10a), and two more undergo changes in the red and white pulp. When These observations suggest that the unexpected changes may arise from the presence of the NPSCs themselves. Future work will seek to further understand these biochemical changes by evaluating the inflammatory properties/effects of the NPSC carrier components themselves.
Conclusions
We have developed a powerful method to monitor and correlate the sub-organ distributions of a NP- based delivery system and its cargo-induced biochemical effects. Our approach relies on LA-ICP-MSI to track the inorganic components of a nano-based delivery system and MALDI-MS to examine changes in biochemistry caused by the delivery system. When the two imaging modalities are used together, we are able to evaluate if the biochemical effects are localized with the delivery vehicle or occur more diffusively. A key feature of our described approach utilizes the strong correlation between Fe signals in LA-ICP-MS and heme signals in MALDI-MS that allow images from the two modalities to be overlaid and directly compared. Upon using this new approach to image spleen tissues from mice injected with TNF-α siRNA- bearing NPSCs, we also obtain new biological information. Specifically, we observe that changes in the lipidome that occur with decreased TNF-α levels are primarily localized in the white pulp of the spleen. In addition, we find that several lipids have unexpected changes in their abundances, the vast majority of which occur in the red pulp where concentrations of NPSCs are highest, suggesting that changes to these lipids are caused by the NPSCs themselves. Control experiments with NPSCs containing scrambled siRNA are consistent with the NPSCs themselves having an effect on lipid levels. Future work will investigate how the individual components of the NPSCs influence lipid levels. We predict that the dual-mode imaging approach described here will be beneficial for the development of nano-based drug delivery systems by providing access to sub-organ biodistributions for carriers and their biochemical effect. Such information should facilitate the design of systems that target desired tissues while minimizing unwanted side effects.
Supplementary Material
Acknowledgements
The authors acknowledge the assistance of Dr. Stephen Eyles for his help with the instrumentation used in this research. KNS and JMH acknowledge partial support from NIH training grant T32 GM008515. This work was supported by NSF Grant CHE-1808199.
References
- (1).De M; Ghosh PS; Rotello VM Applications of Nanoparticles in Biology.. Adv. Mater 2008, 20 (22), 4225–4241. 10.1002/adma.200703183. [DOI] [Google Scholar]
- (2).Dreaden EC; Alkilany AM; Huang X; Murphy CJ; El-Sayed M. a. The Golden Age: Gold Nanoparticles for Biomedicine. Chem. Soc. Rev 2012, 41 (7), 2740 10.1039/c1cs15237h. [DOI] [PMC free article] [PubMed] [Google Scholar]
- (3).Yu X; Trase I; Ren M; Duval K; Guo X; Chen Z Design of Nanoparticle-Based Carriers for Targeted Drug Delivery. J. Nanomater 2016, 2016, 1087250 10.1155/2016/1087250. [DOI] [PMC free article] [PubMed] [Google Scholar]
- (4).Kumar B; Jalodia K; Kumar P; Gautam HK Recent Advances in Nanoparticle-Mediated Drug Delivery. J. Drug Deliv. Sci. Technol 2017, 41 (6), 260–268. 10.1016/j.jddst.2017.07.019. [DOI] [Google Scholar]
- (5).Liu J; Stace-Naughton A; Jiang X; Brinker CJ Porous Nanoparticle Supported Lipid Bilayers (Protocells) as Delivery Vehicles. J. Am. Chem. Soc 2009,131 (4), 1354–1355. 10.1021/ja808018y. [DOI] [PMC free article] [PubMed] [Google Scholar]
- (6).Rodenak-Kladniew B; Islan GA; de Bravo MG; Durán N; Castro GR Design, Characterization and in Vitro Evaluation of Linalool-Loaded Solid Lipid Nanoparticles as Potent Tool in Cancer Therapy. Colloids Surfaces B Biointerfaces 2017,154, 123–132. 10.1016/j.colsurfb.2017.03.021. [DOI] [PubMed] [Google Scholar]
- (7).Jiang Y; Hardie J; Liu Y; Ray M; Luo X; Das R; Landis RF; Farkas ME; Rotello VM Nanocapsule-Mediated Cytosolic SiRNA Delivery for Anti-Inflammatory Treatment. J. Control. Release 2018, 283 (May), 235–240. 10.1016/j.jconrel.2018.06.001. [DOI] [PMC free article] [PubMed] [Google Scholar]
- (8).Abrams MT; Koser ML; Seitzer J; Williams SC; Dipietro MA; Wang W; Shaw AW; Mao X; Jadhav V; Davide JP; et al. Evaluation of Efficacy, Biodistribution, and Inflammation for a Potent SiRNA Nanoparticle: Effect of Dexamethasone Co-Treatment. Mol. Ther 2010,18 (1), 171–180. 10.1038/mt.2009.208. [DOI] [PMC free article] [PubMed] [Google Scholar]
- (9).Whitehead KA; Langer R; Anderson DG Knocking down Barriers: Advances in SiRNA Delivery. Nat. Rev. Drug Discov 2009, 8 (2), 129–138. 10.1038/nrd2742. [DOI] [PMC free article] [PubMed] [Google Scholar]
- (10).Hofmann D; Messerschmidt C; Bannwarth MB; Landfester K; Mailänder V Drug Delivery without Nanoparticle Uptake: Delivery by a Kiss-and-Run Mechanism on the Cell Membrane. Chem. Commun 2014, 50(11), 1369–1371. 10.1039/c3cc48130a. [DOI] [PubMed] [Google Scholar]
- (11).Yang XC; Samanta B; Agasti SS; Jeong Y; Zhu ZJ; Rana S; Miranda OR; Rotello VM Drug Delivery Using Nanoparticle-Stabilized Nanocapsules. Angew. Chemie - Int. Ed 2011, 50 (2), 477–481. 10.1002/anie.201005662. [DOI] [PMC free article] [PubMed] [Google Scholar]
- (12).Tang R; Kim CS; Solfiell DJ; Rana S; Mout R; Velázquez-Delgado EM; Chompoosor A; Jeong Y; Yan B; Zhu Z-J; et al. Direct Delivery of Functional Proteins and Enzymes to the Cytosol Using Nanoparticle-Stabilized Nanocapsules. ACS Nano 2013, 7 (8), 6667–6673. 10.1021/nn402753y. [DOI] [PMC free article] [PubMed] [Google Scholar]
- (13).Pacardo DB; Ligler FS; Gu Z Programmable Nanomedicine: Synergistic and Sequential Drug Delivery Systems. Nanoscale 2015, 7 (8), 3381–3391. 10.1039/c4nr07677j. [DOI] [PubMed] [Google Scholar]
- (14).Hardie J; Jiang Y; Tetrault ER; Ghazi PC; Tonga GY; Farkas ME; Rotello VM Simultaneous Cytosolic Delivery of a Chemotherapeutic and SiRNA Using Nanoparticle-Stabilized Nanocapsules. Nanotechnology 2016, 27 (37), 374001 10.1088/0957-4484/27/37/374001. [DOI] [PMC free article] [PubMed] [Google Scholar]
- (15).Hofmann D; Tenzer S; Bannwarth MB; Messerschmidt C Mass Spectrometry and Imaging Analysis of Nanoparticle-Containing Vesicles Provide a Mechanistic Insight into Cellular Tra Ffi Cking. ACS Nano 2014, 8 (10), 10077–10088. 10.1021/nn502754c. [DOI] [PubMed] [Google Scholar]
- (16).Elci SG; Yan B; Kim ST; Saha K; Jiang Y; Klemmer GA; Moyano DF; Tonga GY; Rotello VM; Vachet RW Quantitative Imaging of 2 Nm Monolayer-Protected Gold Nanoparticle Distributions in Tissues Using Laser Ablation Inductively-Coupled Plasma Mass Spectrometry (LA-ICP-MS). Analyst 2016,141 (8), 2418–2425. 10.1039/c6an00123h. [DOI] [PMC free article] [PubMed] [Google Scholar]
- (17).Elci SG; Jiang Y; Yan B; Kim ST; Saha K; Moyano DF; Yesilbag Tonga G; Jackson LC; Rotello VM; Vachet RW Surface Charge Controls the Suborgan Biodistributions of Gold Nanoparticles. ACS Nano 2016,10 (5), 5536–5542. 10.1021/acsnano.6b02086. [DOI] [PubMed] [Google Scholar]
- (18).Svatoš A Mass Spectrometric Imaging of Small Molecules. Trends Biotechnol 2010, 28 (8), 425–434. 10.1016/j.tibtech.2010.05.005. [DOI] [PubMed] [Google Scholar]
- (19).Esquenazi E; Yang YL; Watrous J; Gerwick WH; Dorrestein PC Imaging Mass Spectrometry of Natural Products. Nat. Prod. Rep 2009, 26 (12), 1521–1534. 10.1039/b915674g. [DOI] [PubMed] [Google Scholar]
- (20).Zemski Berry KA; Hankin JA; Barkley RM; Spraggins JM; Caprioli RM; Murphy RC MALDI Imaging of Lipid Biochemistry in Tissues by Mass Spectrometry. Chem. Rev 2011, 111 (10), 6491–6512. 10.1021/cr200280p. [DOI] [PMC free article] [PubMed] [Google Scholar]
- (21).Stoeckli M; Staab D; Schweitzer A Compound and Metabolite Distribution Measured by MALDI Mass Spectrometric Imaging in Whole-Body Tissue Sections. Int. J. Mass Spectrom 2007, 260 (2–3), 195–202. 10.1016/j.ijms.2006.10.007. [DOI] [Google Scholar]
- (22).Cillero-Pastor B; Heeren RMA Matrix-Assisted Laser Desorption Ionization Mass Spectrometry Imaging for Peptide and Protein Analyses: A Critical Review of On-Tissue Digestion. J. Proteome Res 2014,13 (2), 325–335. 10.1021/pr400743a. [DOI] [PubMed] [Google Scholar]
- (23).Niehoff A-C; Kettling H; Pirkl A; Chiang YN; Dreisewerd K; Yew JY Analysis of Drosophila Lipids by Matrix-Assisted Laser Desorption/Ionization Mass Spectrometric Imaging. Anal. Chem 2014, 86 (22), 11086–11092. 10.1021/ac503171f. [DOI] [PubMed] [Google Scholar]
- (24).Atria AS; Schroeder KA; Seeley EH; Wilson KJ; Hammer ND; Colvin DC; Manier ML; Nicklay JJ; Rose KL; Gore JC; et al. Monitoring the Inflammatory Response to Infection through the Integration of MALDI IMS and MRI. Cell Host Microbe 2012,11 (6), 664–673. 10.1016/j.chom.2012.04.018. [DOI] [PMC free article] [PubMed] [Google Scholar]
- (25).Fülöp A; Sammour DA; Erich K; Von Gerichten J; Van Hoogevest P; Sandhoff R; Hopf C Molecular Imaging of Brain Localization of Liposomes in Mice Using MALDI Mass Spectrometry. Sci. Rep 2016, 6, 33791 10.1038/srep33791. [DOI] [PMC free article] [PubMed] [Google Scholar]
- (26).Lukowski JK; Weaver EM; Hummon AB Analyzing Liposomal Drug Delivery Systems in Three- Dimensional Cell Culture Models Using MALDI Imaging Mass Spectrometry. Anal. Chem 2017, 89 (16), 8453–8458. 10.1021/acs.analchem.7b02006. [DOI] [PMC free article] [PubMed] [Google Scholar]
- (27).Drescher D; Giesen C; Traub H; Panne U; Kneipp J; Jakubowski N Quantitative Imaging of Gold and Silver Nanoparticles in Single Eukaryotic Cells by Laser Ablation ICP-MS. Anal. Chem 2012, 84 (22), 9684–9688. 10.1021/ac302639c. [DOI] [PubMed] [Google Scholar]
- (28).Böhme S; Stärk H-J; Kühnel D; Reemtsma T Exploring LA-ICP-MS as a Quantitative Imaging Technique to Study Nanoparticle Uptake in Daphnia Magna and Zebrafish (Danio Rerio) Embryos. Anal. Bioanal. Chem 2015, 407(18), 5477–5485. 10.1007/s00216-015-8720-4. [DOI] [PMC free article] [PubMed] [Google Scholar]
- (29).Yan B; Zhu Z-J; Miranda OR; Chompoosor A; Rotello VM; Vachet RW Laser Desorption/Ionization Mass Spectrometry Analysis of Monolayer-Protected Gold Nanoparticles. Anal. Bioanal. Chem 2010, 396 (3), 1025–1035. 10.1007/s00216-009-3250-6. [DOI] [PubMed] [Google Scholar]
- (30).Yan B; Kim ST; Kim CS; Saha K; Moyano DF; Xing Y; Jiang Y; Roberts AL; Alfonso FS; Rotello VM; et al. Multiplexed Imaging of Nanoparticles in Tissues Using Laser Desorption/Ionization Mass Spectrometry. J. Am. Chem. Soc 2013,135 (34), 12564–12567. 10.1021/ja406553f. [DOI] [PMC free article] [PubMed] [Google Scholar]
- (31).Hou S; Sikora KN; Tang R; Liu Y; Lee YW; Kim ST; Jiang Z; Vachet RW; Rotello VM Quantitative Differentiation of Cell Surface-Bound and Internalized Cationic Gold Nanoparticles Using Mass Spectrometry. ACS Nano 2016,10 (7), 6731–6736. 10.1021/acsnano.6b02105. [DOI] [PMC free article] [PubMed] [Google Scholar]
- (32).Holzlechner M; Bonta M; Lohninger H; Limbeck A; Marchetti-Deschmann M Multisensor Imaging - From Sample Preparation to Integrated Multimodal Interpretation of LA-ICPMS and MALDI MS Imaging Data. Anal. Chem 2018, 90 (15), 8831–8837. 10.1021/acs.analchem.8b00816. [DOI] [PubMed] [Google Scholar]
- (33).de Vega RG; Sanchez MLF; Eiro N; Vizoso FJ; Sperling M; Karst U; Medel AS Multimodal Laser Ablation/Desorption Imaging Analysis of Zn and MMP-11 in Breast Tissues. Anal. Bioanal. Chem 2018, 410 (3), 913–922. 10.1007/s00216-017-0537-x. [DOI] [PubMed] [Google Scholar]
- (34).Niehoff A-C; Schulz J; Soltwisch J; Meyer S; Kettling H; Sperling M; Jeibmann A; Dreisewerd K; Francesconi KA; Schwerdtle T; et al. Imaging by Elemental and Molecular Mass Spectrometry Reveals the Uptake of an Arsenolipid in the Brain of Drosophila Melanogaster. Anal. Chem 2016, 88 (10), 5258–5263. 10.1021/acs.analchem.6b00333. [DOI] [PubMed] [Google Scholar]
- (35).Jiang Y; Tang R; Duncan B; Jiang Z; Yan B; Mout R; Rotello VM Direct Cytosolic Delivery of SiRNA Using Nanoparticle-Stabilized Nanocapsules. Angew. Chemie - Int. Ed 2015, 54 (2), 506–510. 10.1002/anie.201409161. [DOI] [PMC free article] [PubMed] [Google Scholar]
- (36).Wallace M; Morris C; O’Grada CM; Ryan M; Dillon ET; Coleman E; Gibney ER; Gibney MJ; Roche HM; Brennan L SI_Relationship between the Lipidome, Inflammatory Markers and Insulin Resistance. Mol. Biosyst 2014,10(6), 1586–1595. 10.1039/c3mb70529c. [DOI] [PubMed] [Google Scholar]
- (37).Stanford TE; Bagley CJ; Solomon PJ Informed Baseline Subtraction of Proteomic Mass Spectrometry Data Aided by a Novel Sliding Window Algorithm. Proteome Sci. 2016,14 (1), 19 10.1186/s12953-016-0107-8. [DOI] [PMC free article] [PubMed] [Google Scholar]
- (38).Klein O; Strohschein K; Nebrich G; Fuchs M; Thiele H; Giavalisco P; Duda GN; Winkler T; Kobarg JH; Trede D; et al. Unraveling Local Tissue Changes within Severely Injured Skeletal Muscles in Response to MSC-Based Intervention Using MALDI Imaging Mass Spectrometry. Sci. Rep 2018, 8 (1), 12677 10.1038/s41598-018-30990-w. [DOI] [PMC free article] [PubMed] [Google Scholar]
- (39).Gelaye B; Sumner SJ; McRitchie S; Carlson JE; Ananth CV; Enquobahrie DA; Qiu C; Sorensen TK; Williams MA Maternal Early Pregnancy Serum Metabolomics Profile and Abnormal Vaginal Bleeding as Predictors of Placental Abruption: A Prospective Study. PLoS One 2016,11 (6), e0156755 10.1371/journal.pone.0156755. [DOI] [PMC free article] [PubMed] [Google Scholar]
- (40).Gemoll T; Miroll E; Klein O; Lischka A; Eravci M; Thorns C; Habermann JK Spatial UBE2N Protein Expression Indicates Genomic Instability in Colorectal Cancers. BMC Cancer 2019,19 (1), 710 10.1186/s12885-019-5856-1. [DOI] [PMC free article] [PubMed] [Google Scholar]
- (41).Sun Y; Yin M; Zhang L; Pan J Characterization of the Cytokine Expression Profiles of the Aorta and Liver of Young Tumor Necrosis Factor Alpha Mutant Mice. Mol. Cell. Biochem 2012, 366 (1–2), 59–67. 10.1007/s11010-012-1283-1. [DOI] [PubMed] [Google Scholar]
- (42).Cawthorn WP; Sethi JK TNF-α and Adipocyte Biology. FEES Lett. 2008, 582 (1), 117–131. 10.1016/j.febslet.2007.11.051. [DOI] [PMC free article] [PubMed] [Google Scholar]
- (43).Wallace M; Morris C; O’Grada CM; Ryan M; Dillon ET; Coleman E; Gibney ER; Gibney MJ; Roche HM; Brennan L Relationship between the Lipidome, Inflammatory Markers and Insulin Resistance. Mol. BioSyst 2014,10(6), 1586–1595. 10.1039/C3MB70529C. [DOI] [PubMed] [Google Scholar]
- (44).Elci SG; Yesilbag Tonga G; Yan B; Kim ST; Kim CS; Jiang Y; Saha K; Moyano DF; Marsico ALM; Rotello VM; et al. Dual-Mode Mass Spectrometric Imaging for Determination of in Vivo Stability of Nanoparticle Monolayers. ACS Nano 2017,11 (7), 7424–7430. 10.1021/acsnano.7b03711. [DOI] [PMC free article] [PubMed] [Google Scholar]
- (45).Yan B; Kim ST; Kim CS; Saha K; Moyano DF; Xing Y; Jiang Y; Roberts AL; Alfonso FS; Rotello VM; et al. Multiplexed Imaging of Nanoparticles in Tissues Using Laser Desorption/Ionization Mass Spectrometry. J. Am. Chem. Soc 2013,135 (34), 12564–12567. 10.1021/ja406553f. [DOI] [PMC free article] [PubMed] [Google Scholar]
Associated Data
This section collects any data citations, data availability statements, or supplementary materials included in this article.