Abstract
Background
Photodynamic therapy (PDT), a minimally invasive cancer treatment involving the activation of photosensitizer by a specific wavelength of light, is considered to be a promising treatment option for drug-resistant prostate cancer. Hemagglutinating virus of Japan envelope (HVJ-E) has the potential to serve as a highly effective cancer therapy through selective drug delivery and enhancement of the anti-tumor immune response.
Objectives
To improve therapeutic efficacy and selective accumulation of photosensitizer into tumor cells, we developed a novel photosensitizer, Laserphyrin®-HVJ-E (L-HVJ-E), by incorporating talaporfin sodium (Laserphyrin®, Meiji Seika Pharma) into HVJ-E.
Materials and Methods
The therapeutic effect of PDT with Laserphyrin® or L-HVJ-E was evaluated in the human prostate cancer cell line PC-3 in vitro. The subcellular localizations of Laserphyrin® and L-HVJ-E were observed by confocal microscopy. Apoptosis or necrosis following PDT was detected by annexin V-fluorescein/propidium iodide double staining.
Results
The cytotoxic effect of Laserphyrin®- and L-HVJ-E-mediated PDT were determined by evaluating cell survival rate and production of reactive oxygen species. The cytotoxicity of L-HVJ-E-mediated PDT was dependent on drug concentration and light dose. Laserphyrin® and L-HVJ-E gradually entered cells as incubation time increased, and both agents tended to be distributed in lysosomes rather than mitochondria. Time and dose dependent increase in ROS production was observed, and induction of both apoptotic and necrotic cell death was confirmed.
Conclusions
Laserphyrin® and L-HVJ-E were distributed mainly in lysosomes and induced cell death by both apoptosis and necrosis. Furthermore, L-HVJ-E-mediated PDT effectively killed cultured PC-3 cells and exerted higher photocytotoxicity than Laserphyrin®-mediated PDT.
Keywords: Photodynamic therapy, Talaporfin sodium, Selective drug delivery system, Hemagglutinating virus of Japan envelope vector, Prostate cancer
Introduction
Prostate cancer is the most common non-skin cancer in humans and the third leading cancer-related cause of death among men in developed countries 1). Currently, treatment options for eradicating advanced prostate cancer are limited to hormone therapy and chemotherapy, and treatment resistance constitutes a major clinical challenge 2). Therefore, there is an urgent need to develop a relatively safe and effective clinical treatments that are distinct from conventional methods. An alternative, clinically approved, and minimally invasive treatment is photodynamic therapy (PDT), which involves activation of a photosensitizer by a specific wavelength of light in the presence of oxygen 3). Light activation of the photosensitizer leads to production of reactive oxygen species (ROS), causing cytotoxic effects in the target tissue 3). The anticancer effects of PDT are the result of low-to-moderate selective accumulation of photosensitizer within the cancer cells, direct cytotoxic effects of ROS produced by light-activated photosensitizer, damage to the tumor vasculature leading to oxygen and nutrient deprivation, and activation of the immune response against cancer 4, 5).
PDT with talaporfin sodium (Laserphyrin®, Meiji Seika Pharma, Japan), a second-generation photosensitizer, has been clinically approved in Japan for the treatment of lung cancer 6), primary brain tumors 7), and esophageal cancer 8). Laserphyrin® PDT is associated with a lower incidence of skin phototoxicity and a shorter period of light shielding (2 weeks) 9) relative to Photofrin® PDT. However, because Laserphyrin® is administered systematically, it persists in the skin, and the post-therapeutic light-shielding period is still too long for the patients. Moreover, current PDT methods exert limited therapeutic effects against deep-seated tumors or tumors with low photosensitizer accumulation. Therefore, to improve the therapeutic efficacy of PDT, photosensitizers with higher cancer-cell specificity and selectivity are required.
In a previous study, we reported that PDT using replication-deficient virus particles, hemagglutinating virus of Japan envelope (HVJ-E), as carriers of lipidated protoporphyrin IX (PpIX lipid) yielded a higher degree of cytotoxicity than PpIX lipid-mediated PDT 10). HVJ-E, a safe and efficient drug carrier, consists of two glycoproteins, the hemagglutinin neuraminidase (HN) and fusion (F) proteins, the latter of which allows fusion with the host cell membrane. Through its envelope–cell membrane fusion activity HVJ-E can directly introduce plasmid DNA, siRNA, proteins, or anti-cancer drugs into the cytoplasm 11, 12). Furthermore, HVJ-E preferentially binds to hormone-resistant prostate cancer cells 13) and mediates strong anti-tumor immunity by increasing cytokine production in matured dendritic cells, promoting infiltration of tumor-specific cytotoxic T cells, and suppressing regulatory T cell activity 14, 15).
PDT itself can induce the host immune response, but in most cases PDT alone is not sufficient to activate an immune response that would lead to complete cancer eradication 16). Therefore, combining Laserphyrin® with HVJ-E could enhance the therapeutic efficacy of PDT and selective delivery of photosensitizer to cancer cells. Moreover, the intracellular localization of photosensitizers determines the site of peak oxidative stress that occurs inside the cell, as well as the mechanism of cell death caused by the photosensitization reaction. Laserphyrin®-PDT causes lysosomal disruption and dispersion of lysosomal proteases throughout the cytoplasm, results in cell death due to apoptosis 17, 18). Lysosomes are important subcellular PDT targets. Therefore, targeting photosensitizers to lysosomes in tumor tissue is likely to provide an effective method of cancer treatment.
To improve therapeutic efficacy and selective accumulation of photosensitizer into tumor cells, we developed a novel photosensitizer, Laserphyrin®-HVJ-E (L-HVJ-E), by incorporating Laserphyrin® into HVJ-E. To identify the target of the photocytotoxic effect and optimize the therapeutic efficacy of L-HVJ-E-mediated PDT, we evaluated the cytotoxic effects, production of ROS, subcellular localization, and pattern of cell death following PDT using different concentrations of Laserphyrin® or L-HVJ-E in the human prostate cancer cell line PC-3.
Materials and methods
Cell line and culture conditions
The hormone-resistant human prostate cancer cell line PC-3 was cultured in complete D-MEM: Dulbecco's modified Eagle's medium (D-MEM, D6046, Sigma-Aldrich, USA) supplemented with 10% fetal bovine serum (FBS, S1820, Biowest, France) and 100 units/mL penicillin–streptomycin (P4458, Sigma-Aldrich, USA). Cells were cultured at 37°C in an atmosphere containing 5% CO2.
Photosensitizer
Laserphyrin® was obtained from Meiji Seika Pharma. Laserphyrin® is a second-generation photosensitizer synthesized from plant-derived chlorin e6 and L-aspartic acid. Activation of Laserphyrin® with laser light at a wavelength of 664 nm produces singlet oxygen in a drug dose–dependent manner 19). This study focuses on the use of replication-deficient hemagglitinating virus of Japan (HVJ; Sendai virus) particle (HVJ-envelop; HVJ-E) to enhance therapeutic efficicacy of PDT. HVJ-E consists of two viral glycoproteins, hemagglutinin-neuraminidase (HN) and fusion (F) proteins, which are responsible for inducing membrane fusion at host plasma membrane 20). HVJ-E was prepared from HVJ as described 21). First, 1 mL of a 10000 hemagglutination units (HAU)/mL suspension of HVJ in Dulbecco's phosphate buffered saline (D-PBS, D8537, Sigma-Aldrich) was irradiated with an ultraviolet light–emitting device (XL-1500 UV Cross Linker, Spectronics, USA) at an energy density of 99 mJ/cm2 for defection of replication; HVJ-E was obtained by fragmentation of RNA in HVJ. Then, 1 mL suspension of HVJ-E was divided into 4 equal parts, each containing 250 L (2500 HAU) of HVJ-E suspension. The HVJ-E suspension was centrifuged (20000 g, 4°C, 10 min), and the supernatant was removed to prepare the HVJ-E pellet (2500 HAU). Next, 44 µL of 937.5 µM, 1.88 mM, or 3.75 mM Laserphyrin® solution dissolved in D-PBS was added to 2500 HAU of HVJ-E pellet and centrifuged (20000 g, 4°C, 10 min), yielding a pellet containing L-HVJ-E. After centrifugation, the supernatant was removed, and 1.25 mL of FBS free D-MEM was added to yield L-HVJ-E suspension (2000 HAU/mL).
Measurement of fluorescence intensity of Laserphyrin® in PC-3 cells
To monitor the intracellular uptake of Laserphyrin® in cultured PC-3 cells, we measured the fluorescence intensity of cells treated with Laserphyrin® or L-HVJ-E. PC-3 cells (5.0 × 10³) were seeded in clear-bottomed black 96-well culture plates (Falcon® 353219, BD, USA) and incubated for 24 h at 37°C in 5% CO2. Cells were then loaded with 50 µL of D-MEM, HVJ-E suspension (100 HAU/well), Laserphyrin® solution (937.5 µM, 1.88 mM, or 3.75 mM), or L-HVJ-E suspension (added Laserphyrin® concentration of 937.5 µM, 1.88 mM, or 3.75 mM; 2000 HAU/mL), and incubated for 1, 3, 6, 12, or 24 h. Following incubation, the cells were washed with D-PBS and lysed in D-PBS containing 0.1% sodium dodecyl sulfate (31606-75, Nacalai Tesque, Japan). Measurement of fluorescence intensity of Laserphyrin® was performed using a fluorescence microplate reader (SpectraMAX Gemini, Molecular Devices, USA) at an excitation wavelength λex of 400 nm and an emission wavelength λem of 664 nm.
In vitro PDT and cell survival rate determination
Cell survival rate was determined by water-soluble tetrazolium salt (WST-8) cell proliferation assay. PC-3 cells were seeded on a clear-bottomed black 96-well cell culture plates (Falcon® 353219, BD, USA) at a density of 5.0 × 10³ cells/well and incubated for 24 h at 37°C in 5% CO2. After 24 h of incubation, the cells were loaded with 50 µL of D-MEM, HVJ-E suspension (100 HAU/well), Laserphyrin® solution (937.5 µM, 1.88 mM, or 3.75 mM), or L-HVJ-E suspension (added Laserphyrin® concentration of 937.5 µM, 1.88 mM, or 3.75 mM; 2000 HAU/mL), and incubated for 1, 3, 6, 12, or 24 h. After the incubation period, the cells were washed once with D-PBS, and then 100 µL complete D-MEM was added. The cells were then irradiated with laser light at a wavelength of 664 nm obtained with a laser diode (L660P120, Thorlabs, USA) mounted on a temperature-controlled laser diode mount (TCLDM9, Thorlabs) and controlled with a laser diode current and temperature controller (ITC4001, Thorlabs). Laser light was irradiated from the bottom side of the cell culture plate at a power density of 150 mW/cm2 and irradiation time of 40, 60, or 90 s. The position of the cell culture plate was controlled using a two-axis motorized linear translation stage (SGSP26-150[XY] Sigmakoki, Japan) and the temperature of the culture plate was maintained at 37°C by a plate warmer (KM-1, Kitazato Science, Japan). 24 h after irradiation, cell survival rate was evaluated by applying 10 µL of cell count reagent for the WST-8 assay (07553-44, Nacalai Tesque) to each well, and optical density at a wavelength of 450 nm was determined on an absorption microplate reader (VersaMax, Molecular Devices). Cell survival rate of each sample was calculated as a percentage relative to cells incubated in D-MEM.
Measurement of intracellular ROS/superoxide levels after PDT
The levels of intracellular ROS and superoxide after Laserphyrin®- or L-HVJ-E-mediated PDT in PC-3 cells were measured using the ROS-ID® total ROS/superoxide detection kit (ENZ-51010, Enzo Life Sciences, USA). This kit includes oxidative stress detection reagent (green) for ROS detection and superoxide detection reagent (orange). The ROS detection dye (green probe) enables detection of comparative levels of total ROS, such as hydrogen peroxide (H2O2), peroxynitrite (ONOO-), hydroxyl radicals (HO), nitric oxide (NO), and peroxy radical (ROO) yielding a green fluorescent product. However, the green probe has a low sensitivity for superoxide (O2-). The superoxide detection dye (orange probe) reacts specifically with superoxide (O2-), generating an orange fluorescent product. PC-3 cells were seeded into clear bottomed black 96-well cell culture plates (Falcon® 353219, BD) at a density of 5.0 × 10³ cells/well, and then incubated for 24 h at 37°C in 5% CO2. After 24 h of incubation, the medium was replaced with 50 µL of D-MEM, HVJ-E suspension (100 HAU/mL), Laserphyrin® solution (937.5 µM, 1.88 mM, or 3.75 mM), or L-HVJ-E suspension (added Laserphyrin® concentration of 937.5 µM, 1.88 mM, or 3.75 mM; 2000 HAU/mL), and the cells were incubated for 1, 3, 6, 12, or 24 h. Following incubation, the cells were washed with D-PBS, loaded with 100 µL complete D-MEM, and irradiated with the diode laser for 60 s at a wavelength of 664 nm and power density of 150 mW/cm2. Just after irradiation, the medium was replaced with ROS/superoxide detection reagent (2×), and the samples were incubated for 1 h at 37°C in the dark. After incubation, the fluorescence intensities of intracellular ROS and superoxide were measured on a fluorescence microplate reader (SpectraMAX Gemini, Molecular Devices) at λex of 488 nm and λem of 520 nm for ROS, and λex of 550 nm and λem of 610 nm for superoxide. Simultaneously, in parallel, treated cells (5.0 × 10³ cells/well) were observed using a fluorescence microscope (Eclipse TS2-LS, Nikon, Japan) to visualize intracellular fluorescence. For ROS/superoxide staining following PDT, a negative control sample was treated with ROS inhibitor for 30 min before induction. Cells were then incubated for 1 h at 37°C in 5% CO2 with ROS/superoxide detection reagent (2×). As a positive control, pyocyanin, a ROS inducer, was added to a well. The cells were washed twice with the provided wash buffer, and images were captured with a fluorescence microscope. Oxidative stress was imaged at λex of 490 nm and λem of 525 nm, and superoxide was imaged at λex of 550 nm and λem of 620 nm.
Subcellular localization of Laserphyrin® by confocal microscopy
Subcellular localization of Laserphyrin® in PC-3 cells was investigated on a confocal microscope (EclipseTi equipped with A1R/A1, Nikon) using fluorescence probes for intracellular organelles. PC-3 cells were seeded onto a 35-mm imaging dish (6160-30, zell-kontakt, Germany) at a density of 2.5 × 10⁵ cells/2 mL and incubated at 37°C in 5% CO2 for 24 h to allow adhesion. Cells were loaded with 3.75 mM Laserphyrin® solution or L-HVJ-E suspension (Laserphyrin® concentration of 3.75 mM; 2000 HAU/mL) for 1, 3, 6, 12 or 24 h at 37°C in 5% CO2. Next, the cells were washed with D-PBS and incubated with 0.1 µM LysoTracker® Green (L7526, Thermo Fisher Scientific, USA) for 30 min or 0.1 µM MitoTracker® Green (M7514, Thermo Fisher Scientific) for 10 min at 37°C in 5% CO2 to label lysosomes or mitochondria, respectively. To label the nuclei, 2 drops/mL of NucBlue Fixed Cell ReadyProbes™ Reagent (R37606, Thermo Fisher Scientific) were added to the media during imaging. λex was set to 403 nm for Laserphyrin® and nuclei, or 488 nm for lysosomes and mitochondria. λem was in the range of 662–737 nm for Laserphyrin®, 500–550 nm for lysosomes and mitochondria, or 425–475 nm for nuclei. Pearson's colocalization coefficient between images of Laserphyrin® and lysosomes, or Laserphyrin® and mitochondria, was analyzed using image processing software Fiji 22) and Colocalization Threshold plugin 23). It uses a Pearson's correlation above and below the thresholds to iteratively find where the correlation between the two images is zero and sets the threshold there. Pearson's colocalization coefficient ranges from 1 to −1, and a value of 1 represents perfect colocalization.
Analysis of cell death type after PDT
Cell death type assay following Laserphyrin®- or L-HVJ-E-mediated PDT in PC-3 cells was performed with a confocal microscope (EclipseTi equipped with A1R/A1, Nikon) using the annexin V-FITC apoptosis detection kit (IM2375, Beckman Coulter, USA). PC-3 cells were seeded onto a glass-bottomed 96-well plate (Thermo Scientific/Nunc, 164588, USA) at a density of 5 × 10³ cells/well and left at 37°C in 5% CO2 for 24 h to allow adhesion. Cells were loaded with 50 µL of D-MEM, HVJ-E suspension (100 HAU/well), Laserphyrin® solution (937.5 µM, 1.88 mM, or 3.75 mM), or L-HVJ-E suspension (added Laserphyrin® concentration of 937.5 µM, 1.88 mM, or 3.75 mM; 2000 HAU/mL) for 3 h at 37°C in 5% CO2. The cells were washed with D-PBS, and 100 µL of complete D-MEM was added. After that, cells were irradiated with a diode laser at the wavelength of 664 nm and power density of 150 mW/cm2 for 60 s. After 24 h of irradiation, complete D-MEM was withdrawn, and the cells were washed with 1 × Annexin V binding buffer. The cells were then incubated for 15 min at room temperature with 20 µL of annexin V-FITC, 20 µL of propidium iodide (PI), and 2 drops/mL nucleus staining reagent in 1× binding buffer. Finally, cells were observed under the confocal microscope. λex was set to 403 nm for nuclei, 492 nm for annexin V-FITC, or 528 nm for PI. λem was set to 460 nm for nuclei, 518 nm for annexin V-FITC, or 617 nm for PI.
Statistical analysis
All data are presented as the mean and standard deviation for six cases (n = 6), as indicated. Statistical comparison was performed using a two-tailed unpaired Student's t-test to determine significant differences between the two sample groups. P < 0.01 was considered to indicate a statistically significant difference.
Results
Measurement of fluorescence intensity of Laserphyrin® in PC-3 cells
Uptake of Laserphyrin® by cultured PC-3 cells was evaluated based on the fluorescence intensity of Laserphyrin® delivered via Laserphyrin® solution or L-HVJ-E suspension. As shown in Figure 1, fluorescence intensity of Laserphyrin® in PC-3 cells incubated in either Laserphyrin® solution or L-HVJ-E suspension gradually increased with increasing Laserphyrin® concentration and incubation period, i.e., drug administration time. Fluorescence intensities from cells incubated for 3–24 h in L-HVJ-E suspensions were significantly higher than those of cells incubated in Laserphyrin® solution at the same Laserphyrin® concentration. These results suggest that L-HVJ-E would be useful for efficient delivery of Laserphyrin® via the membrane fusion activity of HVJ-E.
Figure 1:
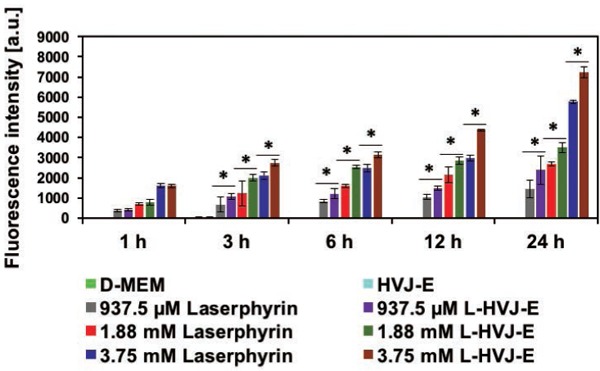
Fluorescence intensities of intracellular Laserphyrin® obtained from PC-3 cells. PC-3 cells were incubated in D-MEM, HVJ-E suspension, Laserphyrin® solution, or L-HVJ-E suspension with various Laserphyrin® concentrations for various incubation periods. Intracellular Laserphyrin® uptake increased with increasing Laserphyrin® concentration and incubation period for both Laserphyrin® solution and L-HVJ-E suspension. Fluorescence intensities were significantly higher in cells incubated in L-HVJ-E suspension than in cells incubated in Laserphyrin® solutions prepared at the same Laserphyrin® concentration (n = 6; *P < 0.01).
In vitro PDT and cell survival rate determination
Figure 2 shows the survival rate of PC-3 cells after PDT at various Laserphyrin® concentrations, incubation periods, and energy densities. Cell survival rates decreased below 50% in all conditions except for D-MEM treatment. A further decrease in cell survival rates was observed when cells were incubated with drugs for longer periods. Cell survival rates significantly decreased with increasing Laserphyrin® concentrations and light dose, indicating that the cell survival rate of PC-3 cells was dependent on photosensitizer concentration and laser energy density. Cell survival rate gradually decreased as light dose increased from 6 to 12 J/cm2 in cells incubated in either Laserphyrin® solution or L-HVJ-E suspension. Interestingly, cell survival rate was lower in cells incubated in L-HVJ-E suspension than in those incubated in Laserphyrin® solution at the same Laserphyrin® concentration. No death was observed in cells incubated in D-MEM. The reduction in cell survival rate after treatment with HVJ-E alone indicated that direct cytotoxic effect of HVJ-E was preserved even after light irradiation.
Figure 2:
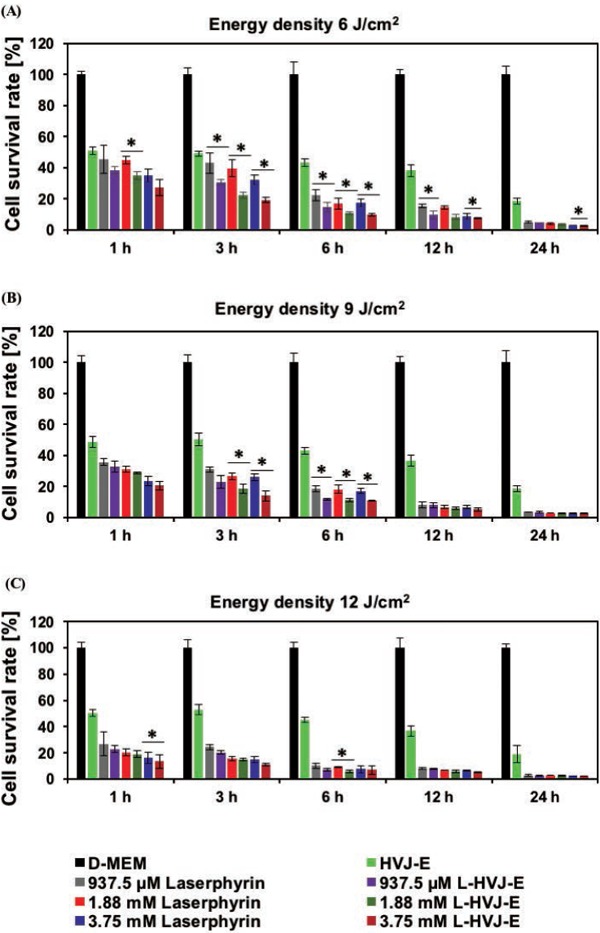
Cell survival rates of PC-3 cells. PC-3 cells were incubated in D-MEM, HVJ-E suspension, Laserphyrin® solution, or L-HVJ-E suspension at various Laserphyrin® concentrations for various incubation periods, and then exposed to laser light at a dose used for PDT, i.e., 6, 9, or 12 J/cm2 at a wavelength of 664 nm. Increasing the incubation period and light dose led to a gradual decrease in cell survival. The decrease in cell survival rate observed in samples treated with HVJ-E resulted from the direct cytotoxicity of HVJ-E. The survival rates of cells treated with L-HVJ-E were lower than those of cells treated with Laserphyrin® or HVJ-E alone (n = 6; *P < 0.01).
Measurement of intracellular ROS/superoxide levels after PDT
Next, we used a total ROS/superoxide detection kit containing a green fluorescent dye to detect ROS and an orange dye to detect superoxide. Figures 3 and 4 show the results of intracellular ROS and superoxide production in cells incubated in D-MEM, HVJ-E suspension, Laserphyrin® solutions, or L-HVJ-E suspensions with various Laserphyrin® concentrations and incubation periods. ROS production was significantly higher in all PDT-treated cells compared to the control cells. Both intracellular ROS and superoxide levels were elevated by both Laserphyrin®- and L-HVJ-E–mediated PDT in a Laserphyrin® dose–dependent manner. These results suggest that both Laserphyrin® and L-HVJ-E induced ROS accumulation in PC-3 cells. We also observed an incubation period-dependent increase in ROS and superoxide production (Figure 3), indicating that the longer the drug administration time, the higher the intracellular ROS concentration. Fluorescence micrographs suggest that a small amount of ROS and superoxide was produced in HVJ-E-treated cells, and no ROS/superoxide production was confirmed in the control sample (Figure 4). These results indicate that both Laserphyrin®- and L-HVJ-E-mediated PDT induced ROS and superoxide in the PC-3 cells in a dose-dependent manner, and that these effects were responsible for the initiation of cell death.
Figure 3:
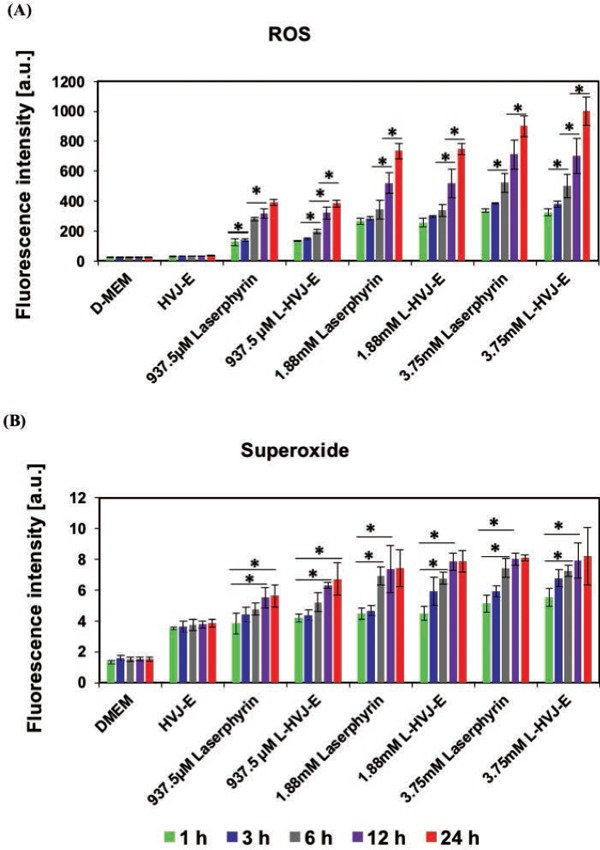
Relative levels of (A) ROS and (B) superoxide produced in PC-3 cells following PDT. PC-3 cells were incubated in D-MEM, HVJ-E suspension, Laserphyrin® solution, or L-HVJ-E suspension at various Laserphyrin® concentrations for various incubation periods, followed by light irradiation at a wavelength of 664 nm (9 J/cm2). After PDT, the samples were immediately stained using the ROS-ID® total ROS/superoxide detection kit, and fluorescence intensities were measured using a fluorescence microplate reader. The highest levels of ROS and superoxide, produced after incubation for 24 h in L-HVJ-E suspension prepared with 3.75 mM Laserphyrin®, were ∼9-fold higher than in the D-MEM group. Both intracellular ROS and superoxide levels were significantly elevated by Laserphyrin® and L-HVJ-E-mediated PDT in a Laserphyrin® concentration and incubation period–dependent manner.
Figure 4:
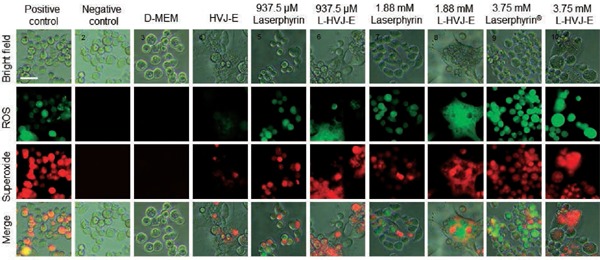
Fluorescence microscope images of ROS and superoxide produced in PC-3 cells by Laserphyrin® and L-HVJ-E-mediated PDT. PC-3 cells were incubated in D-MEM, HVJ-E suspension, Laserphyrin® solutions, or L-HVJ-E suspensions for 3 h, followed by light irradiation at a wavelength of 664 nm (9 J/cm2). After PDT, the cells were stained with ROS-ID® total ROS/superoxide detection kit and observed under a fluorescence microscope. A small amount of ROS and superoxide was produced in the sample treated with HVJ-E, whereas no ROS/superoxide production was observed in the control sample. The highest levels of ROS and superoxide were detected in the sample treated with 3.75 mM L-HVJ-E suspension. Photomicrographs of positive and negative controls were obtained to ensure that the kit functioned as expected.
Subcellular localization of Laserphyrin® via confocal microscopy
The localization of Laserphyrin® and L-HVJ-E in PC-3 cells was examined by monitoring fluorescence via confocal laser scanning microscopy. Figures 5 and 6 show lysosomal staining, and Figures 7 and 8 show mitochondrial staining, in cells incubated with 3.75 mM Laserphyrin® and L-HVJ-E for 1, 3, 6, 12, or 24 h. Figures 5–8 demonstrate the cellular localization of Laserphyrin® (red), mitochondrial and lysosomal probes (green), and the areas of colocalization (yellow) following co-incubation for 1–24 h. The fluorescence intensity of Laserphyrin® delivered via Laserphyrin® and L-HVJ-E gradually increased with the extension of incubation time. At the beginning of photosensitizer uptake, the majority of Laserphyrin® was distributed in a scattered manner, whereas with increasing incubation time Laserphyrin® was primarily distributed granularly in the cytoplasm. In Figure 5, major areas appear yellow, with fewer areas of green lysosomal fluorescence after 3–24 h of incubation, indicating that many lysosomes were colocalized with Laserphyrin®. Similarly, in merged images (Figure 6), the fluorescence emissions of L-HVJ-E closely coincided with those of lysosomes after 3–24 h of incubation, indicating the lysosomal localization of Laserphyrin® delivered via L-HVJ-E. Moreover, Figures 7 and 8 show more areas of distinct green mitochondrial fluorescence, indicating that only a few mitochondria colocalized with Laserphyrin®. The colocalization coefficient values between Laserphyrin® and lysosomes were relatively higher, indicating more extensive colocalization with lysosomes than mitochondria (Table 1). In addition, cells treated with L-HVJ-E exhibited cell-to-cell fusion and formation of enlarged multinucleated cells (Figures 6 and 8), possibly associated with the membrane fusion activity of HVJ-E, which allows rapid and effective drug delivery.
Figure 5:
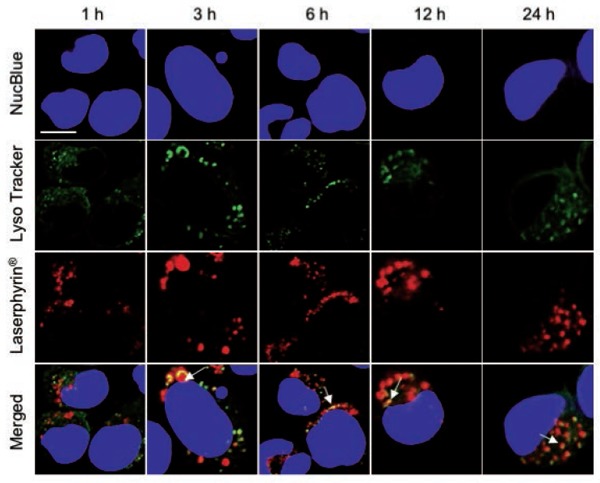
Subcellular localization of Laserphyrin®. PC-3 cells were incubated in 3.75 mM Laserphyrin® solution for various incubation periods. Fluorescence images of nuclei (blue), lysosomes (green), and Laserphyrin® (red) were visualized by confocal microscopy. Distributions of Laserphyrin® coincided closely with those of lysosomes, indicating colocalization of Laserphyrin® with lysosomes. Scale bar, 50 µm.
Figure 6:
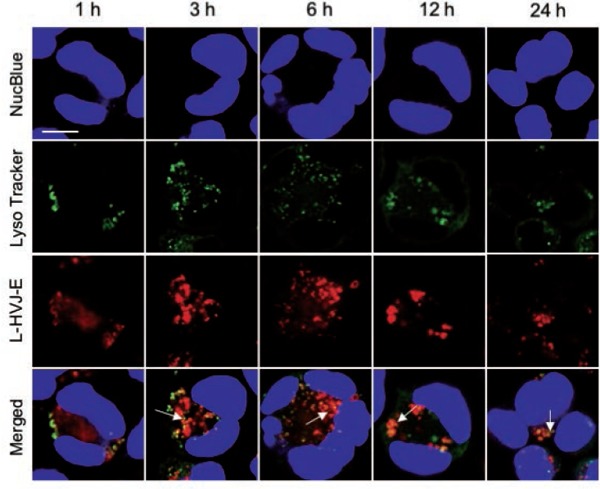
Subcellular localization of Laserphyrin® delivered by L-HVJ-E. PC-3 cells were incubated in 3.75 mM L-HVJ-E suspension for various incubation periods. Fluorescence images of nuclei (blue), lysosomes (green), and Laserphyrin® (red) were visualized by confocal microscopy. Distributions of Laserphyrin® coincided closely with those of lysosomes, indicating colocalization of Laserphyrin® with lysosomes. Scale bar, 50 µm.
Figure 7:
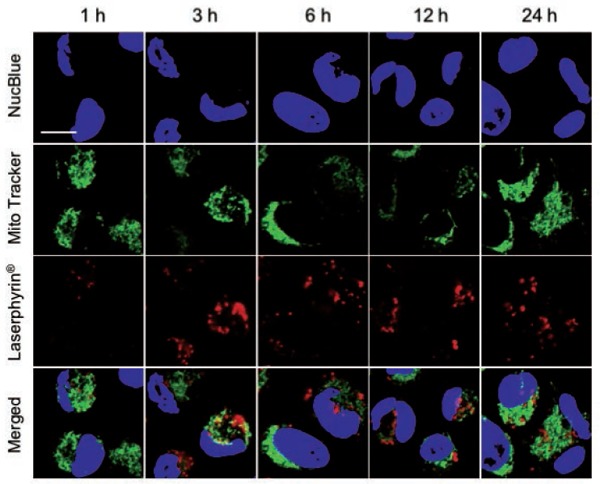
Subcellular localization of Laserphyrin®. PC-3 cells were incubated in 3.75 mM Laserphyrin® solution for various incubation periods. Fluorescence images of nuclei (blue), mitochondria (green), and Laserphyrin® (red) were visualized by confocal microscopy. In the merged images, there are many areas of distinct green mitochondrial fluorescence, indicating that only a few mitochondria colocalized with Laserphyrin®. Scale bar, 50 µm.
Figure 8:
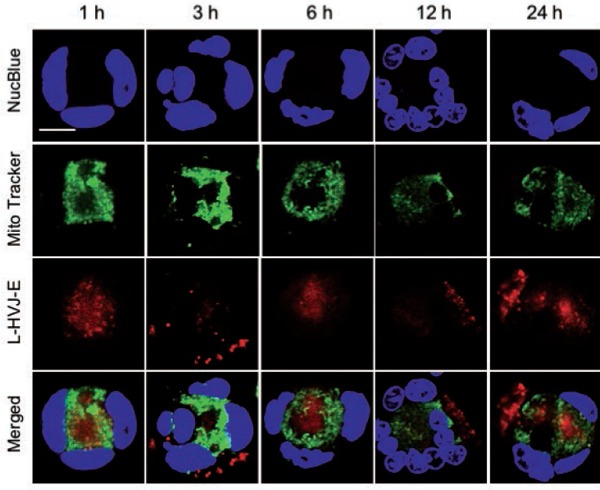
Subcellular localization of Laserphyrin® delivered by L-HVJ-E. PC-3 cells were incubated in the 3.75 mM L-HVJ-E suspension for different incubation periods. The fluorescence images of nuclei (blue), mitochondria (green), and Laserphyrin® (red) were visualized by confocal microscopy. Fluorescence images of nuclei (blue), mitochondria (green), and Laserphyrin® (red) were visualized by confocal microscopy. In the merged images, there are many areas of distinct green mitochondrial fluorescence, indicating that only a few mitochondria colocalized with Laserphyrin®. Scale bar, 50 µm.
Table 1: Colocalization coefficient of Laserphyrin® and L-HVJ-E with lysosomes and mitochondria.
| Colocalization coefficient (R) | Incubation periods | ||||
|---|---|---|---|---|---|
| 1 h | 3 h | 6 h | 12 h | 24 h | |
| Laserphyrin vs lysosomes | 0.433 | 0.500 | 0.546 | 0.558 | 0.585 |
| L-HVJ-E vs lysosomes | 0.437 | 0.501 | 0.555 | 0.601 | 0.621 |
| Laserphyrin vs mitochondria | 0.069 | 0.197 | −0.161 | −0.129 | −0.197 |
| L-HVJ-E vs mitochondria | −0.041 | −0.130 | −0.065 | 0.315 | 0.023 |
Determination of cell death type after PDT
The type of cell death following Laserphyrin®- or L-HVJ-E-mediated PDT in PC-3 cells was analyzed by fluorescence image observation using a confocal laser scanning microscope. Figure 9 shows the fluorescence images 24 h after PDT for PC-3 cells incubated for 3 h in D-MEM, HVJ-E suspension, Laserphyrin® solutions, and L-HVJ-E suspensions at various Laserphyrin® concentrations. Blue fluorescence indicates nuclei, green annexin V-FITC, and red PI; the last image in each series is a merge of the three colors.
Figure 9:
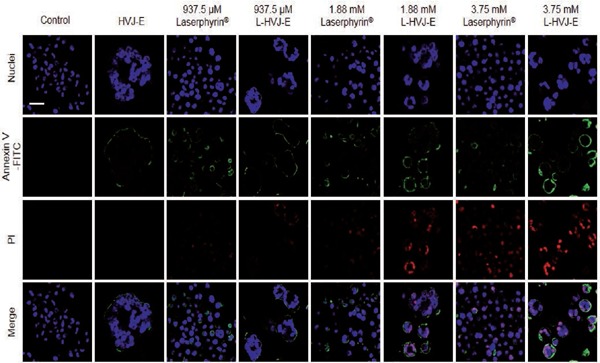
Fluorescence images obtained to analyze cell death types induced by Laserphyrin® or L-HVJ-E-mediated PDT. PC-3 cells were incubated for 3 h with D-MEM, HVJ-E suspension, Laserphyrin® solution, or L-HVJ-E suspension with different Laserphyrin® concentrations, and then irradiated with a 664-nm laser at an energy density of 9 J/cm2. The annexin V-FITC apoptosis detection kit was used to differentiate live, apoptotic, late apoptotic, and necrotic cells. Fluorescence images of nuclei (blue), annexin V-FITC (green), and propidium iodide (PI) (red) were visualized by confocal microscopy 24 h after PDT. Scale bar, 20 µm.
Typically, phosphatidylserine is located on the inner side of the plasma membrane, but during apoptosis, it is exposed on the outside surface of the plasma membrane, where it combines with annexin V-FITC to produce green fluorescence. In late apoptosis, the cell membrane was ruptured, allowing annexin V-FITC and PI to enter the cells. Laserphyrin® and L-HVJ-E localized mainly to the lysosomes and were laser-irradiated to produce ROS, which aggravated cellular apoptosis or necrosis. Higher concentrations of Laserphyrin® and L-HVJ-E caused late apoptosis or necrosis, whereas lower concentrations mainly induced apoptosis. In HVJ-E–treated samples, we observed annexin V–FITC–positive cells, suggesting apoptosis. Similarly, we observed an increase in annexin V–FITC– and PI-positive cells in cells incubated in Laserphyrin® solution or L-HVJ-E suspension, suggesting a reduction in cell membrane integrity. We also calculated the number of apoptotic and necrotic cells after performing Laserphyrin®- and L-HVJ-E–mediated PDT (Figure 10). A significant decrease in live cell proportion was observed in cells treated with L-HVJ-E compared to the Laserphyrin® treated cells. The proportion of apoptotic cells was higher in L-HVJ-E-treated cells than in Laserphyrin®-treated cells. The number of necrotic cells was higher in samples treated with 3.75 mM Laserphyrin® than in those exposed to lower concentrations (1.88 mM or 937.5 µM), indicating that higher photosensitizer concentrations are more likely to induce necrosis than apoptosis. Treatment with D-MEM alone had no influence on cellular apoptosis or necrosis. These results indicate that Laserphyrin®- and L-HVJ-E–mediated PDT cause both apoptosis and necrosis in PC-3 cells in a dose-dependent manner.
Figure 10:
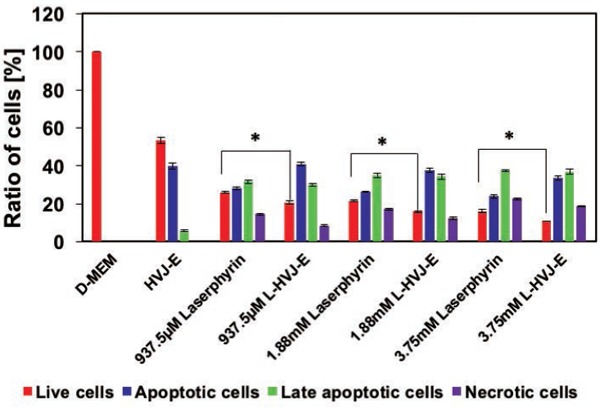
Ratio of live, apoptotic, late apoptotic, and necrotic cells after PDT (quantification of fluorescence microscopic images shown in Fig. 9). Cell death type was assessed by annexin V–FITC and PI 24 h after PDT. The proportion of live cells was lower in L-HVJ-E–treated samples than in Laserphyrin®-treated samples, while the proportion of apoptotic cells was higher in L-HVJ-E–treated samples. Necrotic cells were more abundant in samples treated with 3.75 mM Laserphyrin® than with lower doses (1.88 mM or 937.5 µM), indicating that a higher photosensitizer concentration was more likely to induce necrosis than apoptosis.
Discussion
The results of this study demonstrate that L-HVJ-E can produce greater photodynamic effect than the same concentration of Laserphyrin® alone in PC-3 cells, and that these effects increased with Laserphyrin® concentration and light dose. Laserphyrin® concentration was also positively correlated with the efficiency of induction of cell death. Late apoptotic/necrotic cells were observed within 24 h after L-HVJ-E-PDT, accompanied by elevated production of intracellular ROS and superoxide productions. We speculate that ROS and superoxide play key roles in damaging cells subjected to both Laserphyrin®- and L-HVJ-E–mediated PDT. In addition, when PC-3 cells were incubated with Laserphyrin® or L-HVJ-E for only 1 h, the colocalization coefficient between Laserphyrin® and lysosomes was relatively low. These results indicate that longer incubation periods promote more extensive colocalization of Laserphyrin® and lysosomes.
As shown in Figure 1, the Laserphyrin® fluorescence intensity was significantly higher in cells incubated in the L-HVJ-E suspension than in cells incubated in Laserphyrin® solution, indicating that Laserphyrin® accumulated in the cell to a greater extent when it was delivered via L-HVJ-E, likely due to the membrane fusion activity of HVJ-E. Cell-to-cell fusion was observed in L-HVJ-E–treated cells, also probably due to the membrane fusion activity of HVJ-E, and enlarged cells contained higher levels of intracellular ROS and superoxide than Laserphyrin®-treated cells after PDT. Most ROS species, which are presumably formed after PDT, can travel less than 0.02 µm within cells 24). Due to their short-lifetime, it has commonly been assumed that sites of photodamage will express the localization of photosensitizer during irradiation 25). It has been suggested that lower levels of ROS can trigger cellular apoptosis, whereas higher levels cause cellular necrosis 26). Therefore, cancer cells with higher levels of ROS production die more rapidly than normal cells due to ongoing oxidative stress.
In this study, we also performed confocal microscopy to examine the subcellular localizations of Laserphyrin® delivered by Laserphyrin® solution or L-HVJ-E suspension in PC-3 cells for different incubation periods, and characterized L-HVJ-E-mediated PDT-induced cell death. When cells were incubated with L-HVJ-E for only 1 h, scattered red fluorescence was mainly observed, whereas after prolonged incubation, a relatively granular distribution of Laserphyrin® in the cytoplasm region was evident (Figures 5 and 6). The distribution pattern of Laserphyrin® delivered by Laserphyrin® solution or L-HVJ-E suspension was largely identical to that of lysosomes (Figures 5 and 6), with colocalization coefficients in the range of 0.433–0.621 (Table 1). On the other hand, the distribution patterns of Laserphyrin® and mitochondria were not identical, with colocalization coefficients of only 0.023–0.315 (Table 1). These findings indicate that Laserphyrin® primarily localized to lysosomes in PC-3 cells.
HVJ-E receptors are more highly expressed in some prostate cancer cell lines than in normal prostate epithelial cells 13), and cancer-specific expression of HVJ-E receptors allows highly selective treatment of prostate cancer. Cancer-selective photosensitizer delivery to lysosomes can trigger apoptosis via release of cathepsins and activation of pro-apoptotic factors 27–29). The lysosomal localization of Laserphyrin® is already well established 17, 18), and in this study we confirmed that L-HVJ-E is also localized mainly in lysosomes. Therefore, selective accumulation of Laserphyrin® delivered by HVJ-E can induce apoptotic cell death to PC-3 cells. However, several types of cell death may coexist 30, 31), and many studies have reported that cell death induced by PDT is affected by the nature of the photosensitizer, light dose, incubation period, and cell type 32–35). Our results revealed that Laserphyrin®- and L-HVJ-E–mediated PDT induce both apoptotic and late apoptotic/necrotic cell death after 24 h. In addition, we observed that higher photosensitizer concentrations increased the frequency of late apoptotic/necrotic cell death, whereas lower doses induced mainly apoptosis, consistent with the findings of Miki et al. 36, 37). On the other hand, the number of apoptotic cells were higher in L-HVJ-E-treated cells than in Laserphyrin® treated cells, and the results suggest that HVJ-E promotes apoptosis by producing intracellular ROS. Necrosis causes an inflammatory response by releasing intracytoplasmic contents through the ruptured plasma membrane, whereas in apoptosis, cytoplasmic components are protected by the plasma membrane, and the cell is consumed by phagocytes without initiating inflammation 38). Therefore, to improve the safety and efficacy of PDT using L-HVJ-E, lower Laserphyrin® concentration would be preferable to prevent unwanted necrosis.
HVJ-E can induce apoptosis and antitumor immunity in PC-3 cells via recognition of HVJ-E RNA fragments by retinoic acid–inducible gene- I (RIG-I) 39), and anti-tumor activity could be maintained when HVJ-E is used as a carrier to deliver Laserphyrin®. Therefore, HVJ-E carrier could facilitate highly effective cancer therapy through selective drug delivery and its immunotherapeutic effects.
Taken together, our results demonstrate the potential of highly cytotoxic PDT using L-HVJ-E against in vitro prostate cancer cell. The photosensitizer, which localized mainly in lysosomes, initiated cell death via both apoptotic and necrotic processes with immediate production of ROS. However, secondary vascular damage due to increased vascular permeability and vasoconstriction is one of the most important mechanisms of tumor destruction 40). Therefore, the anticancer effect of L-HVJ-E-mediated PDT cannot be attributed solely to the cytotoxic effect of ROS production. Further studies are needed to elucidate the ability of L-HVJ-E to induce indirect anti-tumor effects and activate anti-tumor immunity in vivo.
Conclusion
In this study, we prepared a photosensitizer by incorporating Laserphyrin® into HVJ-E, and compared the therapeutic efficacy of Laserphyrin®- and L-HVJ-E–mediated PDT against the drug-resistant human prostate cancer cell line PC-3. Our results indicated that the L-HVJ-E mediated PDT showed higher photocytotoxicity than that of Laserphyrin®-mediated PDT at a given photosensitizer concentration. Laserphyrin® localization to lysosomes and the type of cell death following L-HVJ-E-mediated PDT were dependent on dose. These promising findings indicate that L-HVJ-E–mediated PDT may enable to improve the therapeutic efficacy by combining cytotoxicities of HVJ-E and PDT.
Acknowledgments
Financial support
The authors would like to thank Meiji Seika Pharma Co., Ltd. for providing Laserphyrin®. Part of this work was supported by Japan Society for the Promotion of Science KAKENHI Grant Number JP15K16322, and Japan Agency for Medical Research and Development (Project No. J169013067).
References
- 1: Semenas J, Allegrucci C, Boorjian SA, Mongan NP, Persson JL. Overcoming drug resistance and treating advanced prostate cancer. Curr Drug Targets [Internet]. 2012. September 1 [cited 2018 Feb 24];13(10):1308-23. Available from: http://www.ncbi.nlm.nih.gov/pubmed/22746994 [DOI] [PMC free article] [PubMed] [Google Scholar]
- 2: Huggins C, Hodges C V. Studies on prostatic cancer. I. The effect of castration, of estrogen and of androgen injection on serum phosphatases in metastatic carcinoma of the prostate. 1941. J Urol [Internet]. 2002 Feb [cited 2018 Feb 24];167(2 Pt 2):948-51; discussion 952. Available from: http://www.ncbi.nlm.nih.gov/pubmed/11905923 [PubMed] [Google Scholar]
- 3: Dougherty TJ, Gomer CJ, Henderson BW, Jori G, Kessel D, Korbelik M, et al. Photodynamic Therapy. JNCI J Natl Cancer Inst [Internet]. 1998. June 17 [cited 2018 Feb 24];90(12):889-905. Available from: https://academic.oup.com/jnci/article-lookup/doi/10.1093/jnci/90.12.889 [DOI] [PMC free article] [PubMed] [Google Scholar]
- 4: Gheewala T, Skwor T, Munirathinam G. Photosensitizers in prostate cancer therapy. Oncotarget [Internet]. 2017. May 2 [cited 2018 Feb 24];8(18):30524-38. Available from: http://www.oncotarget.com/fulltext/15496 [DOI] [PMC free article] [PubMed] [Google Scholar]
- 5: Allison RR, Moghissi K. Photodynamic Therapy (PDT): PDT Mechanisms. Clin Endosc [Internet]. 2013. January [cited 2018 Feb 24];46(1):24 Available from: http://www.ncbi.nlm.nih.gov/pubmed/23422955 [DOI] [PMC free article] [PubMed] [Google Scholar]
- 6: Ikeda N, Usuda J, Kato H, Ishizumi T, Ichinose S, Otani K, et al. New aspects of photodynamic therapy for central type early stage lung cancer. Lasers Surg Med [Internet]. 2011. September [cited 2018 Feb 24];43(7):749-54. Available from: http://www.ncbi.nlm.nih.gov/pubmed/22057502 [DOI] [PubMed] [Google Scholar]
- 7: Muragaki Y, Akimoto J, Maruyama T, Iseki H, Ikuta S, Nitta M, et al. Phase II clinical study on intraoperative photodynamic therapy with talaporfin sodium and semiconductor laser in patients with malignant brain tumors. J Neurosurg [Internet]. 2013. October [cited 2018 Feb 24];119(4):845-52. Available from: http://www.ncbi.nlm.nih.gov/pubmed/23952800 [DOI] [PubMed] [Google Scholar]
- 8: Yano T, Muto M, Yoshimura K, Niimi M, Ezoe Y, Yoda Y, et al. Phase I study of photodynamic therapy using talaporfin sodium and diode laser for local failure after chemoradiotherapy for esophageal cancer. Radiat Oncol [Internet]. 2012. July 23 [cited 2018 Feb 24];7(1):113 Available from: http://www.ncbi.nlm.nih.gov/pubmed/22824179 [DOI] [PMC free article] [PubMed] [Google Scholar]
- 9: Therapy P, Nelson JS, Roberts WG, Berns1 MW. In Vivo Studies on the Utilization of Mono-L-aspartyl Chlorin (NPe6) for. CANCER Res [Internet]. 1987. [cited 2018 Feb 24];47:4681-5. Available from: https://pdfs.semanticscholar.org/bee3/a5083ec7ca56664c4f3f05148e9c7abe6e09.pdf [PubMed] [Google Scholar]
- 10: Inai M, Honda N, Hazama H, Akter S, Fuse S, Nakamura H, et al. Photodynamic therapy using a cytotoxic photosensitizer porphyrus envelope that targets the cell membrane. Photodiagnosis Photodyn Ther [Internet]. 2017. December [cited 2018 Feb 24];20:238-45. Available from: http://linkinghub.elsevier.com/retrieve/pii/S157210001730385X [DOI] [PubMed] [Google Scholar]
- 11: Kaneda Y, Nakajima T, Nishikawa T, Yamamoto S, Ikegami H, Suzuki N, et al. Hemagglutinating virus of Japan (HVJ) envelope vector as a versatile gene delivery system. Mol Ther [Internet]. 2002. August [cited 2018 Feb 24];6(2):219-26. Available from: http://www.ncbi.nlm.nih.gov/pubmed/12161188 [DOI] [PubMed] [Google Scholar]
- 12: Kaneda Y, Yamamoto S, Nakajima T. Development of HVJ Envelope Vector and Its Application to Gene Therapy. In: Advances in genetics [Internet]. 2005. [cited 2018 Feb 24] p. 307-32. Available from: http://www.ncbi.nlm.nih.gov/pubmed/16243069 [DOI] [PubMed] [Google Scholar]
- 13: Kawaguchi Y, Miyamoto Y, Inoue T, Kaneda Y. Efficient eradication of hormone-resistant human prostate cancers by inactivated Sendai virus particle. Int J Cancer [Internet]. 2009. May 15 [cited 2018 Feb 24];124(10):2478-87. Available from: http://doi.wiley.com/10.1002/ijc.24234 [DOI] [PubMed] [Google Scholar]
- 14: Kurooka M, Kaneda Y. Inactivated Sendai Virus Particles Eradicate Tumors by Inducing Immune Responses through Blocking Regulatory T Cells. Cancer Res [Internet]. 2007. January 1 [cited 2018 Feb 24];67(1):227-36. Available from: http://www.ncbi.nlm.nih.gov/pubmed/17210703 [DOI] [PubMed] [Google Scholar]
- 15: Matsushima-Miyagi T, Hatano K, Nomura M, Li-Wen L, Nishikawa T, Saga K, et al. TRAIL and Noxa are selectively upregulated in prostate cancer cells downstream of the RIG-I/MAVS signaling pathway by nonreplicating Sendai virus particles. Clin Cancer Res [Internet]. 2012. November 15 [cited 2018 Feb 24];18(22):6271-83. Available from: http://clincancerres.aacrjournals.org/cgi/doi/10.1158/1078-0432.CCR-12-1595 [DOI] [PubMed] [Google Scholar]
- 16: Yang Y, Hu Y, Wang H. Targeting Antitumor Immune Response for Enhancing the Efficacy of Photodynamic Therapy of Cancer: Recent Advances and Future Perspectives. Oxid Med Cell Longev [Internet]. 2016. September 8 [cited 2018 Feb 24];2016:1-11. Available from: https://www.hindawi.com/journals/omcl/2016/5274084/ [DOI] [PMC free article] [PubMed] [Google Scholar]
- 17: Kessel D, Luo Y, Mathieu P, Reiners JJ., Jr Determinants of the Apoptotic Response to Lysosomal Photodamage. Photochem Photobiol [Internet]. 2000. January 24 [cited 2018 Feb 24];71(2):196 Available from: http://www.bioone.org/perlserv/?request=get-abstract&doi=10.1562%2F0031-8655(2000)071%3C0196%3ADOTART%3E2.0.CO%3B2 [DOI] [PubMed] [Google Scholar]
- 18: Liu L, Zhang Z, Xing D. Cell death via mitochondrial apoptotic pathway due to activation of Bax by lysosomal photodamage. Free Radic Biol Med [Internet]. 2011. July 1 [cited 2018 Feb 24];51(1):53-68. Available from: http://www.ncbi.nlm.nih.gov/pubmed/21530645 [DOI] [PubMed] [Google Scholar]
- 19: Wang S, Bromley E, Xu L, Chen JC, Keltner L. Talaporfin sodium. Expert Opin Pharmacother [Internet]. 2010. January 10 [cited 2018 Feb 24];11(1):133-40. Available from: http://www.tandfonline.com/doi/full/10.1517/14656560903463893 [DOI] [PubMed] [Google Scholar]
- 20: Kaneda Y, Saga K. Oncolytic Sendai virus-based virotherapy for cancer: recent advances. Oncolytic Virotherapy [Internet]. 2015. October [cited 2018 Oct 2];4:141 Available from: http://www.ncbi.nlm.nih.gov/pubmed/27512677 [DOI] [PMC free article] [PubMed] [Google Scholar]
- 21: Yamauchi M, Honda N, Hazama H, Tachikawa S, Nakamura H, Kaneda Y, et al. A novel photodynamic therapy for drug-resistant prostate cancer cells using porphyrus envelope as a novel photosensitizer. Photodiagnosis Photodyn Ther [Internet]. 2014. March [cited 2018 Feb 26];11(1):48-54. Available from: http://www.ncbi.nlm.nih.gov/pubmed/24629697 [DOI] [PubMed] [Google Scholar]
- 22: Schindelin J, Arganda-Carreras I, Frise E, Kaynig V, Longair M, Pietzsch T, et al. Fiji: An open source platform for biological image analysis. Nat Methods. 2012;9(7):676-82. [DOI] [PMC free article] [PubMed] [Google Scholar]
- 23:Colocalization Threshold - ImageJ [Internet]. [cited 2018 Aug 7]. Available from: https://imagej.net/Colocalization_Threshold [Google Scholar]
- 24: Dougherty TJ, Gomer CJ, Henderson BW, Jori G, Kessel D, Korbelik M, et al. Photodynamic therapy. J Natl Cancer Inst [Internet]. 1998. June 17 [cited 2018 Feb 26];90(12):889-905. Available from: http://www.ncbi.nlm.nih.gov/pubmed/9637138 [DOI] [PMC free article] [PubMed] [Google Scholar]
- 25: Moan J, Berg K. The photodegradation of porphyrins in cells can be used to estimate the lifetime of singlet oxygen. Photochem Photobiol [Internet]. 1991. April [cited 2018 Feb 24];53(4):549-53. Available from: http://www.ncbi.nlm.nih.gov/pubmed/1830395 [DOI] [PubMed] [Google Scholar]
- 26: Circu ML, Aw TY. Reactive oxygen species, cellular redox systems, and apoptosis. Free Radic Biol Med [Internet]. 2010. March 15 [cited 2018 Mar 6];48(6):749-62. Available from: http://www.ncbi.nlm.nih.gov/pubmed/20045723 [DOI] [PMC free article] [PubMed] [Google Scholar]
- 27: Tsubone TM, Martins WK, Pavani C, Junqueira HC, Itri R, Baptista MS. Enhanced efficiency of cell death by lysosome-specific photodamage. Sci Rep [Internet]. 2017. December 27[cited 2018 Feb 24];7(1):6734 Available from: http://www.ncbi.nlm.nih.gov/pubmed/28751688 [DOI] [PMC free article] [PubMed] [Google Scholar]
- 28: Ichinose S, Usuda J, Hirata T, Inoue T, Ohtani K, Maehara S, et al. Lysosomal cathepsin initiates apoptosis, which is regulated by photodamage to Bcl-2 at mitochondria in photodynamic therapy using a novel photosensitizer, ATX-s10 (Na). Int J Oncol [Internet]. 2006. August [cited 2018 Feb 24];29(2):349-55. Available from: http://www.ncbi.nlm.nih.gov/pubmed/16820876 [PubMed] [Google Scholar]
- 29: Kessel DH, Price M, Reiners JJ. ATG7 deficiency suppresses apoptosis and cell death induced by lysosomal photodamage. Autophagy [Internet]. 2012. September 14 [cited 2018 Feb 24];8(9):1333-41. Available from: http://www.tandfonline.com/doi/abs/10.4161/auto.20792 [DOI] [PMC free article] [PubMed] [Google Scholar]
- 30: Lockshin RA, Zakeri Z. Caspase-independent cell death? Oncogene [ Internet ]. 2004. April 12 [cited 2018 Feb 24];23(16):2766-73. Available from: http://www.ncbi.nlm.nih.gov/pubmed/15077140 [DOI] [PubMed] [Google Scholar]
- 31: Formigli L, Papucci L, Tani A, Schiavone N, Tempestini A, Orlandini GE, et al. Aponecrosis: Morphological and biochemical exploration of a syncretic process of cell death sharing apoptosis and necrosis. J Cell Physiol [Internet]. 2000. January [cited 2018 Feb 24];182(1):41-9. Available from: http://www.ncbi.nlm.nih.gov/pubmed/10567915 [DOI] [PubMed] [Google Scholar]
- 32: Chan WH, Yu JS, Yang SD. Apoptotic signalling cascade in photosensitized human epidermal carcinoma A431 cells: involvement of singlet oxygen, c-Jun N-terminal kinase, caspase-3 and p21-activated kinase 2. Biochem J [Internet]. 2000. October 1 [cited 2018 Feb 24];351(Pt 1):221-32. Available from: http://www.ncbi.nlm.nih.gov/pubmed/10998365 [DOI] [PMC free article] [PubMed] [Google Scholar]
- 33: Rousset N, Vonarx V, Eleouet S, Carre J, Bourre L, Lajat Y, et al. Cellular distribution and phototoxicity of Benzoporphyrin derivative and Photofrin. Res Exp Med [Internet]. 1999. November 25 [cited 2018 Feb 24];199(6):341-57. Available from: http://link.springer.com/10.1007/s004339900044 [DOI] [PubMed] [Google Scholar]
- 34: Fabris C, Valduga G, Miotto G, Borsetto L, Jori G, Garbisa S, et al. Photosensitization with zinc (II) phthalocyanine as a switch in the decision between apoptosis and necrosis. Cancer Res [Internet]. 2001. October 15 [cited 2018 Feb 24];61(20):7495-500. Available from: http://www.ncbi.nlm.nih.gov/pubmed/11606385 [PubMed] [Google Scholar]
- 35: Wyld L, Reed MW, Brown NJ. Differential cell death response to photodynamic therapy is dependent on dose and cell type. Br J Cancer [Internet]. 2001. May 18 [cited 2018 Feb 24];84(10):1384-6. Available from: http://www.nature.com/doifinder/10.1054/bjoc.2001.1795 [DOI] [PMC free article] [PubMed] [Google Scholar]
- 36: Miki Y, Akimoto J, Hiranuma M, Fujiwara Y. Effect of talaporfin sodium-mediated photodynamic therapy on cell death modalities in human glioblastoma T98G cells. J Toxicol Sci [Internet]. 2014. [cited 2018 Feb 24];39(6):821-7. Available from: http://www.ncbi.nlm.nih.gov/pubmed/25374373 [DOI] [PubMed] [Google Scholar]
- 37: Miki Y, Akimoto J, Yokoyama S, Homma T, Tsutsumi M, Haraoka J, et al. Photodynamic therapy in combination with talaporfin sodium induces mitochondrial apoptotic cell death accompanied with necrosis in glioma cells. Biol Pharm Bull [Internet]. 2013. [cited 2018 Feb 24];36(2):215-21. Available from: http://www.ncbi.nlm.nih.gov/pubmed/23196427 [DOI] [PubMed] [Google Scholar]
- 38: Fietta P. Many ways to die: passive and active cell death styles. Riv Biol [Internet]. [cited 2018 Mar 6];99(1):69-83. Available from: http://www.ncbi.nlm.nih.gov/pubmed/16791791 [PubMed] [Google Scholar]
- 39: Matsushima-Miyagi T, Hatano K, Nomura M, Li-Wen L, Nishikawa T, Saga K, et al. TRAIL and Noxa Are Selectively Upregulated in Prostate Cancer Cells Downstream of the RIG-I/MAVS Signaling Pathway by Nonreplicating Sendai Virus Particles. Clin Cancer Res [Internet]. 2012. November 15 [cited 2018 Feb 24];18(22):6271-83. Available from: http://www.ncbi.nlm.nih.gov/pubmed/23014529 [DOI] [PubMed] [Google Scholar]
- 40: Saito K, Mikuniya N, Aizawa K. Effects of photodynamic therapy using mono-L-aspartyl chlorin e6 on vessels and its contribution to the antitumor effect. Jpn J Cancer Res [Internet]. 2000. May [cited 2018 Feb 24];91(5):560-5. Available from: http://www.ncbi.nlm.nih.gov/pubmed/10835502 [DOI] [PMC free article] [PubMed] [Google Scholar]


