

Abstract
Objective:
To determine whether infants exposed in utero to serotonin reuptake inhibitor (SRI) antidepressants or a DSM-IVTR–defined mood disorder have significantly more neonatal discontinuation signs compared to an unexposed group of infants at 2–4 weeks after birth.
Methods:
This secondary analysis was derived from 2 observational studies with enrollment from July 2000 to December 2011 in Cleveland, Ohio, and Pittsburgh, Pennsylvania. Mothers (n = 214) belonged to one of 3 groups based on exposure status during pregnancy: (1) Comparison—women who did not take psychotropics during pregnancy and had no major mood disorder; (2) SRI-exposed—women with a mood disorder who were taking an SRI but no benzodiazepines; and (3) Mood Disorder—women with depression or bipolar disorder who did not take psychotropic medications. The infants were examined for signs according to the Finnegan Scale by evaluators blind to maternal exposure status.
Results:
The rates of sign presence (defined as a score ≥ 2 on the Finnegan Scale) in the SRI, Mood Disorder, and Comparison groups were similar at 34.1%, 35.1%, and 30.4%, respectively. Women in the SRI group had a significantly higher preterm birth rate (24.4%) compared to the other 2 groups (7.4% and 8.9% in the Mood Disorder and Comparison groups, respectively; P = .012). Preterm newborns had a significantly higher sign rate compared to full-term newborns (54% vs 31%, P = .020). We observed a significant relationship between Finnegan signs and preterm birth.
Conclusions:
The presence of neonatal signs at 2–4 weeks was more closely associated with prematurity than with in utero SRI or mood disorder exposure.
Trial Registration:
ClinicalTrials.gov identifiers: NCT00279370 and NCT00585702
Neonatal discontinuation syndrome (NDS), or poor neonatal adaptation syndrome,1 describes a pattern of newborn signs associated with prolonged antenatal exposure to an antidepressant in utero. These terms are commonly applied to exposure to selective serotonin (or serotonin-norepinephrine) reuptake inhibitors (collectively referred to as SRIs). Signs of NDS are primarily from 3 systems: central nervous, neuromuscular, and gastrointestinal. Signs include irritability, hypertonia, feeding difficulties, tremors, agitation, respiratory disturbances, hyperreflexia, excessive crying, and sleep disturbances.2 A 2013 meta-analysis of 30 studies3 showed that antidepressant use during pregnancy was associated with occurrence of NDS (odds ratio [OR] = 5.07; 95% CI, 3.25–7.90; P < .001), respiratory distress (OR = 2.20; 95% CI, 1.81–2.66; P < .001), and tremors (OR = 7.89; 95% CI, 3.33–18.73; P < .001). Severe NDS, which required medical intervention, was estimated at 3%.4
No consensus definition exists for NDS; accordingly, prevalence rates vary widely, from no apparent signs5 to as high as 30%.6 Measures used to assess NDS have also been highly variable. Laine et al7 developed a scale based on serotonergic symptoms observed in adults (myoclonus, restlessness, tremor, shivering, hyperreflexia, incoordination, and rigidity). Others have used the Finnegan Scale, which was developed to assess opioid withdrawal in infants.8,9 Therefore, the characteristics attributed to NDS have been widely variable based on the definitions and measures used.
The duration of signs has implications for exploring the etiologic mechanisms of NDS. Laine et al7 identified the duration of neonatal signs as 2 weeks based on the inability to distinguish exposed from nonexposed infants at that age. However, recent data suggest that some signs are enduring. Salisbury et al10 compared the developmental trajectory of neurobehavior over the first postnatal month for infants with prenatal exposure to pharmacologically untreated maternal depression, SRIs, SRIs with benzodiazepines, and no maternal depression or drug treatment (no exposure). Infants were examined with a structured neurobehavioral assessment at multiple time points. Across the first postnatal month, infants in the SRI and SRI plus benzodiazepine groups had lower motor scores and more central nervous system stress signs than nonexposed infants or those exposed to depression. They also had lower self-regulation and higher arousal at day 14. Infants in the depression group had lower arousal scores compared to the other groups throughout the first 30 days of life. Neurobehavioral development was different for infants exposed to an SRI than depression alone, and concomitant benzodiazepine and SRI exposure intensified adverse behavioral effects.
Differences in the pharmacologic characteristics of individual SRI also likely play a role in the occurrence of NDS, and some drugs, specifically paroxetine, venlafaxine, and fluoxetine, confer increased risks compared to exposure to other agents.2 The physiologic mechanism(s) that account for NDS include serotonergic stimulation from in utero SRI exposure. The mean ratios of umbilical cord to maternal serum concentrations of SRI range from 0.29 to 0.89, with the lowest ratios for sertraline and paroxetine and the highest for citalopram and fluoxetine.11 The rapid drop in drug concentration postbirth also contributes, since some signs are associated with the decline in infant plasma concentrations, particularly for antidepressants with short half-lives.12 These mechanisms are not mutually exclusive, and different signs may evolve across time. Some infants may have drug-induced neurochemical changes that result in behavioral effects after the period of direct pharmacologic action, which is consistent with behavioral teratogenicity.13 Multiple mechanisms may be involved in infant signs related to polypharmacy, particularly when SRIs are used with benzodiazepines or opioids, which are addictive with chronic use.14
We evaluated infants with the Finnegan Scale in 2 studies of the offspring of women with mood disorder, many of whom were treated with SRIs. Our interest was in determining whether infants exposed in utero to SRI or untreated mood disorder had significantly more neonatal signs compared to an unexposed group of infants. Our hypothesis was that both SRI- and mood disorder–exposed infants would have a significantly greater number of signs than the unexposed group.
METHODS
Participants and Procedures
The women in this sample participated in one of 2 National Institute of Mental Health–supported observational studies (Antidepressant Use during Pregnancy, R01-MH60335 [ClinicalTrials.gov identifier: NCT00279370]; and Antimanic Use During Pregnancy, R01-MH075921 [ClinicalTrials.gov identifier: NCT00585702]; principal investigator: K.L.W.). Investigators followed women with major depressive disorder (MDD) or bipolar disorder and a comparison group of women with neither disorder throughout pregnancy and the postpartum period, with enrollment from 2000 to 2011 in Cleveland, Ohio, and Pittsburgh, Pennsylvania. Study staff recruited pregnant women between 18–44 years of age through physician referral, advertising, and screening in obstetric practices. Women with active substance use disorders and those exposed to prescription drugs defined formerly as Category D or X by the US Food and Drug Administration (FDA) were excluded. Urine drug screens were obtained at study entry. All women provided written informed consent. The studies were approved by the institutional review boards of Case Western Reserve University and the University of Pittsburgh.
The subset of women included in this analysis belonged to one of 3 categories: (1) Comparison: women who did not take psychotropics at any point during pregnancy and who did not have a major mood disorder; (2) SRI-exposed (hereafter, group is referred to as “SRI”): women with a mood disorder (either major depressive or bipolar disorder) and who were taking an SRI but had no exposure to any antimanic drugs or benzodiazepines during pregnancy. Maternal exposure to an SRI antidepressant must have occurred continuously in the final 4 weeks of pregnancy, which is consistent with the goal of evaluating the effects of abrupt discontinuation of exposure at birth; and (3) Mood Disorder: women with either MDD or bipolar disorder but who did not take psychotropic medications at any point during pregnancy.
Study physicians and nurse practitioners received training in the administration of the Finnegan Scale15 (Table 1). At the first postpartum assessment, ideally scheduled at 2 weeks and conducted before 4 weeks, a medically trained study team member examined the infant. The duration of the evaluations was 10–15 minutes. For those signs that could not be readily assessed in a single observation, parental report (for example, seizures, length of sleep post-feeding, fever, projectile vomiting, stool characteristics) was used. The mother was asked to describe the presence of these signs during the period since birth, and they were scored if they occurred. The personnel conducting the Finnegan assessments were blind to the prenatal exposure status of the infant and the mother’s psychiatric diagnosis (if any).
Table 1.
Version of the Finnegan Scale Used
| Finnegan Version Used in Analysis | Finnegan Version From Hudak et al15 |
|---|---|
| One question had option for dehydration (2 points), loose stools (2 points), or watery stools (3 points) | Same question does not have an option for dehydration, otherwise the same |
| Temperature range for a “1” score is 99–100.9°F and for a “2” score is greater than or equal to 101°F | Temperature range for a “1” score is 100.4–101°F and for a “2” score is greater than 101°F |
| Participants can score for either nasal flaring (1 point), respiratory rate > 60/min (1 point) or respiratory rate > 60/min with retractions (2 points) | Participants can score 1 point if nasal flaring is present. As a separate question, participants can score for either respiratory rate > 60/min (1 point) or respiratory rate > 60/min with retractions (2 points) (ie, the maximum score is 3 instead of 2) |
| Participants can score for ONE of the following: mild tremors when disturbed (1 point), mode rate-severe tremors when disturbed (2 points), mild tremors when undisturbed (3 points), moderate-severe tremors when undisturbed (4 points) | Treats tremors when disturbed as a separate question from tremors when undisturbed (ie, maximum score is 6 rather than 4) |
| Could receive a “1” for restless sleep, “1” for sleeps < 3 hours after feeding, “2” for sleeps < 2 hours after feeding, and “3” for sleeps < 1 hour after feeding | “Restless sleep” is not listed as an item. All other responses are the same. |
Measures
Descriptive data for the study group included maternal demographic variables (age at midgestation, race, education, employment, marital status) and clinical characteristics (parity, smoking status, alcohol intake) and depression symptom score on the 29-item Structured Interview Guide for the Hamilton Depression Rating Scale With Atypical Depression Supplement (SIGH-ADS)16 at 20 weeks antepartum and 2 weeks postpartum. The delivery and infant data included the rate of preterm birth (< 37 weeks gestation), 1-minute and 5-minute Apgar scores, infant sex, growth measurements (weight, length, and head circumference) at birth, infant age at assessment, and admission to the neonatal intensive care unit (NICU).
Primary outcome analyses focused on a variation of the modified Finnegan Scale that ranged from a score of 0 to 41 such that higher scores reflected more severe signs. As analysis results will illustrate, the primary outcome of interest required categorization into more meaningful groups due to the highly skewed nature of the scores.
The primary predictor of interest was the study group to which the mother belonged: (1) Comparison, (2) SRI, or (3) Mood Disorder. Preterm birth was a secondary predictor of interest because it is more frequent in both SRI- and depression-exposed than unexposed newborns.5 Additionally, the behavior of preterm infants also differs from that of full-term infants. Two weeks after birth, preterm infants have significantly more autonomic, motoric, state, attentional, and regulation disorganization than full-term infants.17
Descriptive statistics (frequency and percent for categorical variables; mean and standard deviation for continuous variables) were used to summarize patient characteristics. To compare the Finnegan scores across the 3 study groups, we used the nonparametric Kruskal-Wallis test followed by a series of Wilcoxon rank sum tests for pairwise comparisons. However, since approximately two-thirds of the Finnegan scores were either 0 or 1, we dichotomized the primary outcome variable into presence of signs (Finnegan score ≥ 2; score of 2 or more) or absence of signs (Finnegan score ≤ 1; score of 0 or 1).
We employed the Pearson χ2 test to assess associations between group and categorical measures (symptom presence, group and preterm birth status, and preterm status and symptom presence). Fisher exact test was used when expected cell counts were less than 5 for a given cross-tabulation. Continuous variables were compared across groups with 1-way analysis of variance (ANOVA) for normally distributed data and the Kruskal-Wallis test when statistical assumptions (ie, normality) were questionable. The association between Finnegan score and demographic and clinical measures were examined using similar methods. Post hoc comparisons between exposure groups employed Bonferroni corrections for significant baseline characteristics and clinical measures. Given the non-normal distribution of SIGH-ADS scores in our sample, we employed the nonparametric Wilcoxon rank sum test to compare postpartum SIGH-ADS scores across symptom groups. Additionally, we performed multiple linear regression on postpartum SIGH-ADS controlling for antepartum SIGH-ADS at 20 weeks gestation to assess the effect of exposure groups.
The Cochran-Mantel-Haenszel (CMH) test was used with study group as the stratification factor to examine the association between preterm birth status and symptom presence. We summarized the effects with odds ratios (ORs) and corresponding 95% confidence intervals (95% CIs) for comparison between preterm status and symptom presence. In addition, we used the Breslow-Day test to examine the homogeneity of these ORs.18 We conducted multiple logistic regression for symptom presence using preterm birth and study group as predictors. Analyses were performed using IBM SPSS Statistics for Windows, Version 23.0 (Armonk, NY; IBM Corp) and R (R Foundation for Statistical Computing; Vienna, Austria; Version 3.2.0). All analyses assumed a 5% level of significance.
RESULTS
Of the 214 pregnant women enrolled in the study, 41 (19.2%) belonged to the SRI group, 94 (43.9%) belonged to the Mood Disorder group, and 79 (36.9%) belonged to the Comparison group. The majority of women in the SRI-exposed group (n = 33; 80.5%) were exposed throughout pregnancy. The 41 SRI-exposed women were treated with fluoxetine (n = 10), sertraline (n = 20), escitalopram (n = 4), venlafaxine (n = 3), citalopram (n = 2), fluvoxamine (n = 1), and paroxetine (n = 1).
Table 2 presents the characteristics of the 214 women across the 3 exposure groups. In this observational study, the demographic and clinical characteristics significantly differed across the 3 study groups. Women treated with SRIs were older and less likely to be from a minority group compared to both the non–drug treatment women in the Mood Disorder group and the Comparison group. The SRI-treated women were more likely to be unemployed than the Comparison group. Mothers with mood disorder were more likely to be single, less educated, and more likely to be unemployed and smoke in contrast to the Comparison group. Parity, prepregnancy body mass index, alcohol use, and breastfeeding status did not significantly differ across the groups.
Table 2.
Demographic and Clinical Measures for Pregnant Women With Exposure to SRI Antidepressants, Mood Disorder Without SRI, or Neither
| Exposure During Pregnancy | Pairwise Comparison P Values | |||||||
|---|---|---|---|---|---|---|---|---|
| Maternal Measure | All (N = 214) | Comparison (n = 79) | SRI (n = 41) | Mood Disorder (n = 94) | P Value | Comparison vs SRI | SRI vs Mood Disorder | Comparison vs Mood Disorder |
| Age at midgestation, mean (SD) | 29.72 (5.68) | 29.32 (5.12) | 32.21 (4.57) | 29.09 (6.39) | .001 | .105 | .001 | .154 |
| Race, n (%) | .005 | .018 | .002 | .872 | ||||
| African American | 39 (18.2) | 16 (20.3) | 1 (2.4) | 22 (23.4) | ||||
| Caucasian | 166 (77.6) | 61 (77.2) | 40 (97.6) | 65 (69.1) | ||||
| Other | 9 (4.2) | 2 (2.5) | 0 | 7 (7.4) | ||||
| Marital status, n (%) | <.001 | .111 | <.001 | .003 | ||||
| Married/cohabitate | 152 (71.0) | 62 (78.5) | 36 (87.6) | 54 (57.4) | ||||
| Single | 57 (26.6) | 15 (19.0) | 2 (4.9) | 40 (42.6) | ||||
| Divorced/separated | 5 (2.3) | 2 (2.5) | 3 (7.3) | 0 | ||||
| Education, n (%) | .045 | .999 | .74 | .035 | ||||
| < High school | 14 (6.5) | 5 (5.1) | 1 (2.4) | 9 (9.6) | ||||
| High school | 28 (13.1) | 7 (8.9) | 4 (9.8) | 17 (18.1) | ||||
| Some college | 41 (19.2) | 16 (20.3) | 12 (19.3) | 38 (40.4) | ||||
| College | 72 (33.6) | 33 (41.8) | 13 (31.7) | 26 (27.7) | ||||
| Graduate school | 59 (27.6) | 26 (32.9) | 14 (34.1) | 19 (20.2) | ||||
| Employed, n (%)a | 121 (57.3) | 61 (78.2) | 17 (41.5) | 43 (46.7) | <.001 | <.001 | .999 | <.001 |
| Parity, n (%)a | .078 | |||||||
| 1 | 73 (34.4) | 32 (40.5) | 8 (19.5) | 33 (35.9) | ||||
| 2 | 88 (41.5) | 34 (43.0) | 18 (43.9) | 36 (39.1) | ||||
| 3 or more | 51 (24) | 13 (16.5) | 14 (34.2) | 23 (25.0) | ||||
| Smoked tobacco in pregnancy, n(%)a | 24 (11.9) | 3 (4.0) | 3 (8.6) | 18 (19.6) | .007 | .999 | .552 | .007 |
| Prepregnancy body mass index, mean (SD) | 26.3 (6.9) | 25.7 (5.7) | 27.2 (5.9) | 26.5 (8.0) | .531 | |||
| Drank alcohol in pregnancy, n (%)a | 52 (25.7) | 16 (21.3) | 8 (22.9) | 28 (30.4) | .373 | |||
| Breastfeeding, n (%)a | .507 | |||||||
| No | 63 (32.5) | 19 (27.5) | 13 (37.1) | 31 (34.4) | ||||
| Full | 105 (54.1) | 43 (62.3) | 16 (45.7) | 46 (51.1) | ||||
| Partial | 26 (13.4) | 7 (10.1) | 6 (17.1) | 13 (14.4) | ||||
| Postpartum SIGH-ADS score, median (IQR)b | 8 (5–15) | 6 (4–8) | 10 (7–15) | 10 (7–17) | <.001 | <.001 | .647 | <.001 |
| Antepartum SIGH-ADS score, median (IQR) | 9 (6–15) | 6 (4–8) | 14 (10–18) | 13 (9–20) | <.001 | <.001 | .999 | <.001 |
Percentage is calculated based on complete data for the indicated variable.
P = .007 in multiple regression model adjusted for antepartum SIGH-ADS score at 20 weeks gestation. Significant difference was found between mood vs comparison group (P = .002). No significant difference was found between SRI vs comparison (P = .176) nor SRI vs mood (P = .183).
Abbreviations: IQR = interquartile range, SIGH-ADS = Structured Interview Guide for the Hamilton Depression Rating Scale With Atypical Depression, SRI = serotonin reuptake inhibitor.
Table 3 presents the characteristics of the infants born to women in the 3 pregnancy exposure groups. Overall, 33% of infants presented with Finnegan signs at a mean age of 3 weeks (range, 2–4 weeks). The rates of sign presence in the SRI, Mood Disorder, and Comparison groups were similar at 34.1%, 35.1%, and 30.4%, respectively (P = .797). Within the SRI group, Finnegan signs were present in 20% of infants exposed to fluoxetine and in 38.7% of the infants exposed to shorter-acting SRIs, but this difference did not reach significance (P = .278). We also conducted a sensitivity analysis in which only sertraline (the most frequently used agent in this study) was included in the SRI group, and the association with Finnegan signs remained nonsignificant (P = .661).
Table 3.
Clinical Measures for Infants Born to Women Exposed to SRI Antidepressants, Mood Disorder Without SRI, or Neither
| Exposure During Pregnancy | Pairwise Comparison P Values | |||||||
|---|---|---|---|---|---|---|---|---|
| Infant Measures | All (N = 214) | Comparison (n = 79) | SRI (n = 41) | Mood Disorder (n = 94) | P Value | Comparison vs SRI | SRI vs Mood Disorder | Comparison vs Mood Disorder |
| Finnegan signs, n (%)a | 71 (33.2) | 24 (30.4) | 14 (34.1) | 33 (35.1) | .797 | |||
| Male, n (%) | 124 (57.9) | 53 (67.1) | 17 (41.5) | 54 (57.4) | .026 | .032 | .286 | .635 |
| Age at assessment, median (IQR), wk | 3 (2–3.75) | 2 (2–3) | 3 (2–4) | 3 (2–4) | .063 | |||
| Birth length, mean (SD), cm | 50.9 (2.9) | 51.3 (2.8) | 49.5 (3.1) | 51.5 (3.0) | .006 | .007 | .013 | .999 |
| Birth weight, mean (SD), g | 3,435.9 (584.3) | 3,546.3 (567.8) | 3,304.3 (704.4) | 3,473.2 (593.5) | .044 | .049 | .771 | .301 |
| Birth head circumference, mean (SD), cm | 34.5 (1.8) | 34.7 (1.7) | 34.3 (2.0) | 34.4 (1.7) | .227 | |||
| Preterm birth, n (%) | 24 (11.2) | 7 (8.9) | 10 (24.4) | 7 (7.4) | .012 | .031 | .084 | .999 |
| 1-minute Apgar score <6, n (%)b | 8 (4.3) | 3 (4.2) | 2 (6.2) | 3 (3.6) | .795 | |||
| 5-minute Apgar score <8, n (%)b | 4 (2.1) | 0 (0.0) | 2 (6.2) | 2 (2.4) | .096 | |||
| Admission to NICU, n (%)b | 19 (13.1) | 6 (10.3) | 8 (33.3) | 5 (7.9) | .011 | .064 | .018 | .999 |
Presented as the percentage of infants with a score of 2 or more on the Finnegan Scale.
Percentage is calculated based on complete data for the indicated variable.
Abbreviations: IQR = interquartile range, NICU = neonatal intensive care unit, SRI = serotonin reuptake inhibitor.
Women in the SRI group had a significantly higher preterm birth rate (24.4%) compared to the other 2 groups (7.4% and 8.9% in the Mood Disorder and Comparison groups, respectively; P = .012), which is also reflected in the lower birth weight and length and higher rate of NICU admission in the SRI-exposed infants. Preterm newborns had a significantly higher sign rate compared to the full-term newborns (54% vs 31%, P = .020). This effect was uniform across the 3 study groups (Breslow-Day χ2 = 1.48, P = .478), and the common odds ratio for infants experiencing Finnegan signs was estimated to be 2.78 (CMH χ2 = 4.40, P = .036) for the preterm vs the full-term newborns. We observed a significant relationship between Finnegan signs and preterm birth status.
The frequency distribution of observed signs is displayed in Figure 1. The most commonly recorded signs (with prevalence > 10%) included restless sleep (n = 54; 25.2%), tremors (42; 19.6%), nasal stuffiness or sneezing > 3–4×/interval (40; 18.7%), and mottling (34; 15.9%).
Figure 1.
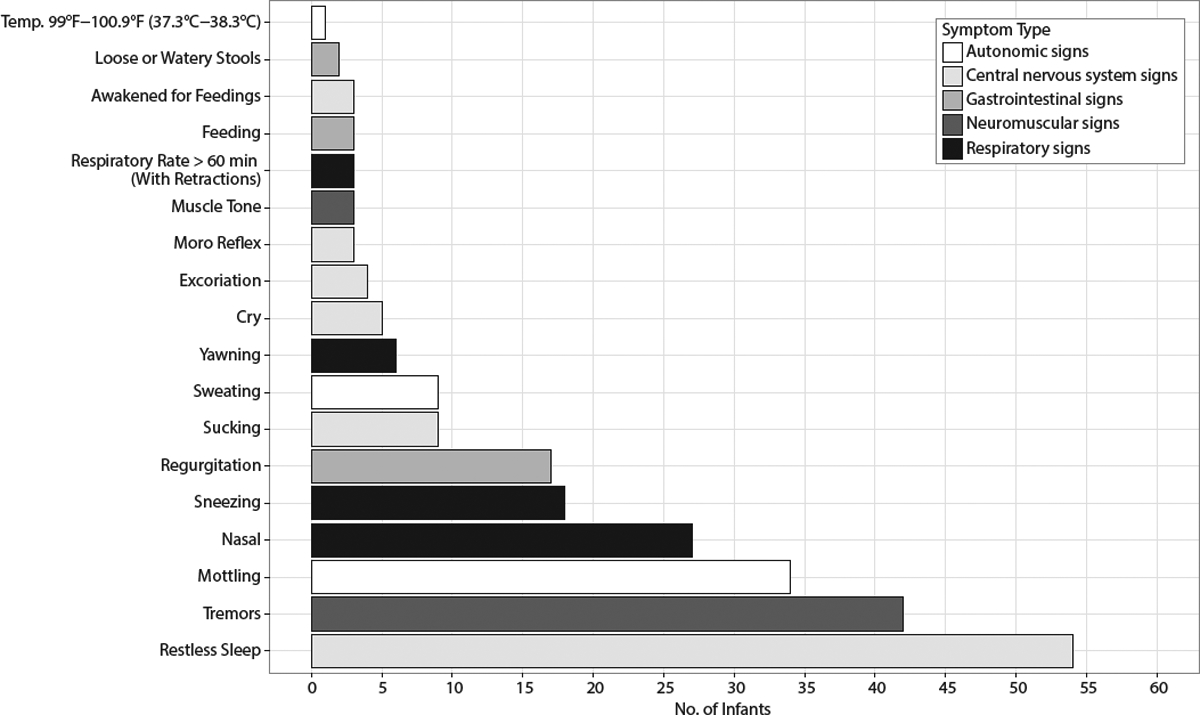
Specific Finnegan Signs Reported by Frequency of Occurrence
When we adjusted for potential confounders (preterm birth and mother’s race and age at study intake) through inclusion in a multivariate logistic regression, the association of signs and exposure group remained nonsignificant (Mood Disorder vs Comparison, P = .866; SRI vs Comparison, P = .667) (results not shown). We did not confirm an association between study group and Finnegan sign presence after controlling for potential covariates; however, we found a significant association between preterm birth status and Finnegan signs. The ANOVA failed to reveal any statistically significant differences in mean depression scores between SRI-exposed and unexposed women in this sample (P = .131).
We also evaluated the magnitude of the scores across exposure groups. Finnegan scores above 8 can be considered to be in the pathological range,19 and only 3 of 214 (1.4%) of infants in our sample had scores at this level: 1 was exposed to SRI, and 2, to mood disorder. A Kruskal-Wallis test to compare the Finnegan score distributions across the 3 groups did not reveal a significant difference (P = .324). The relative frequencies of signs by exposure group are presented in Figure 2.
Figure 2.
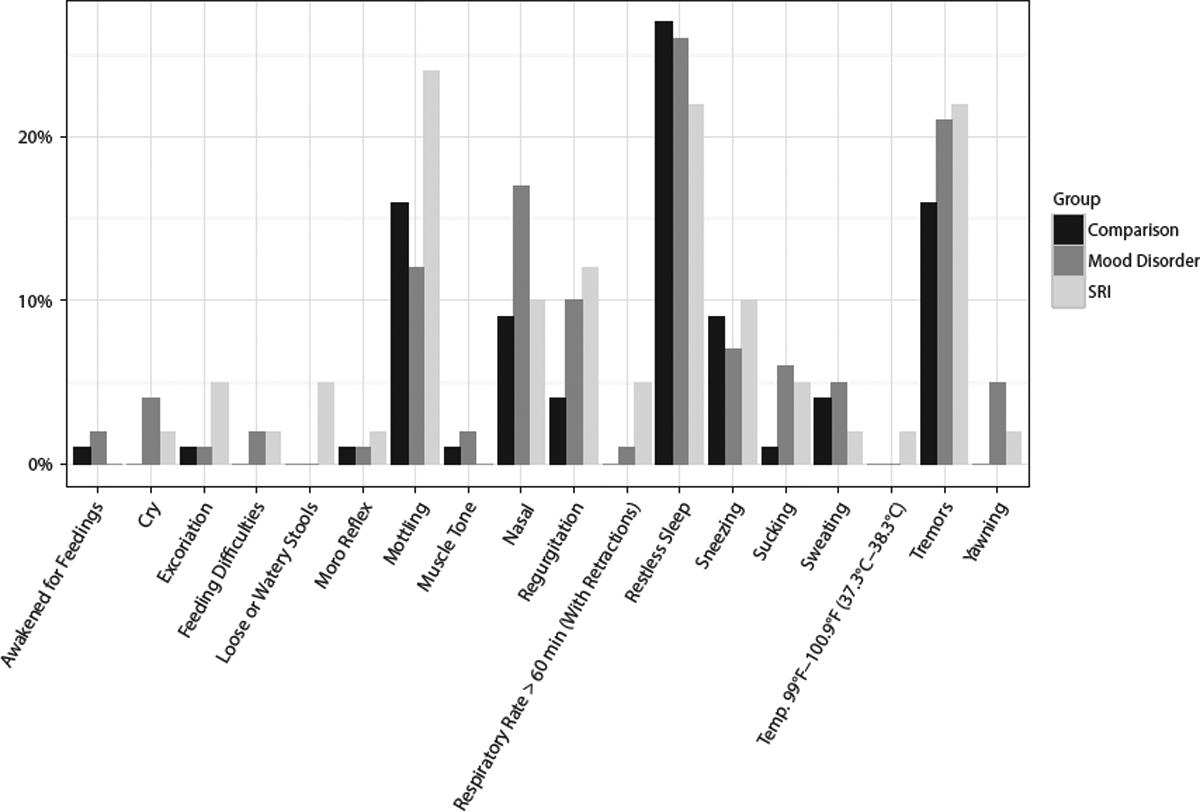
Percentage of Infants With Specific Finnegan Signs by Maternal Group
DISCUSSION
We did not confirm our hypothesis that both SRI-and mood disorder–exposed infants were more likely to experience Finnegan signs than the Comparison group at 2–4 weeks postbirth. We found similar rates of Finnegan signs related to exposure group; however, the presence of neonatal signs was more closely associated with prematurity rather than in utero SRI or mood disorder exposure. Our results may be due to some signs related to drug exposure resolving in the first 2 weeks postbirth7 while the behaviors associated with preterm birth continue beyond this time frame. Additionally, only 1 of 41 infants was exposed to paroxetine, which was the drug most strongly implicated in the FDA Adverse Event Reporting System and in case reports of NDS,2 and none were exposed to benzodiazepines.
Our results raise the question of the relationship between neonatal signs attributable to NDS and those associated with preterm birth. Investigators who have studied NDS have dealt with this issue by adjusting for preterm birth,3 matching infants on gestational age,7 or including only full-term infants in their samples.9 Behaviors associated with prematurity are likely to contribute to signs of NDS in preterm SRI exposed newborns. For example, Källèn20 noted a statistically significant increase in the risk for respiratory distress in SRI-exposed infants that was reduced after exclusion of preterm infants, which implies that factors related to prematurity contributed to this outcome.
This investigation and others21 demonstrate the complexity of determining the relationship of disease and/or drug exposure to reproductive and infant outcomes in observational studies. Significant differences are commonly observed in the demographic characteristics of women who are treated with SRI compared to those who are not, and both groups differ from women without psychiatric disorders.22 Racial and socioeconomic disparities in reproductive outcomes, including preterm birth, are well described. Caucasian race, maternal age greater than 25 years, and education beyond high school are predictors for antidepressant use during pregnancy.23 Studies from large datasets in which sophisticated propensity score matching is feasible have demonstrated substantial confounding related to depression disease factors when examining the effects of SRI on reproductive outcomes.21
Our study is unique in several aspects: (1) it focuses on information from an examination for signs and by parental report in a community cohort in the critical first 2–4 weeks of parental adjustment to the newborn and therefore captures the signs that rise to the level of the attention of parents and clinicians during this time frame; (2) the infants had no exposure to benzodiazepines (or drugs in the former FDA Category D or X), which increase the risk of neonatal signs when combined with SRIs; and (3) the NDS assessments were done by raters blind to maternal status (medication and/or diagnosis) during pregnancy.
Although the sample is well characterized, the trade-off is the relatively small size of the exposure groups. Since this is a secondary analysis, there were no a prior sample size or power calculations performed. The study team decided against any post hoc sample size or power calculation because it was an exploratory analysis. Another limitation is the scoring of the Finnegan Scale based partly upon maternal report, which captures signs important to mothers but is subject to variability related to maternal judgment.
In 2005, Moses-Kolko et al2 reviewed the literature and made a series of recommendations to advance the field; however, few have been realized. Research has been hampered by lack of consensus on a case definition and a standard measure for diagnosis. Pharmacologic characteristics differ among the SRI drugs, and studies of specific agents, rather than grouped SRI exposures, are compelling. Few investigators have examined the role maternal or fetal genetics in cord-to-maternal drug concentration ratios or in NDS despite the impact of several pharmacogenes on the metabolism of SRIs. Two small (< 40 infants) studies examined the role of infant genotypes of SLC6A4 (the serotonin receptor)24 and MAOA (monoamine oxidase A)25 genes. Both found genetic variants in their respective genes to be significantly associated with NDS. A new investigation within the National Institute of Child Health and Human Development Obstetric-Fetal Pharmacology Research Centers26 will support the evaluation of neonates whose mothers have well-defined SRI exposure and psychiatric symptoms across pregnancy. Maternal, cord blood, and neonatal plasma SRI concentrations and maternal and infant pharmacogenetic data will clarify the relationships among these measures and the time course of neonatal signs.
Clinical Points.
Neonatal discontinuation syndrome (NDS) has no consensus definition; therefore, the rates of and characteristics attributed to NDS have been widely variable based upon the definitions, measures, and samples used.
The presence of neonatal signs at 2–4 weeks of age was more closely associated with prematurity than with in utero serotonin reuptake inhibitor or mood disorder exposure.
Funding/support:
This work was supported by National Institute of Mental Health grants R01 MH-60335 and R01-MH07592.
Role of the sponsor: The National Institutes of Health had no role in the design and conduct of the study; collection, management, analysis, and interpretation of the data; preparation, review, or approval of the manuscript; and the decision to submit the manuscript for publication.
Footnotes
Potential conflicts of interest: The Department of Psychiatry at Northwestern University received contractual fees for Dr Wisner’s consultation to Quinn Emanuel Urquhart & Sullivan, LLP (New York City), who represent Pfizer Pharmaceutical Company, in 2015. Drs Ciolino, Rasmussen-Torvik, and Sit and Mss Yang and Pinheiro have no conflicts to disclose.
REFERENCES
- 1.Kieviet N, Hoppenbrouwers C, Dolman KM, et al. Risk factors for poor neonatal adaptation after exposure to antidepressants in utero. Acta Paediatr. 2015;104(4):384–391. [DOI] [PubMed] [Google Scholar]
- 2.Moses-Kolko EL, Bogen D, Perel J, et al. Neonatal signs after late in utero exposure to serotonin reuptake inhibitors: literature review and implications for clinical applications. JAMA. 2005;293(19):2372–2383. [DOI] [PubMed] [Google Scholar]
- 3.Grigoriadis S, VonderPorten EH, Mamisashvili L, et al. The effect of prenatal antidepressant exposure on neonatal adaptation: a systematic review and meta-analysis. J Clin Psychiatry. 2013;74(4):e309–e320. [DOI] [PubMed] [Google Scholar]
- 4.Forsberg L, Navér L, Gustafsson LL, et al. Neonatal adaptation in infants prenatally exposed to antidepressants—clinical monitoring using Neonatal Abstinence Score. PLoS One. 2014;9(11):e111327. [DOI] [PMC free article] [PubMed] [Google Scholar]
- 5.Wisner KL, Sit DK, Hanusa BH, et al. Major depression and antidepressant treatment: impact on pregnancy and neonatal outcomes. Am J Psychiatry. 2009;166(5):557–566. [DOI] [PMC free article] [PubMed] [Google Scholar]
- 6.Oberlander TF, Misri S, Fitzgerald CE, et al. Pharmacologic factors associated with transient neonatal symptoms following prenatal psychotropic medication exposure. J Clin Psychiatry. 2004;65(2):230–237. [DOI] [PubMed] [Google Scholar]
- 7.Laine K, Heikkinen T, Ekblad U, et al. Effects of exposure to selective serotonin reuptake inhibitors during pregnancy on serotonergic symptoms in newborns and cord blood monoamine and prolactin concentrations. Arch Gen Psychiatry. 2003;60(7):720–726. [DOI] [PubMed] [Google Scholar]
- 8.Rampono J, Simmer K, Ilett KF, et al. Placental transfer of SSRI and SNRI antidepressants and effects on the neonate. Pharmacopsychiatry. 2009;42(3):95–100. [DOI] [PubMed] [Google Scholar]
- 9.Levinson-Castiel R, Merlob P, Linder N, et al. Neonatal abstinence syndrome after in utero exposure to selective serotonin reuptake inhibitors in term infants. Arch Pediatr Adolesc Med. 2006;160(2):173–176. [DOI] [PubMed] [Google Scholar]
- 10.Salisbury AL, O’Grady KE, Battle CL, et al. The roles of maternal depression, serotonin reuptake inhibitor treatment, and concomitant benzodiazepine use on infant neurobehavioral functioning over the first postnatal month. Am J Psychiatry. 2016;173(2):147–157. [DOI] [PMC free article] [PubMed] [Google Scholar]
- 11.Hendrick V, Stowe ZN, Altshuler LL, et al. Placental passage of antidepressant medications. Am J Psychiatry. 2003;160(5):993–996. [DOI] [PubMed] [Google Scholar]
- 12.Boucher N, Koren G, Beaulac-Baillargeon L. Maternal use of venlafaxine near term: correlation between neonatal effects and plasma concentrations. Ther Drug Monit. 2009;31(3):404–409. [DOI] [PubMed] [Google Scholar]
- 13.Aoyama H Developmental neurotoxicity testing: scientific approaches towards the next generation to protect the developing nervous system of children: an overview of the Developmental Neurotoxicity Symposium in 2011. Congenit Anom (Kyoto). 2012;52(3):119–121. [DOI] [PubMed] [Google Scholar]
- 14.Shelton RC. The nature of the discontinuation syndrome associated with antidepressant drugs. J Clin Psychiatry. 2006;67(suppl 4):3–7. [PubMed] [Google Scholar]
- 15.Hudak ML, Tan RC, Frattarelli DAC, et al. ; Committee on Drugs; Committee on Fetus and Newborn; American Academy of Pediatrics. Neonatal drug withdrawal. Pediatrics. 2012;129(2):e540–e560. [DOI] [PubMed] [Google Scholar]
- 16.Williams JBW, Terman M. Structured Interview Guide for the Hamilton Depression Rating Scale with Atypical Depression Supplement (SIGH-ADS). New York, NY: New York State Psychiatric Institute; 2003. [Google Scholar]
- 17.Heidelise A, Duffy F, Mcnaulty G. Behavioral differences between preterm and full-term newborns as measured with the APIB System Scores: I. Infant Behav Dev. 1988;11(3):305–318. [Google Scholar]
- 18.Breslow NE, Day NE. Statistical methods in cancer research: volume I—the analysis of case-control studies. IARC Sci Publ. 1980; (32):5–338. [PubMed] [Google Scholar]
- 19.Zimmermann-Baer U, Nötzli U, Rentsch K, et al. Finnegan neonatal abstinence scoring system: normal values for first 3 days and weeks 5–6 in non-addicted infants. Addiction. 2010;105(3):524–528. [DOI] [PubMed] [Google Scholar]
- 20.Källén B Neonate characteristics after maternal use of antidepressants in late pregnancy. Arch Pediatr Adolesc Med. 2004;158(4):312–316. [DOI] [PubMed] [Google Scholar]
- 21.Huybrechts KF, Palmsten K, Avorn J, et al. Antidepressant use in pregnancy and the risk of cardiac defects. N Engl J Med. 2014;370(25):2397–2407. [DOI] [PMC free article] [PubMed] [Google Scholar]
- 22.Palmsten K, Hernández-Díaz S. Can nonrandomized studies on the safety of antidepressants during pregnancy convincingly beat confounding, chance, and prior beliefs? Epidemiology. 2012;23(5):686–688. [DOI] [PMC free article] [PubMed] [Google Scholar]
- 23.Cooper WO, Willy ME, Pont SJ, et al. Increasing use of antidepressants in pregnancy. Am J Obstet Gynecol. 2007;196(6):544.e1–544.e5. [DOI] [PubMed] [Google Scholar]
- 24.Oberlander TF, Bonaguro RJ, Misri S, et al. Infant serotonin transporter (SLC6A4) promoter genotype is associated with adverse neonatal outcomes after prenatal exposure to serotonin reuptake inhibitor medications. Mol Psychiatry. 2008;13(1):65–73. [DOI] [PubMed] [Google Scholar]
- 25.Hilli J, Heikkinen T, Rontu R, et al. MAO-A and COMT genotypes as possible regulators of perinatal serotonergic symptoms after in utero exposure to SSRIs. Eur Neuropsychopharmacol. 2009;19(5):363–370. [DOI] [PubMed] [Google Scholar]
- 26.Avram MJ, Stika CS, Rasmussen-Torvik LJ, et al. Rationale and design for an investigation to optimize selective serotonin reuptake inhibitor treatment for pregnant women with depression. Clin Pharmacol Ther. 2016;100(1):31–33. [DOI] [PubMed] [Google Scholar]