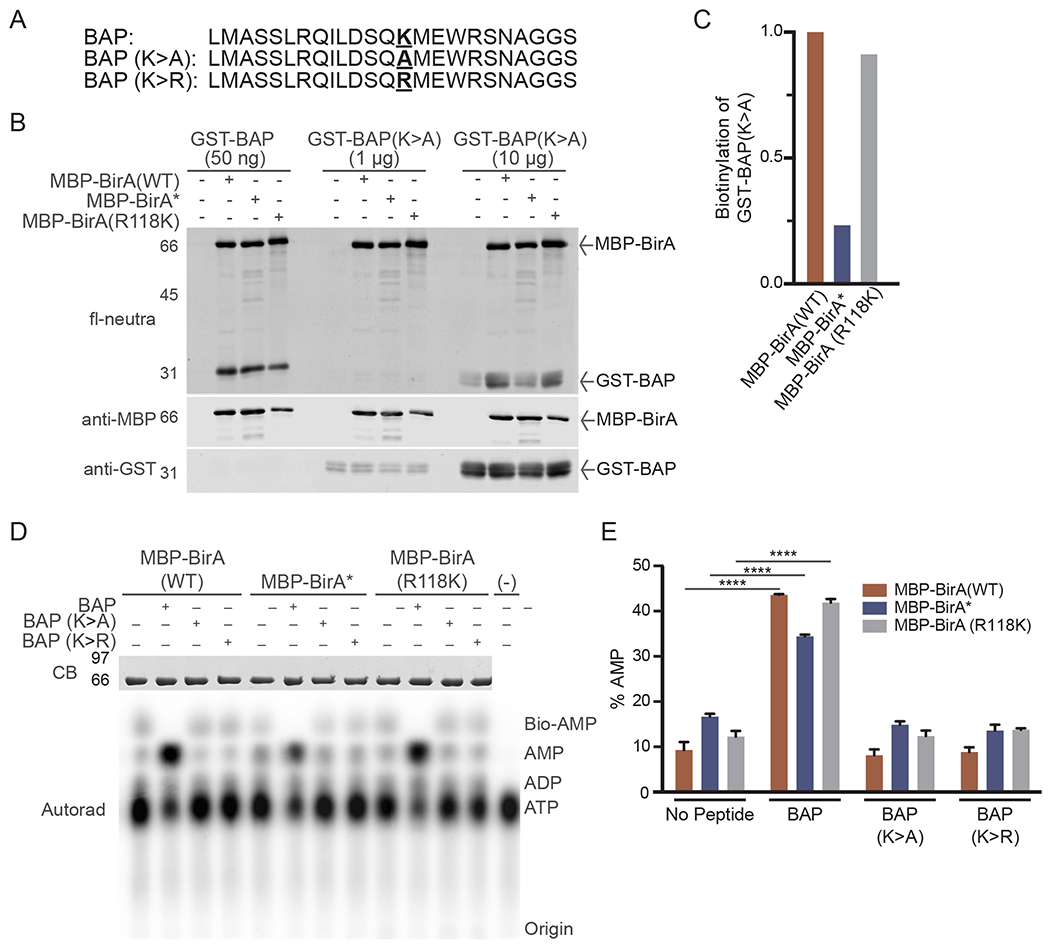
Fig. 4.

Utilization of Biotin Acceptor Peptide (BAPs) for analyzing BirA mutants. (A) BAP sequences showing the position of the acceptor lysine and amino acid substitutions (bold underline). (B) In vitro biotinylation of BAP substrates with purified BirA enzymes. Reactions contained MBP-BirA (1 μg) with the indicated amount of each BAP and biotin (50 μM). (C) Quantification of relative biotinylation of GST-BAP (K- > A) in (B) indicates proximity labeling of a site outside of the BAP acceptor lysine. (D) TLC analysis of basal and BAP-induced bioAMP and AMP generation by BirA proteins. Assays were performed in triplicate and analyzed by autoradiography, one set of which is shown in this panel. (E) Quantification of AMP generation by BirA mutants. The % AMP is the percentage of signal in each lane corresponding to [α-32P]-labeled AMP. (****p < 0.0001).
