

Abstract
Some structural insights into the conformations of the isonucleosides containing duplexes have been provided. Unrestrained molecular-dynamics simulations on 18-mer duplexes with isonucleosides incorporated at the 3'-end or in the center of one strand have been carried out with explicit solvent under periodic boundary conditions using the AMBER force field and the particle mesh Ewald method. The Watson–Crick hydrogen-bonding patterns of the duplexes studied remained intact throughout the simulation. For the modified duplexes, the changes observed in the inter-base pair parameters and backbone torsional angles were primarily localized at the isonucleoside-inserted area. All five structures studied remained in the B-form family. The decreased stacking abilities indicated by the large changes in inter-base pair parameters and the large changes in backbones made the modified duplexes show a minor thermal destabilization in comparison with native DNA. The MM_PBSA method for estimating binding free energies on two complementary strands was used. The results showed that the binding free energies of isonucleoside-incorporated DNA duplexes were lower than the native DNA duplex, which is in good agreement with experimental observations.

Keywords: MD simulations, Isonucleosidep, Backbone, Helix parameter, Thermal stability
Introduction
Synthetic oligonucleotides and their analogs have attracted considerable interest because of their potential therapeutic and diagnostic applications [1–5]. The natural oligonucleotides, however, are usually degraded relatively easily by cellular nucleases and cannot be used directly as therapeutics. It is therefore a challenge to develop modified antisense oligonucleotides that are degradation resistant, and can hybridize selectively to target nucleic acids with strong affinity. Over the past decades, a large number of oligonucleotides with modifications in the phosphodiester, sugar, or nucleobase have been prepared. Among them, phosphorothioate, which is the first generation of antisense compounds, shows increased resistance to degradation both in vitro and in vivo, [6–9] and one drug has been admitted to market by the FDA, which represents a first indication of the feasibility of the therapeutic antisense concept. Meanwhile, many antisense phosphorothioates are in phase I/II clinical trials [10, 11]. However, phosphorothioate oligonucleotides often show decreased specificity and affinity to the target sequences [12] and inefficient cellular uptake. Thus, other analogs, such as phosphoramidates [13], PNA [14], LNA [15], α-L-LNA [16], HNA [17], ANA [18], CAN [19], CeNA [20] and INA [21] have been studied systematically. They have proved to be capable of hybridizing with complementary DNA or RNA with increased thermal stabilities compared to the parent DNA:DNA or DNA:RNA duplexes and can be valid candidates for clinical applications.
We have reported the synthesis and enzymatic stability of oligonucleotides incorporated with isonucleosides [22–25]. Isonucleosides are a new class of nucleoside analogues in which the nucleobase is linked to various positions of ribose other than C1'. Previous research has shown that a single isonucleotide-incorporated oligonucleotide antagonized the enzymatic hydrolysis of snake-venom phosphodiesterase strongly, although the binding ability of the modified sequence to the complementary sequence was slightly decreased, which indicated that there was a possibility to design a stable antisense oligonucleotide by incorporating isonucleotides in the sequence [26]. For the detailed understanding of structural information of isonucleoside-modified antisense oligonucleotides, an 18-mer of the antisense sequence 5'- AACATCTCCTGAGGGAAC -3' incorporated with isonucleosides A 1 (6'-OH free) or A 2 (6'-OH protected by allyl group), which was complementary to the mRNA region encoding spike glycoprotein of the severe acute respiratory syndrome-associated coronavirus (SARS-CoV) (22,398–22,415 bp) has been studied by detailed unrestrained molecular dynamics in aqueous solution (Fig. 1). The results, which agree with the experimental data, provide an insight into the local and global structural features of the duplexes containing A 1 and A 2. The structural and energetic analysis from the MD simulations provides some information for further research and development of isonucleotide-incorporated antisense oligonucleotides.
Fig. 1.
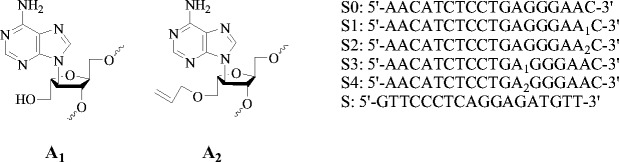
Schematic drawing of the isonucleosides and sequences of the 18-mer DNA oligonucleotides used in this study
Computational methods
All MD simulations were performed with the AMBER 7 molecular simulation package [27]. The AMBER 99 force field was used to describe the DNA. To obtain molecular mechanical parameters for the isonucleosides A 1 and A 2, ab initio quantum chemical methods were employed using the Gaussian 98 program. The geometries were fully optimized using the AM1 Hamiltonian and the electrostatic potentials around them were determined at the HF/6–31G** level. The RESP strategy [28] was used to obtain the partial atomic charges.
Starting models of DNA duplexes were built in the B canonical structures using the Insight II package [29]. All constructed oligonucleotide duplexes were solvated in TIP3P water using a rectangular box, which extended 10 Å away from any solute atom. This yielded about 4,400 water molecules used for solvation. To neutralize the negative charges of simulated molecules, Na+ counterions were placed next to each phosphate group.
Molecular dynamics (MD) simulations were carried out using the SANDER module of AMBER 7. At first, the water box and counterions were subjected to a series of equilibration MD runs while holding the DNA fixed [30, 31]. The equilibration runs began with 1,000 steps of minimization with a large constraint of 500 kcal mol−1 Å−2 on the DNA atoms and were followed by 25 ps of MD, reducing the constraints to 100 kcal mol−1 Å−2, during which the temperature was slowly raised from 100 to 300 K over 1 ps and was maintained at 300 K for the remaining 24 ps. The size of the box was allowed to change until the water density and pressure converged to the correct values. Subsequent equilibration steps, during which position constraints on the DNA molecules were gradually relaxed, as well as the final production runs, were done by using the particle mesh Ewald (PME) method to calculate electrostatic interactions [32, 33]. First, another 25 ps of MD were performed while still holding the DNA fixed to relax the solvent molecules fully and to complete the density equilibration. This was followed by a second set of 1,000 steps of minimization and 3 ps of MD, which were carried out with constraints on the DNA molecules of 25 kcal mol−1 Å−2. Finally, five rounds of 600 steps of energy minimization were performed, in which positional constraints were reduced to 5.0 kcal mol−1 Å−2 in each round.
After this initial equilibration, the whole system was heated from 100 to 300 K for 20 ps without positional constraints. The production simulations of 1 ns for S0:S, 2 ns for S1:S, and 1.5 ns for S2:S, S3:S, or S4:S were then started at constant pressure (1 atm) and temperature (300 K). In the entire simulation, SHAKE was applied to all hydrogen atoms [34]. Periodic boundary conditions with minimum-image conventions were applied to calculate the nonbonded interactions. A cutoff of 9 Å was used for the Lennard–Jones interactions. The nonbonded pairs were updated every 30 steps. An integration time step of 2 fs was used and the trajectory was saved every 100 steps for future analysis.
The MD trajectories were analyzed using AMBER 7 and in-house software. The final structure of each duplex was produced from the 1,000 steps of minimized averaged structure of the last 800 ps of MD. Helix parameters were calculated with the program CURVES 5.3 [35]. All calculations were performed on a 2-CPU SGI Octane workstation.
Free-energy analysis was performed using the MM_PBSA scripts supplied by AMBER 7.0 [36–38]. The total free energy can be estimated from the molecular mechanical energy, the solvation free energy, as well as the solute entropies for a series of snapshots and then averaging the results. The binding free energies of all double strands were investigated using the single-trajectory approach. Single-trajectory results mean that the thermodynamics data are extracted from a single trajectory of the complex. The assumption here is that the natural DNA, the isonucleoside-incorporated DNA, and the complementary DNA conformations are the same in the double strand and in the dissociated form and thus the vibrational, rotational, and translational entropy contributions can be neglected. Estimation of binding free energies in this manner has proven successful previously [36, 37, 39]. The binding free energy (ΔG binding) between the two complementary strands is calculated as the difference between the electrostatic interaction energies, van der Waals interaction energies, the solvation free energies, as well as the entropies of the double strands and the dissociated system:
 |
We applied the same force field and parameter set used in the MD simulations and an electrostatic constant 1 to compute the electrostatic energy (E elec) and the van der Waals energy (E vdw) but without cutoff for nonbonded interactions.
The solvation free energy (ΔG solv) was estimated from the electrostatic solvation energy (ΔG PB) and the nonpolar solvation energy (ΔG nonpolar):
 |
The electrostatic contribution to the solvation free energy (ΔG PB) was estimated with a Poisson–Boltzmann electrostatic continuum method using the program Delphi II [40]. The dielectric boundary is the molecular surface defined by a 1.4 Å probe sphere and by spheres centered on each atom with radii taken from the PARSE parameter set [41]. We used an interior dielectric of unity, and the outside dielectric was set to 80. For the Poisson–Boltzmann calculation, a cubic lattice with linear dimensions 80% larger than the longest dimension was applied with a 0.5 Å grid spacing; potentials at the boundaries of the finite-difference lattice were set to a sum of Debye–Huckel potentials [42]. The nonpolar contribution to the solvation free energy (ΔG nonpolar) was estimated from a surface-area dependent term using the solvent accessible surface area (SASA) algorithm and program of Sanner [43] with a parametrization of
 |
where γ=0.00542 kcal Å−1 and β=0.92 kcal mol−1. Solute entropic contributions (−TΔS) were estimated based on a harmonic approximation to the normal modes and standard (quantum) formulae at 300 K [44]. Snapshots from the MD trajectories of the natural and isonucleoside-incorporated DNA–DNA hybrids with water and counterions removed were considered for the binding-free-energy calculations. A total of 80 snapshots were selected at 10 ps intervals from each of the 800 ps trajectories.
Results and discussions
Convergence in the trajectories
The five unrestrained MD simulations of the duplexes studied led to stable trajectories of geometry and energy terms. Calculations of root-mean-square deviations (RMSDs) with respect to the starting B-form structures confirmed the stability of the trajectory. Five plots of the RMSD values as a function of the simulation time are shown in Fig. 2.
Fig. 2.

The root mean square deviations (RMSDs) of the atoms from their initial positions after preparatory steps during the 1-ns simulation of the native DNA duplex, 2.0- and 1.5-ns simulations of the four isonucleosides-incorporated DNA duplexes a S0:S, b S1:S, c S2:S, d S3:S, e S4:S
For the native DNA duplex, a fast convergence of RMSD was observed. The RMSD rose to 2.2 Å within about 100 ps, and averaged around 2.5 Å in the final stage of the simulation. The RMSD of duplex S1:S and S3:S trajectories also showed a sharp increase to about 3.5 Å in the first 200 ps, and then remained stable for the rest of the simulation (average RMSD around 4.0 Å). The RMSD values of S2:S and S4:S duplexes showed a significantly slow increase during the first 700 ps and 500 ps, respectively, which indicated a movement and structural change of the molecules. Then the RMSD values stabilized and remained stable, oscillating around their average values up to the 1.5 ns of the MD simulation. Therefore, only conformations generated during the last 800 ps period of simulations were used to monitor the structure properties. The comparison of the time evolution of the RMSDs showed that the duplexes of S2:S and S4:S were more difficult to achieve conformational equilibrium than the other ones. For the S0:S duplex, a slightly smaller average RMSD value (2.65 Å) was obtained than for the S1:S (3.68 Å), S2:S (3.23 Å), S3:S (3.70 Å), and S4:S (3.35 Å) duplexes (Table 1), which indicated that S0:S was closer to the started B-form conformation than the other four modified duplexes.
Table 1.
The RMSD values from averaging the trajectories for the five duplexes studied
| S0:S | S1:S | S2:S | S3:S | S4:S | |
|---|---|---|---|---|---|
| RMSD | 2.65(0.59) | 3.68(0.89) | 3.23(0.77) | 3.70(0.80) | 3.35(0.66) |
Hydrogen-bonding
An important indicator of the stability of duplex structures is the length of hydrogen bonds and percentage occupancy during the MD simulations. A summary of Watson–Crick hydrogen-bond lengths and their standard deviations between the base pairs in each of the five duplexes during the last 800 ps of the MD is given in Table 2. The hydrogen bonds in any of the five structures were well maintained and the majority was 100% occupied during the simulation. The results showed clearly that there were no obvious differences in hydrogen bonding properties among S0:S, S1:S, S2:S, S3:S, and S4:S duplexes.
Table 2.
Average Watson–Crick hydrogen bonding distances (and standard deviations) calculated over the last 800 ps of the MD trajectories
| Base pairs | S0:S | S1:S | S2:S | S3:S | S4:S |
|---|---|---|---|---|---|
| N1(1)…H3(36) | 2.01 (0.14) | 2.01(0.14) | 2.03 (0.15) | 4.56 (0.61) | 2.01 (0.18) |
| H61(1)…O4(36) | 2.06 (0.25) | 2.03(0.21) | 2.01 (0.20) | 5.12 (1.05) | 2.22 (0.39) |
| N1(2)…H3(35) | 1.97 (0.12) | 1.98(0.12) | 1.96 (0.11) | 1.98 (0.15) | 2.01 (0.13) |
| H61(2)…O4(35) | 2.04 (0.24) | 1.99(0.18) | 2.01 (0.20) | 2.02 (0.20) | 1.99 (0.18) |
| H41(3)…O6(34) | 2.01 (0.18) | 2.01(0.18) | 2.08 (0.38) | 1.98 (0.18) | 2.01 (0.19) |
| N3(3)…H1(34) | 1.96 (0.10) | 1.95(0.09) | 1.98 (0.17) | 1.96 (0.09) | 1.95 (0.10) |
| O2(3)…H21(34) | 1.88 (0.12) | 1.87(0.11) | 1.88 (0.12) | 1.91 (0.13) | 1.88 (0.11) |
| N1(4)…H3(33) | 1.96 (0.12) | 1.95(0.10) | 1.96 (0.11) | 1.98 (0.12) | 1.97 (0.12) |
| H61(4)…O4(33) | 2.02 (0.19) | 2.04(0.21) | 2.02 (0.20) | 1.99 (0.17) | 2.02 (0.20) |
| H3(5)…N1(32) | 1.96 (0.11) | 1.96(0.10) | 2.01 (0.13) | 1.96 (0.11) | 1.98 (0.11) |
| O4(5)…H61(32) | 2.05 (0.22) | 2.01(0.18) | 2.00 (0.18) | 2.10 (0.24) | 1.98 (0.15) |
| H41(6)…O6(31) | 1.97 (0.16) | 1.98(0.16) | 1.98 (0.16) | 2.00 (0.19) | 2.00 (0.17) |
| N3(6)…H1(31) | 1.95 (0.09) | 1.95(0.08) | 1.93 (0.08) | 1.94 (0.09) | 1.97 (0.10) |
| O2(6)…H21(31) | 1.91 (0.14) | 1.90(0.12) | 1.89 (0.12) | 1.89 (0.11) | 1.90 (0.14) |
| H3(7)…N1(30) | 1.95 (0.11) | 1.95(0.11) | 1.95 (0.11) | 1.94 (0.11) | 2.01 (0.14) |
| O4(7)…H61(30) | 2.04 (0.22) | 2.01(0.19) | 2.09 (0.26) | 2.09 (0.23) | 1.97 (0.16) |
| H41(8)…O6(29) | 1.98 (0.16) | 1.97(0.15) | 1.99 (0.18) | 1.98 (0.15) | 1.98 (0.15) |
| N3(8)…H1(29) | 1.93 (0.09) | 1.95(0.08) | 1.95 (0.09) | 1.95 (0.09) | 1.95 (0.10) |
| O2(8)…H21(29) | 1.91 (0.13) | 1.90(0.12) | 1.92 (0.13) | 1.90 (0.13) | 1.92 (0.13) |
| H41(9)…O6(28) | 2.06 (0.23) | 1.97(0.17) | 2.00 (0.20) | 1.96 (0.16) | 2.02 (0.20) |
| N3(9)…H1(28) | 1.95 (0.10) | 1.95(0.08) | 1.95 (0.10) | 1.94 (0.09) | 1.95 (0.09) |
| O2(9)…H21(28) | 1.88 (0.12) | 1.92(0.14) | 1.88 (0.11) | 1.87 (0.11) | 1.90 (0.12) |
| H3(10)…N1(27) | 1.96 (0.11) | 1.94(0.10) | 1.96 (0.11) | 1.99 (0.13) | 1.94 (0.11) |
| O4(10)…H61(27) | 1.98 (0.16) | 2.01(0.20) | 1.97 (0.16) | 1.97 (0.17) | 2.04 (0.21) |
| O6(11)…H41(26) | 1.99 (0.17) | 1.97(0.15) | 1.97 (0.16) | 1.98 (0.15) | 1.98 (0.15) |
| H1(11)…N3(26) | 1.97 (0.10) | 1.96(0.09) | 1.96 (0.09) | 1.96 (0.09) | 1.97 (0.09) |
| H21(11)…O2(26) | 1.89 (0.12) | 1.92(0.13) | 1.90 (0.13) | 1.90 (0.12) | 1.89 (0.12) |
| N1(12)…H3(25) | 1.99 (0.12) | 1.97(0.11) | 1.97 (0.12) | 1.99 (0.11) | 2.08 (0.14) |
| H61(12)…O4(25) | 1.96 (0.16) | 1.99(0.17) | 1.97 (0.17) | 2.05 (0.19) | 1.92 (0.14) |
| O6(13)…H41(24) | 1.96 (0.15) | 1.99(0.18) | 2.01 (0.19) | 1.96 (0.15) | 2.09 (0.35) |
| H1(13)…N3(24) | 1.94 (0.09) | 1.95(0.09) | 1.95 (0.10) | 1.94 (0.09) | 1.98 (0.16) |
| H21(13)…O2(24) | 1.88 (0.11) | 1.89(0.12) | 1.91 (0.14) | 1.87 (0.12) | 1.84 (0.11) |
| O6(14)…H41(23) | 1.96 (0.16) | 1.98(0.17) | 2.00 (0.21) | 2.03 (0.22) | 1.99 (0.16) |
| H1(14)…N3(23) | 1.95 (0.09) | 1.94(0.08) | 1.96 (0.10) | 1.97 (0.10) | 1.98 (0.10) |
| H21(14)…O2(23) | 1.88 (0.12) | 1.90(0.13) | 1.90 (0.13) | 1.93 (0.13) | 1.90 (0.12) |
| O6(15)…H41(22) | 1.96 (0.14) | 1.98(0.19) | 1.99 (0.17) | 1.96 (0.18) | 2.01 (0.18) |
| H1(15)…N3(22) | 1.96 (0.08) | 1.94(0.09) | 1.97 (0.10) | 1.97 (0.10) | 1.97 (0.10) |
| H21(15)…O2(22) | 1.90 (0.12) | 1.92(0.14) | 1.94 (0.15) | 1.97 (0.16) | 1.90 (0.14) |
| N1(16)…H3(21) | 1.98 (0.12) | 1.94(0.11) | 1.95 (0.12) | 1.98 (0.12) | 1.99 (0.12) |
| H61(16)…O4(21) | 2.01 (0.20) | 2.05(0.20) | 2.14 (0.26) | 1.98 (0.18) | 2.00 (0.18) |
| N1(17)…H3(20) | 1.98 (0.12) | 2.01(0.13) | 2.09 (0.17) | 1.95 (0.11) | 1.95 (0.10) |
| H61(17)…O4(20) | 2.01 (0.20) | 2.01(0.17) | 1.98 (0.17) | 3.62 (0.24) | 2.04 (0.19) |
| H41(18)…O6(19) | 2.11 (0.49) | 6.72(2.33) | 2.01 (0.20) | 2.14 (0.53) | 2.03 (0.23) |
| N3(18)…H1(19) | 2.03 (0.23) | 4.86(1.95) | 1.97 (0.10) | 2.02 (0.23) | 1.97 (0.11) |
| O2(18)…H21(19) | 1.92 (0.15) | 3.88(1.47) | 1.89 (0.13) | 1.90 (0.14) | 1.92 (0.15) |
The data showed that the average distances of N1(17)…H3(20) and H61(17)…O4(20) hydrogen bonds for S0:S were 1.98 and 2.01 Å, respectively. The corresponding values for S1:S and S2:S were 2.01 and 2.01, 2.09 and 1.98 Å, respectively. Moreover, the average distances of N1(12)…H3(25) and H61(12)…O4(25) hydrogen bonds for S0:S, S3:S, and S4:S were 1.99 and 1.96, 1.99 and 2.05, 2.08 and 1.92 Å, respectively. The lengths of hydrogen bonds for base pairs A 1–T and A 2–T in the modified duplexes were quite similar to those in the native DNA. Therefore, the position change of nucleobase in isonucleosides A 1 or A 2 did not obviously affect the hydrogen bonding of the Watson–Crick base pairs in the modified DNA duplexes.
Helix parameters
There are three major categories of helical parameters, i.e., axis-base pair, intra-base pair and inter-base pair parameters [45]. The axis-base pair parameter describes the position and orientation of the base pairs relative to the helical axis. The intra-base pair parameter describes the geometry of the Watson–Crick base pairings, while the interbase pair parameter describes the stacking interactions of the bases. Generally, the conformations of the five duplexes studied were found to remain in the B-conformations during the entire course of the simulations. A few parameters, however, indicated some features of A-type DNA. Average values of helix parameters for canonical A, canonical B, and the five studied duplexes from the last 800 ps of MD simulations calculated by the program Curves 5.3 are shown in Table 3. Values of the parameters slide, rise, roll, and twist along the sequence for the MD-averaged structures of the studied duplexes are plotted in Fig. 3.
Table 3.
Average helical parameters over the last 800 ps of the MD trajectories for five duplexes studied
| A canonical | B canonical | S0:S | S1:S | S2:S | S3:S | S4:S | |
|---|---|---|---|---|---|---|---|
| Xdisp (Å) | −5.43 | −0.77 | −1.70 | −0.29 | −1.70 | −2.01 | −0.89 |
| Ydisp (Å) | 0.0 | 0.0 | 0.05 | 0.14 | 0.09 | −0.27 | 0.00 |
| Inclination (deg) | 19.2 | −6.2 | 0.62 | −8.17 | 0.47 | 3.77 | −3.89 |
| Tip (deg) | 0.0 | 0.0 | −0.13 | 1.02 | −1.21 | 3.49 | 0.54 |
| Shear (Å) | 0.0 | 0.0 | 0.06 | −0.18 | 0.08 | 0.12 | 0.04 |
| Stretch (Å) | −0.45 | 0.0 | 0.03 | 0.14 | 0.05 | 0.03 | 0.05 |
| Stagger (Å) | 0.19 | 0.05 | −0.06 | 0.08 | −0.06 | −0.15 | −0.16 |
| Buckle (deg) | 0.0 | 0.0 | 1.38 | 3.33 | 1.13 | 5.73 | 3.04 |
| Propeller (deg) | 13.9 | 3.8 | −12.03 | −12.84 | −11.98 | −12.51 | −9.18 |
| Opening (deg) | −4.6 | −4.1 | 4.61 | 3.25 | 4.98 | 4.32 | 4.90 |
| Shift (Å) | 0.0 | 0.0 | −0.01 | 0.04 | 0.00 | −0.04 | −0.03 |
| Slide (Å) | 0.0 | 0.0 | −0.05 | −0.13 | −0.07 | −0.03 | −0.13 |
| Rise (Å) | 2.56 | 3.38 | 3.29 | 3.46 | 3.33 | 3.32 | 3.46 |
| Tilt (deg) | 0.0 | 0.0 | −0.36 | 2.01 | −0.64 | 0.13 | −0.59 |
| Roll (deg) | 0.0 | 0.0 | 1.18 | 3.34 | 1.99 | 0.63 | 3.95 |
| Twist (deg) | 32.7 | 36.0 | 33.00 | 32.69 | 32.48 | 32.39 | 31.61 |
Fig. 3.

A selection of global inter-base-pair parameters (slide, rise, roll, and twist) along the sequence calculated for the MD-averaged structures of the S0:S (black), S1:S (red) and S2:S (blue) at the left panel as well as S0:S (black), S3:S (red) and S4:S (blue) at the right panel (the first and the last base pairs are not considered)
Axis-base pair parameters
For the five duplexes studied, the helix parameters Xdisp, Ydisp, inclination, and tip were closer to the canonical B-type DNA than to the canonical A-type DNA. There was a significant variation in the values of Ydisp and tip along the strand of modified structures S1:S, S2:S, S3:S, and S4:S. This was related to the slightly bent helix axis in these structures (Fig. 4).
Fig. 4.

Side views of the average structures with their global axis over the last 800 ps of a S0:S, b S1:S, c S2:S, d S3: S, e S4:S
Intra-base pair parameters
The calculated values for shear, stretch, and stagger of five DNA structures did not show much deviation from B-type DNA. The buckle changes significantly with a range of −20 to 30° along the strand. The values of propeller twist and opening all deviated from either A-type or B-type DNA. Especially, large positive values of the opening parameter were observed for all five duplexes, and indicated opening toward the major groove. A more noticeable parameter was the propeller twist (the relative rotation between the two-paired bases). Propeller twist up to −30° is native [46] to the AT base pair of DNA. The calculated values for propeller twist varied significantly along the strand with a range of −25 to 10°.
Inter-base pair parameters
The shift, slide, tilt, and roll parameters did not deviate much from either B- or A-DNA and were within values normally observed in either A-type or B-type DNA. The rise parameter, which indicated vertical displacement of one base pair with respect to the other, remained in the range for canonical B-DNA (average value 3.38 Å) for all base pair steps of the five DNA duplexes. All were more characteristic of B-DNA than A-DNA. They remained at around 3.29, 3.46, 3.33, 3.32, and 3.46 Å for S0:S, S1:S, S2:S, S3:S, and S4:S, respectively. For all duplexes, the values of twist changed along the strands. However, for the majority of the base pairs of each duplex, values even lower than that of A-DNA were observed. The average twists over the sequence were 32±1°. The value was more characteristic of A than B. This showed particularly that the modifications did not cause the helix to unwind.
In general, it could be concluded from the calculated results of all helix parameters that the overall conformations of the five duplexes remained in the B-conformations during the entire course of the simulations. It is known that the global intra-base pair parameters describe the relative displacement and orientation of the bases in the Watson–Crick base pairs. These parameters of the native S0:S duplex obtained during the simulation were very similar to those found in the four modified DNA duplexes (especially in the modified base-pair steps) according to our calculations. The parameters also explained why there were no fundamental differences in hydrogen-bonding properties among duplex S0:S, S1:S, S2:S, S3:S, and S4:S. However, for the inter-base pair parameters, several showed large differences in the modified area, which might indicate the effect of the isonucleosides on the conformation of the neighboring bases.
The A 1-T20/A16-T21 (0.78 Å), A 2-T20/A16-T21 (0.97 Å) and A 1-T25/G11-C26 (0.63 Å), A 2-T25/G11-C26 (1.04 Å) base-pair steps in S1:S, S2:S and S3:S, S4:S structures, respectively, exhibited significantly larger slide values than the corresponding A17-T20/A16-T21 (0.12 Å) and A12-T25/G11-C26 (0.20 Å) base-pair steps in S0:S. The rise parameters showed large deviations for the A 1, A 2, and their neighboring base-pair steps in the S2:S, S3:S, and S4:S duplexes from corresponding native S0:S values. Wherever the isonucleoside A 1 or A 2 was located at the 3'-end or in the center of the sequence, the slide and rise values of the A 2 base pair steps was larger than those of the A 1 ones. The A 1-T20/A16-T21 (29.1°) or A 2-T20/A16-T21 (21.2°) base pair steps in the S1:S or S2:S duplexes, respectively, showed larger roll values than in the S0:S duplex. In the S3:S and S4:S duplexes, the isonucleosides A 1 and A 2 induced changes in the roll of the steps below and above but not in the steps connected by A 1 and A 2 themselves. As shown in Fig. 3, the twist angles of S0:S, S2:S, and S3:S did not show obvious changes along the sequence. However, for S1:S and S4:S duplexes, significant differences were observed in the twist values. The lowest twist angle was found for the A 1-T20/A16-T21 step (12.5°) in S1:S structure at this base pair step. And the C6-G31/T5-A30, T10-A27/C9-G26 and G13-C24/A 2-T23 steps in the S4:S structure also showed small twist values lower than 20°. These small twist values were an indicator of untwisting of the DNA helix at the corresponding sites. Such small twist values for the G13-C24/A 2-T23 step might be caused by the incorporation of isonucleoside A 2, but we need much more studies to understand why the T10-A27/C9-G26 and G13-C24/A 2-T23 steps also show so small twist values.
Inter-base-pair parameters were used to describe the stacking interactions of base pairings. Thus, the unusually large changes in these parameters for the isonucleoside area decreased the stacking interactions of base pairings in the modified S1:S, S2:S, S3:S, and S4:S duplexes. These decreased stacking interactions made the duplexes incorporated with isonucleosides a little less stable than the unmodified DNA molecule, in agreement with the energy comparison.
Backbone conformation
For the S0:S duplex, the average values of the torsional angles over all sequences were close to those of the standard canonical B structure. Only small differences of all torsional angles were observed for the S0 and S strands. Most of the S0:S backbone torsions were restricted to move in a relatively narrow range around the optimum value. The range of the dynamic averages and the RMSD fluctuations for the torsional angles indicated that the backbones of S0:S were quite rigid (data not shown). The presence of the isonucleosides A 1 and A 2 produced large deviations in backbone torsional angles in the modified area in comparison with those in the corresponding area of the natural DNA duplex (Table 4), which resulted in visible kinks in the backbone but did not have a significant impact on the whole backbone conformation of the modified duplexes. The rest of the sugar-phosphate backbone remained in the range expected for the B-DNA family.
Table 4.
Averaged values of the backbone torsional angles (in degrees) for A12 and A17 in the S0 strand, A1 in the S1 and S3 strands, and A2 in the S2 and S4 strandsa
| Torsional angles | S0(A17) | S1(A1) | S2(A1) | S0(A12) | S3(A2) | S4(A2) |
|---|---|---|---|---|---|---|
| α | −68.0 | −86.2 | −80.8 | −66.7 | −67.3 | −126.7 |
| β | 173.1 | −175.3 | −175.5 | 171.7 | 161.4 | 177.8 |
| γ | 52.7 | −56.9 | −56.8 | 54.7 | −113.0 | −56.4 |
| δ | 128.2 | −116.4 | −125.4 | 125.8 | −112.8 | −126.1 |
| ɛ | −171.0 | 88.1 | −59.6 | −173.1 | −59.9 | −64.6 |
| ζ | −97.2 | 73.6 | −92.0 | −96.5 | −72.7 | −86.3 |
| χ | −115.9 | 165.5 | 175.5 | −114.6 | 176.1 | 179.0 |
aValues are averages over the last 800 ps of the MD trajectories
The sugar puckers for the native residues in all five duplexes possess C1'-exo conformations. Minor distortions were observed for the sugar-pucker conformations for the isonucleosides A 1 and A 2. The average values for sugar puckers during the last 800 ps of the simulations are summarized in Table 5.
Table 5.
Average values of the sugar conformation for the isonucleosides A1 and A2 in the modified DNA duplexesa
| A1 | A2 | |
|---|---|---|
| S1:S | C2'-exo/C3'-endo range | |
| (−5±35°) | ||
| S2:S | C2'-exo/C3'-endo range | |
| (−5±30°) | ||
| S3:S | C2'-exo/C3'-endo range | |
| (4±15°) | ||
| S4:S | C2'-exo/C3'-endo range | |
| (−5±35°) |
aValues are averages over the last 800 ps of the MD trajectories
The results indicate that the backbones of native DNA bear higher structural stability than those of modified oligonucleotides in the neighborhood of the modified sequence. The large changes in the backbone torsional angles of the isonucleoside region result in large deviations in some of the inter-base-pair parameters for the modified base pair step, and hence minimize the degree of hybridization of the modified duplexes.
The side views of the five DNA structures studied with their global axis are shown in Fig. 4, which demonstrate that all duplexes have the features of B-DNA. The C6’–OH and C6'–OCH2=CH–CH3 groups in the isonucleosides A 1 and A 2 point toward the major groove. The average structures of the isonucleosides incorporated region in the S1:S, S2:S, S3:S, and S4:S duplexes are shown in Fig. 5.
Fig. 5.

Views of the average structures of the isonucleoside-incorporated region. The isonucleosides A 1 and A 2 are indicated in red. The A16-A 1-C18/G19-T20–T21 in the S1:S (left, the structure of base C18 distorted because of the end base pair opening) and the A16-A 2-C18/G19-T20–T21 in the S2:S (right) are shown at the top, the G11-A 1-G13/C24-T25-C26 in the S3:S (left) and the G11-A 2-G13/C24-T25-C26 in the S4:S (right) are shown at the bottom
Binding free energies of the five duplexes studied
The binding free-energy contributions of all DNA duplexes studied are listed in Table 6. The calculations are based on single trajectories of the duplexes.
Table 6.
Energy contributions to the free energy of binding of the five DNA duplexes from the MD trajectoriesa and the melting temperatures (T m) from experimentb
| S0:S | S1:S | S2:S | S3:S | S4:S | |
|---|---|---|---|---|---|
| ΔE elec | 3986.1(42.5) | 3954.4(54.8) | 3963.9(35.3) | 3956.0(27.0) | 3970.1(49.0) |
| ΔE vdW | −88.1(7.6) | −88.8(6.9) | −86.6(6.8) | −89.9(7.8) | −87.7(7.3) |
| ΔG nonpolar | −8.4(0.2) | −8.4(0.1) | −8.3(0.1) | −8.6(0.1) | −8.5(0.2) |
| ΔG PB | −3975.7(41.3) | −3940.5(51.6) | −3951.3(33.7) | −3934.4(26.7) | −3952.0(47.6) |

|
10.4(8.3) | 13.9(9.2) | 12.6(9.1) | 21.6(7.6) | 18.1(8.3) |
| −TΔS | 62.5(13.0) | 62.3(12.8) | 61.7(11.4) | 61.0(11.2) | 61.4(10.8) |
| ΔG binding | −23.6 | −21.5 | −21.6 | −15.9 | −15.7 |
| T m(°C) | 61.5 | 58.6 | 59.3 | 54.1 | 54.2 |
aAll mean energies over 80 structures are in kcal mol−1. Values in parentheses are standard deviations of the mean energies. Δ is defined as (DNA–DNA)−(DNA single strand+complementary DNA single strand). Strands for the electrostatic contribution to the binding energy: ΔE elec+ΔG PB
bValues from [26]
The calculated value for binding of the S0:S hybrid is −23.6 kcal mol−1, more stable by 2.1, 2.0, 7.7, and 7.9 kcal mol−1, respectively, than the isonucleoside-modified S1:S, S2:S, S3:S, and S4:S hybrids. The binding free energy of S1:S (−21.5 kcal mol−1) is close to that of the S2:S (−21.6 kcal mol−1). Those of S3:S (−15.9 kcal mol−1) and S4:S (−15.7 kcal mol−1) agree similarly. However, the incorporation of A 1 and A 2 modifications at the 3'-end of the strand (duplexes S1:S and S2:S) create lower binding free energies by 5.6 and 5.9 kcal mol−1, respectively, compared to the duplexes with isonucleosides in the center of the sequence (duplexes S3:S and S4:S). UV thermal stability measurements [26] show that the oligonucleotide consisting of isonucleoside A 1 or A 2 decreases the affinity for the complementary DNA. A 2-containing oligonucleotides do not show obvious affinity differences to the complementary DNA compared to corresponding A 1-containing sequences. However, the duplex in which A 1 (A 2) is at the 3'-end of the sequence has higher thermal stability than the duplex in which A 1 (A 2) is in the center of the sequence. The calculated results and experiment are in good agreement.
Comparing the van der Waals/nonpolar (ΔE
vdw/ΔG
nonpolar), the electrostatic (ΔE
elec+ΔG
PB) and the solute entropic contributions (−TΔS), we find that the association between the two strands in the five duplexes studied is mainly driven by more favorable van der Waals interactions. As shown in Table 6, the van der Waals, nonpolar and solute entropic contributions in the natural DNA hybrid are close to those in the other four isonucleoside-incorporated hybrids. In the S0:S duplex, the electrostatic contribution  decreases by 3.5, 2.2, 11.2, and 7.7 kcal mol−1, respectively, in comparison with those in the S1:S, S2:S, S3:S, and S4:S duplexes, which causes a l repulsive force and thus further leads to the highest binding affinity in the natural S0:S duplex. The electrostatic contributions are lower for the S1:S and S2:S than for the S3:S and S4:S by 7.7 and 5.5 kcal mol−1, respectively. The unfavorable strand–strand electrostatic repulsive interactions make the S3 and S4 strands produce worse affinity with the S strand, in comparison with S1 and S2 stands.
Overall, the binding free-energy differences observed between the five DNA duplexes studied are mainly driven by the different electrostatic interactions between complementary strands. For the S1:S, S2:S, S3:S, and S4:S duplexes, more unregularity of the structures on the modified region (compared with the natural DNA) make some atoms approach each other closely, causing a large repulsive force and thus further contributing to the unfavorable thermal stabilization.
Conclusions
Unrestrained molecular-dynamics simulations were performed on a 1.0–2.0 ns scale for an 18-mer DNA duplex S0:S and isonucleoside-incorporated duplexes S1:S, S2:S, S3:S, or S4:S, in water with full periodic boundary conditions and Na+ counterions using the particle mesh Ewald method. The results show that the S2:S and S4:S duplexes achieve conformational equilibrium with difficulty. Watson–Crick hydrogen bonds remained intact throughout the simulations and there were no fundamental differences in the hydrogen-bonding properties of the S0:S, S1:S, S2:S, S3:S, and S4:S duplexes.
The backbone torsional angles and the helicoidal parameters support the view that the overall structures of all five duplexes are quite close to the canonical B-type DNA. For the four modified duplexes S1:S, S2:S, S3:S, and S4:S, the large changes in the inter-base-pair parameters and backbone torsional angles for the modified area in comparison with natural S0:S demonstrate that dramatic alterations of structures occur because of the incorporation of the two isonucleosides. These alterations produce decreased stacking abilities and large electrostatic repulsive forces and thus lead to unfavorable thermal stabilization for the modified DNA duplexes.
The MM_PBSA method was used to compute binding free energies of two complementary strands of the DNA duplexes studied. The calculated values showed that the natural DNA duplex has a lower binding free energy than the duplexs containing isonucleosides and the duplex in which A 1 (A 2) is at the 3’-end of the sequence has a lower binding free energy than the duplex in which A 1 (A 2) is in the center of the sequence, which were in good agreement with experimental results. The differences in binding free energies between five duplexes are mainly driven by the different electrostatic interactions between complementary strands.
Acknowledgement
This work was supported by the National Natural Science Foundation of China (20132030, SFCBIC 20320130046, 20332010).
References
- 1.Uhlmann E, Peyman A. Chem Rev. 1990;90:543–584. doi: 10.1021/cr00102a001. [DOI] [Google Scholar]
- 2.Crooke ST. Annu Rev Pharmacol Toxicol. 1992;32:329–376. doi: 10.1146/annurev.pa.32.040192.001553. [DOI] [PubMed] [Google Scholar]
- 3.Crook ST. FASEB J. 1993;7:533–539. doi: 10.1096/fasebj.7.6.7682523. [DOI] [PubMed] [Google Scholar]
- 4.Cook PD. In: Antisense research and applications. Crook ST, Lebleu B, editors. Boca Raton, FL: CRD; 1993. pp. 149–187. [Google Scholar]
- 5.Sanghvi YS, Cook PD. In: Nucleosides and nucleotides as antitumor and antiviral agents. Chu CK, Baker DC, editors. New York: Plenum; 1993. pp. 311–324. [Google Scholar]
- 6.Sands H, Gorey-Feret LJ, Cocuzza AJ, Hobbs FW, Chidester D, Trainor GL. Mol Pharmacol. 1994;45:932–943. [PubMed] [Google Scholar]
- 7.Iverson PL, Mata J, Tracewell WG, Zon G. Antisense Res Dev. 1994;4:43–52. doi: 10.1089/ard.1994.4.43. [DOI] [PubMed] [Google Scholar]
- 8.Cossum PA, Sasmor H, Dellinger D, Truong L, Cummins L, Owens SR, Markham PM, Shea JP, Crooke S. J Pharmacol Exp Ther. 1993;267:1181–1190. [PubMed] [Google Scholar]
- 9.Temsamani J, Tang JY, Padmapriya A, Kubert M, Agrawal S. Antisense Res Dev. 1993;3:277–284. doi: 10.1089/ard.1993.3.277. [DOI] [PubMed] [Google Scholar]
- 10.Mani S, Rudin CM, Kunkel K, Holmlund JT, Geary RS, Kindler HL, Dorr FA, Ratain MJ. Clin Cancer Res. 2002;8:1042–1048. [PubMed] [Google Scholar]
- 11.Cripps MC, Figueredo AT, Oza AM, Taylor MJ, Fields AL, Holmlund JT, McIntosh LW, Geary RS, Eisenhauer EA. Clin Cancer Res. 2002;8:2188–2192. [PubMed] [Google Scholar]
- 12.Matsukura M, Shinozuka K, Zon G, Mitsuya H, Reitz M, Cohen JC, Broder S. Proc Natl Acad Sci USA. 1987;84:7706–7710. doi: 10.1073/pnas.84.21.7706. [DOI] [PMC free article] [PubMed] [Google Scholar]
- 13.Schultz DG, Gryaznov SM. Nucleic Acids Res. 1996;24:2966–2973. doi: 10.1093/nar/24.15.2966. [DOI] [PMC free article] [PubMed] [Google Scholar]
- 14.Nielsen PE, Haaima G. Chem Soc Rev. 1997;26:73–78. doi: 10.1039/cs9972600073. [DOI] [Google Scholar]
- 15.Koshkin AA, Singh SK, Nielsen P, Rajwanshi VK, Kumar R, Meldgaard M, Olsen CE, Wengel J. Tetrahedron. 1998;54:3607–3630. doi: 10.1016/S0040-4020(98)00094-5. [DOI] [Google Scholar]
- 16.Rajwanshi VK, Hakansson AE, Dahl BM, Wengel J (1999) Chem Commun 1395–1396
- 17.van Aerschot A, Verheggen I, Hendrix C, Herdewijn P. Angew Chem Int Ed Engl. 1995;34:1338–1339. doi: 10.1002/anie.199513381. [DOI] [Google Scholar]
- 18.Allart B, Khan K, Rosemeyer H, Schepers G, Hendrix C, Rothenbacher K, Seela F, van Aerschot A, Herdewijn P. Chem Eur J. 1999;5:2424–2431. doi: 10.1002/(SICI)1521-3765(19990802)5:8<2424::AID-CHEM2424>3.0.CO;2-W. [DOI] [Google Scholar]
- 19.Maurinsh Y, Rosemeyer H, Esnouf R, Medvedovici A, Wang J, Ceulemans G, Lescrinier E, Hendrix C, Busson R, Sandra P, Seela F, van Aerschot A, Herdewijn P. Chem A Eur J. 1999;5:2139–2150. doi: 10.1002/(SICI)1521-3765(19990702)5:7<2139::AID-CHEM2139>3.0.CO;2-K. [DOI] [Google Scholar]
- 20.Wang J, Verbeure B, Luyten I, Lescrinier E, Froeyen M, Hendrix C, Rosemeyer H, Seela F, van Aerschot A, Herdewijn P. J Am Chem Soc. 2000;122:8595–8602. doi: 10.1021/ja000018+. [DOI] [Google Scholar]
- 21.Nielsen CB, Petersen M, Pedersen EB, Hansen PE, Christensen UB. Bioconjugate Chem. 2004;15:260–269. doi: 10.1021/bc0341932. [DOI] [PubMed] [Google Scholar]
- 22.Yang ZJ, Zhang HY, Min JM, Ma LT, Zhang LH. Pure Appl Chem. 1999;71:1143–1146. doi: 10.1351/pac199971061143. [DOI] [Google Scholar]
- 23.Yang ZJ, Zhang HY, Min JM, Ma LT, Zhang LH. Helv Chim Acta. 1999;82:2037–2043. doi: 10.1002/(SICI)1522-2675(19991110)82:11<2037::AID-HLCA2037>3.0.CO;2-I. [DOI] [Google Scholar]
- 24.Lei Z, Zhang L, Zhang LR, Chen J, Min JM, Zhang LH. Nucleic Acids Res. 2001;29:1470–1475. doi: 10.1093/nar/29.7.1470. [DOI] [PMC free article] [PubMed] [Google Scholar]
- 25.Chen J, Zhang LR, Min JM, Zhang LH. Nucleic Acids Res. 2002;30:3005–3014. doi: 10.1093/nar/gkf395. [DOI] [PMC free article] [PubMed] [Google Scholar]
- 26.Shi JF, Wang ZL, Zhang LR, Zhang LH. J Chin Pharm Sci. 2004;13:4–9. [Google Scholar]
- 27.Arnott S, Hukins DW. Biochem Biophys Res Commun. 1972;47:1504–1509. doi: 10.1016/0006-291X(72)90243-4. [DOI] [PubMed] [Google Scholar]
- 28.Bayly CI, Cieplak P, Cornell WD, Kollman PA. J Phys Chem. 1993;97:10269–10280. doi: 10.1021/j100142a004. [DOI] [Google Scholar]
- 29.Insight II (1998) Biosym Molecular Simulations Inc, Accelrys, San Diego, USA
- 30.Cheatham TE, Miller JL, Fox T, Darden TA, Kollman PA. J Am Chem Soc. 1995;117:4193–4194. doi: 10.1021/ja00119a045. [DOI] [Google Scholar]
- 31.Cheatham TE, Kollman PE. J Mol Biol. 1996;259:434–444. doi: 10.1006/jmbi.1996.0330. [DOI] [PubMed] [Google Scholar]
- 32.Darden TA, York D, Pedersen LG. J Chem Phys. 1993;98:10089–10092. doi: 10.1063/1.464397. [DOI] [Google Scholar]
- 33.Essmann U, Perera L, Berkowitz ML, Darden T, Lee H, Pedersen G. J Chem Phys. 1995;103:8577–8593. doi: 10.1063/1.470117. [DOI] [Google Scholar]
- 34.Ryckaert J, Ciccotti G, Berendsen HJC. J Comput Phys. 1977;23:327–341. doi: 10.1016/0021-9991(77)90098-5. [DOI] [Google Scholar]
- 35.Lavery R, Sklenar J. J Biomol Struct Dyn. 1988;6:63–91. doi: 10.1080/07391102.1988.10506483. [DOI] [PubMed] [Google Scholar]
- 36.Srinivasan J, Cheatham TE, III, Cieplak P, Kollman PA, Case DA. J Am Chem Soc. 1998;120:9401–9409. doi: 10.1021/ja981844+. [DOI] [Google Scholar]
- 37.Kollman PA, Massova I, Reyes C, Kuhn B, Huo S, Chong L, Lee M, Lee T, Duan Y, Wang W, Donini O, Cieplak P, Srinivasan J, Case DA, Cheatham TE., III Acc Chem Res. 2000;33:889–897. doi: 10.1021/ar000033j. [DOI] [PubMed] [Google Scholar]
- 38.Jayaram B, Sprous D, Young MA, Beveridge DL. J Am Chem Soc. 1998;120:10629–10633. doi: 10.1021/ja981307p. [DOI] [Google Scholar]
- 39.Srinivasan J, Miller JL, Kollman PA, Case DA. J Biomol Struct Dyn. 1998;16:265–280. doi: 10.1080/07391102.1998.10508245. [DOI] [PubMed] [Google Scholar]
- 40.Sharp KA, Honig B. Annu Rev Biophys Biophys Chem. 1990;19:301–332. doi: 10.1146/annurev.bb.19.060190.001505. [DOI] [PubMed] [Google Scholar]
- 41.Sitkoff D, Sharp KA, Honig B. J Phys Chem. 1994;98:1978–1988. doi: 10.1021/j100058a043. [DOI] [Google Scholar]
- 42.Gilson MK, Sharp KA, Honig B. J Comput Chem. 1987;9:327–335. doi: 10.1002/jcc.540090407. [DOI] [Google Scholar]
- 43.Sanner MF, Olson AJ, Spehner J-C. Biopolymers. 1996;38:305–320. doi: 10.1002/(SICI)1097-0282(199603)38:3<305::AID-BIP4>3.0.CO;2-Y. [DOI] [PubMed] [Google Scholar]
- 44.McQuarrie DA. Statistical mechanics. New York: Harper and Row; 1976. [Google Scholar]
- 45.Dickerson RE. J Biomol Struct Dyn. 1989;6:627–634. doi: 10.1080/07391102.1989.10507726. [DOI] [PubMed] [Google Scholar]
- 46.Sarma RH. Biomol Struct Dyn. 1988;3:391–395. doi: 10.1080/07391102.1988.10506496. [DOI] [PubMed] [Google Scholar]