

Abstract
New viral disease such as SARS and H1N1 highlighted the vulnerability of healthcare workers to aerosol-transmitted viral infections. This paper was to assess the protection performance of different level personal respiratory protection equipments against viral aerosol. Surgical masks, N95 masks and N99 masks were purchased from the market. The masks were sealed onto the manikin in the aerosol testing chamber. Viral aerosol was generated and then sampled simultaneously before and after the tested mask using biosamplers. This allows a percentage efficiency value to be calculated against test phage SM702 aerosols which surrogates of viral pathogens aerosol. At the same time, the masks face fit factor was determined by TSI8020. The viral aerosol particles aerodynamic diameter was 0.744 μm, and GSD was 1.29. The protection performance of the material of all the tested masks against viral aerosol was all >95 %. All the five surgical masks face fit factor were <8. F model N95 mask and H model N99 mask face fit factor were all >160. G model N95 mask face fit factor was 8.2. The protection performances of N95 or N99 masks were many times higher than surgical mask when considering the face fit factor. Surgical masks cannot offer sufficient protection against the inhalation of viral aerosol because they cannot provide a close face seal.
Keywords: Viral aerosol, Protection efficiency, Personal respiratory protection equipments
Introduction
Severe acute respiratory syndrome (SARS), H5N1 avian influenza and novel H1N1 influenza A are classified as infectious respiratory diseases. SARS posed a mammoth challenge because of the impact of nosocomial transmission on healthcare manpower and facilities, and the resources needed for controlling and preventing further spread (Tai 2006). With concerns about a possible approaching influenza pandemic, the control of transmission via infectious air has become more important. Public health services as well as clinicians and practitioners will be confronted with a new paradigm of infectious disease control. There were many types of masks available, and the different types offered very different levels of protection performance. Surgical masks are primarily designed to protect the patient and surgical area from contamination and not the wearers from the infectious aerosol, and they are open on the sides, top and bottom. N95 or N99 masks cover the nose and mouth and are specifically designed to protect the wearer from exposure to airborne infectious diseases by sealing tightly to the face and filtering infectious particles from the air. Studies showed that surgical mask and N95 mask have no statistically significant in risk of SARS infection (Seto et al. 2003; Loeb et al. 2004). Gamage pointed out the shortcomings of above studies (Gamage et al. 2005). While MacIntyre’s study showed that N95 had the protection efficiency and surgical mask had no efficiency to control influenza transmission in healthcare workers (HCWs) (Liverman et al. 2009). Some studies showed that even N95 or N99 mask had no adequate protection efficiency against viral aerosol in experimental environment (Balazy et al. 2006; Eninger et al. 2008; Lee et al. 2008).
Health care workers have long relied heavily on surgical masks to provide protection against influenza and other infections (Shine et al. 2009). Until now clinical effectiveness data of surgical mask and N95 mask are thus quite limited and conflicting. Faced with the emergence of a virulent respiratory disease like SARS, tuberculosis, avian or pig flu, etc. how to choose and use respiratory protection mask can be key decisions, among other things (Lavoie et al. 2007). Given the likelihood that N95 or N99 mask will be in short supply during a pandemic and unavailable in many countries, understanding the relative effectiveness of surgical masks and N95 or N99 masks is important. In this study, the surgical masks, N95 and N99 masks were purchase from the market. The masks protection performance against viral aerosol and face fit factor was determined in order to evaluate the protection efficiency of different level protection mask.
Materials and methods
Masks
Five models surgical masks [A : Eupon corporation, SiChuan, China; B: TongZhou LiKang, BeiJing, China, C: HeNan PiaoAn Group Co., Ltd., China; D: A. R. Medicom Inc. (ShangHai) Co., Ltd., China; E: HaoZheng Wei Cai, Guang Zhou, China;], two models N95 masks (F: Firmshield Biotechnology, China; G: HeNan PiaoAn Group Co., Ltd., China) and one model N99 mask (H: Firmshield Biotechnology, China) were purchased from the market. All of the masks were disposable personal protection equipments (PPE) and approved to manufacture by state food and drug administration. Surgical masks were used in ordinarily work by HCWs, and N95 or N99 masks were used the face fit technology to protect the wearer against the infectious aerosol.
Test organism
Bacteriophage SM702 was isolated by ourselves. It is dsDNA virus and about 100 nm size. SM702 had good aerosol stability in our previous study (Yu et al. 2010).
Preparation of test suspension
Phage SM702 was preparation as before (Yu et al. 2010). A fresh preparation was made for each series of tests. There have total of eight series of tests.
The test rig
The test method was modificated from our previous study (Wen et al. 2010) and Balazy study (Balazy et al. 2006). It was shown diagrammatically in Fig. 1. The challenge viral aerosol was generated using a 6-jet Collison nebulizer (BGI Inc., Waltham, MA, USA) at flow rate 10 L/min, which was supplied by a clean compressed air system. Generated aerosol was diluted by clean compressed air in a testing aerosol chamber. The dryer was not used in order to mimic the actual conditions because most airborne 20–300 nm sized viruses were the part of droplet nuclei or attached to other particles, namely the carrying-virus particles or droplets (Chen et al. 2009). The viral aerosol particle size distribution outside the tested mask in the test chamber was determined using TSI 3321 Aerodynamic Particle Sizer (APS, TSI Inc., MN, USA). The APS detects particles size distribution using a sophisticated time-of-flight technique that measures aerodynamic diameter in real time. The viral aerosol particles aerodynamic diameter was 0.744 μm, and geometric standard deviation (GSD) was 1.29. The tested masks were sealed by silicon sealant to the face of a manikin, which was placed at the height of 80 cm inside the chamber. A bubble-producing liquid was used to assure that there were no leaks between the tested masks and the manikin’s surface. The sealant surface was covered by this liquid, and the compressed air flowing through the mask caused bubbles formation in case of a leak. The places at which the leakages were detected were additionally sealed and checked for leaks again. The test chamber was located inside a −20 Pa negative lab. The viral aerosol protection efficiency experiments were carried out at constant flow rates 28.3 L/min using six-stage Andersen samplers which were used to sample the air at two positions. One was at the control position to obtain a control sample, and the other was in the test position to obtain a test sample so as to determine the viral aerosol concentration before filtration and after the mask filtration, respectively. When testing the mask, the flow was 28.3 L/min (which simulates inhalation at light workload) and sample time was 1 min for control and 2 min for test. Three sample masks of each model mask were selected mask to test the protection efficiency against viral aerosol. The collecting agars were cultured, and the plaque numbers counted. The filtration efficiency was determined by the aerosol concentration before and after the tested sample. Filtered air can be drawn through the aerosol chamber by an air pump through a HEPA filter.
Fig. 1.

Rig for testing filtration efficiency of respiratory protection equipments against viral aerosol
Culture the collecting samples
Collecting samples of phage SM702 were covered by up layer of 0.5 mL host bacteria S. marcescens 8039 and 10 mL semi-solid culture (0.7 % agar) and incubated at 37 °C for 12–16 h then counted the plaque on the plate. The number of PFU (plaque forming unit) of each plate was revised as reference (Andersen 1958).
Calculation of performance efficiency
By taking pre- and post-mask viral aerosol samples with sampling device, this method allows simultaneous measurement of viral aerosol concentration before and after filtration. The percentage efficiency of the test mask was calculated using the following formula, where A was the concentration of viral aerosol challenging the mask and B was the concentration of viral aerosol after filtration. Phage SM702 aerosol was determined in terms of pfu/m3. 
Face fit factor
Face fit factor was done by TSI8020 and N95 components as previous study (Wen et al. 2010). The mask can be fit tested by inserting a test probe through the filter material. TSI model 8025-N95 probe kit includes disposable probes and insertion tools. In our test, fit factor pass level was set 150. Eight testing actions included normal breathing, deep breathing, head side to side, head up and down, talk out aloud, grimace, bend and touch toes, normal breathing. Face fit factor ranged 1–200, and when the fit factor more than 200, the result was 200+. Overall fit factor is automatically calculated by Fitplus software. The following equation is used to calculate the overall fit factor (FF): Overall  , where FFx=fit factor for test cycle, n=number of test cycles (exercises). Each exercise includes an ambient sample, a mask sample and then another ambient sample. Measures respirator fit by comparing the concentration of microscopic particles outside the respirator to the concentration of particles that have leaked into the respirator. Face fit factor is defined as the particle concentration outside the mask divided by the particle concentration inside the mask. Face fit factor of 150 means that the air inside the mask is 150 times as clean as the air outside the mask. Two men and two women were selected to test the face fit factor.
Results
Aerosol particles size
Phage SM702 viral aerosol particles size distribution was showed in Fig. 2. The viral aerosol particles aerodynamic diameter was 0.744 μm, and geometric standard deviation (GSD) was 1.29.
Fig. 2.
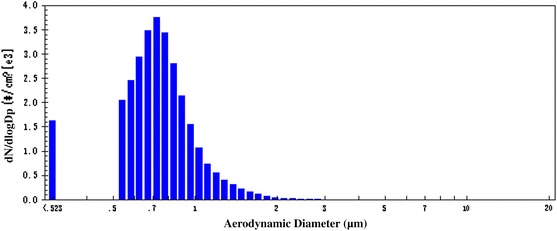
Phage SM702 viral aerosol particles size distribution
Filtration efficiency of viral aerosol by different level masks
Three new masks samples of each model masks were selected to test filtration efficiency against viral aerosol. The result of five models surgical masks filtration efficiency against viral aerosol showed in Table 1, and the results of N95 or N99 masks showed in Table 2. Six-stage Andersen sampler was used to collect the air after filtration of the mask, and the flow rate was 28.3 L/min. The sampling time was set 2 min because the prolonged nature of the tests may have caused excessive drying of agar and loss of viral viability, so the testing limit was 18 pfu/m3. If there were no phage SM702 plaques on the collected agar of the tested samples, the result was <18 pfu/m3. All of the tested masks filtration efficiency of phage f2 aerosol were >95 %. If do not consider the face fit factor, both the surgical mask and N95 or N99 mask had good protection efficiency against viral aerosol in our study.
Table 1.
Filtration efficiency of surgical mask against phage f2 aerosol
| Different model surgical masks | Sample number | Aerosol concentration before filtrating (PFU/m3) | Aerosol concentration after filtrating (PFU/m3) | Filtration efficiency(%) | Average filtration efficiency(%) |
|---|---|---|---|---|---|
| A | 1# | 23344 | 18 | 99.92 | 99.81 ± 0.19 |
| 2# | 23639 | <18 | >99.93 | ||
| 3# | 21661 | 88 | 99.59 | ||
| B | 1# | 35476 | 106 | 99.70 | 99.74 ± 0.04 |
| 2# | 35618 | 88 | 99.75 | ||
| 3# | 33003 | 71 | 99.78 | ||
| C | 1# | 19152 | 530 | 97.23 | 98.28 ± 0.96 |
| 2# | 27631 | 424 | 98.47 | ||
| 3# | 26360 | 230 | 99.13 | ||
| D | 1# | 32077 | 18 | 99.94 | 99.73 ± 0.25 |
| 2# | 45370 | 247 | 99.46 | ||
| 3# | 26603 | 54 | 99.80 | ||
| E | 1# | 35441 | <18 | >99.95 | 99.93 ± 0.03 |
| 2# | 17243 | 18 | 99.90 | ||
| 3# | 27559 | <18 | >99.93 |
Phage SM702 suspension was 106 PFU/mL, and the nebulizer flow rate was 10 L/min
Table 2.
Filtration efficiency of N95 or N99 mask against phage f2 aerosol
| Surgical mask | Sample number | Aerosol concentration before filtrating (PFU/m3) | Aerosol concentration after filtrating (PFU/m3) | Filtration efficiency(%) | Average filtration efficiency(%) |
|---|---|---|---|---|---|
| F (N95) | 1# | 29964 | 141 | 99.53 | 99.75 ± 0.21 |
| 2# | 37667 | 88 | 99.77 | ||
| 3# | 29611 | 18 | 99.94 | ||
| G (N95) | 1# | 19505 | 530 | 97.28 | 97.98 ± 1.40 |
| 2# | 30105 | 124 | 99.59 | ||
| 3# | 35052 | 1025 | 97.08 | ||
| H (N99) | 1# | 28519 | <18 | >99.94 | 99.88 ± 0.10 |
| 2# | 27035 | 35 | 99.87 | ||
| 3# | 28873 | <18 | >99.94 |
Phage SM702 suspension was 106 PFU/mL, and the nebulizer flow rate was 10 L/min
Face fit factor
Two female and two male researchers performed the face fit factor test. Face fit factor of the tested surgical masks were showed in Table 3, and N95 or N99 masks were showed in Table 4. The overall face fit factor pass level was set 150. The highest overall protection factor of the tested surgical masks was 6.9, and the lowest was 2.5. F model N95 mask overall protection factor was 194.5, and E model N95 was 8.2. H model N99 mask overall fit factor was 180.3. The measurement provided by the equipment is an assessment of mask protection factor during a fit test only. Mask fit at other times will vary. The protection factor value is not intended for use in calculating an individual’s actual exposure to hazardous substances.
Table 3.
Face fit factor of the surgical masks
| Mask number | Person number | Gender | Age | Overall fit factor | Average fit factor |
|---|---|---|---|---|---|
| A | 1 | Male | 33 | 4.2 | 6.9 ± 3.0 |
| 2 | Male | 30 | 7.1 | ||
| 3 | Female | 30 | 11 | ||
| 4 | Female | 29 | 5.1 | ||
| B | 1 | Male | 33 | 4.7 | 6.4 ± 2.7 |
| 2 | Male | 30 | 10 | ||
| 3 | Female | 30 | 6.9 | ||
| 4 | Female | 29 | 3.9 | ||
| C | 1 | Male | 33 | 3.7 | 3.7 ± 0.5 |
| 2 | Male | 30 | 4.2 | ||
| 3 | Female | 30 | 3.9 | ||
| 4 | Female | 29 | 3.0 | ||
| D | 1 | Male | 33 | 9.7 | 6.2 ± 3.9 |
| 2 | Male | 30 | 9.5 | ||
| 3 | Female | 30 | 2.3 | ||
| 4 | Female | 29 | 3.3 | ||
| E | 1 | Male | 33 | 2.7 | 2.5 ± 0.2 |
| 2 | Male | 30 | 2.4 | ||
| 3 | Female | 30 | 2.3 | ||
| 4 | Female | 29 | 2.4 |
Face fit factor of the test equipment ranged 1–200, and when the fit factor more than 200, the result was 200+. Overall fit factor pass level was set 150
Table 4.
Face fit factor of the N95 or N99 masks
| Mask number | Person number | Gender | Age | Overall fit factor | Average fit factor |
|---|---|---|---|---|---|
| F (N95) | 1 | Male | 33 | 178 | 194.5 ± 11 |
| 2 | Male | 30 | >200 | ||
| 3 | Female | 30 | >200 | ||
| 4 | Female | 29 | >200 | ||
| G (N95) | 1 | Male | 33 | 2.7 | 8.2 ± 6.4 |
| 2 | Male | 30 | 16 | ||
| 3 | Female | 30 | 11 | ||
| 4 | Female | 29 | 3.2 | ||
| H (N99) | 1 | Male | 33 | 194 | 180.3 ± 35.6 |
| 2 | Male | 30 | >200 | ||
| 3 | Female | 30 | >200 | ||
| 4 | Female | 29 | 127 |
Face fit factor of the test equipment ranged 1–200, and when the fit factor more than 200, the result was 200+. Overall fit factor pass level was set 150
Discussion
Two different models of N95 mask, one model of N99 mask and five different models of surgical masks were evaluated in this study. The concentration of the viral aerosol was measured outside and inside of each tested masks by the biosamplers. Based on the results obtained from the biosamplers, the masks protection efficiency against viral aerosol was determined. The surgical masks and N95 or N99 mask used in this study were sealed to the face of the manikin, so their efficiency determined during viral aerosol protection experiments is defined as the efficiency of the filter material. The actual field-measured efficiency may be lower if there are some leakages between the wearer’s face and the material of the surgical mask or N95 or N99 mask. So the face fit factors of the tested masks were evaluated in this study. The aerosolization of pathogenic virus requires a very high level of containment to prevent uncontrolled release. Due to aerosol safety issues involved with the generation of high viral aerosol concentrations, non-pathogenic virus was used. In this study, a viral model (bacteriophage SM702) was used to test protection performance of the mask filtration efficiency against viral aerosol. The phage SM702 viral aerosol particles aerodynamic diameter was 0.744 μm. Because the dryer was not used, the water content of the particles aerosolized by the Collison nebulizer could not fully evaporate, thus increasing the number of larger particles that carry single viruses or viral agglomerates. Similarly, in the field, most airborne 20–300 nm sized viruses were the part of droplet nuclei or attached to other particles, namely the carrying-virus particles or droplets (Chen et al. 2009). Fabian et al. collected exhaled breath samples from influenza patients and found positive PCR assays in 33 % of patients. The samples were collected according to particle size, and >87 % of particles were <1 μm (Fabian et al. 2008). The efficiency of the filter material of tested masks against SM702 viral aerosol was all >95 %. Balazy et al.’s study showed that N95 masks penetration levels of the MS2 virions was exceed 5 % and 2 surgical masks were 20.5 and 84.5 %, respectively, at an inhalation flow rate of 85 L/min (Balazy et al. 2006). Different particles size, testing flow rate and mask products may be lead the different results.
Though the efficiency of the filter material of tested masks against viral aerosol was all >95 %, the protection factors determined by TSI8020 and N95 components were different greatly. The protection factor of N95 mask or N99 mask except G model was nearly 30 times greater than the surgical mask, and no surgical mask protection factor was above 8. Face fit testing reduces the risk of exposure to infectious agents by the airborne route (Huff et al. 1994; Hannum et al. 1996). The fit factor obtained through fit testing may not adequately predict the true respiratory protection when the worker is performing actual work activities. As true workplace protection factors are often difficult to measure, simulated workplace protection factors are used as an alternative to estimate the respiratory protection level. In our study, simulated workplace protection factors were conducted using a TSI PortaCount Plus Model 8020. The assigned protection factor is 100 for N95 or N99 masks (AQSIQ 2010); in our study, 150 was set as pass level. The laboratory-generated protection factor results are expected to be greater than the field protection factor results due to lower workload and narrower range of head movements performed in the test. Lee et al. (2008) found that N95 masks had protection factors that were 8–12 times greater than those of surgical masks. Oberg and Brosseau study showed the majority of the nine types of surgical masks failed the qualitative fit tests and all failed the quantitative fit tests (Oberg and Brosseau 2008). The majority of particle penetration of N95 masks and N99 masks comes from facepiece leakage (Liverman et al. 2009; Grinshpun et al. 2009).
There even have debate in clinical protection efficiency of surgical mask and N95 mask against aerosol infection. Seto et al. found that not consistently wearing either a surgical mask or an N95 mask was associated with developing SARS when compared with their consistent use (Seto et al. 2003). Only mask usage was significant in the multivariate analysis; however, there was no difference in risk of infection whether HCWs were using surgical masks or N95 mask. Loeb et al. did a retrospective cohort study of 43 nurses in 2 critical care units with SARS patients and find a trend toward increased protection from N95 masks compared with surgical masks, but this was not statistically significant (Loeb et al. 2004). Unfortunately, Gamage et al. pointed out that the small sample size of the cohort and other confounding factors made interpretation of the results difficult. The role of fit testing was not addressed, and the potential for accidental autoinoculation when removing gear was not examined (Gamage et al. 2005). A cluster randomized clinical trial was conducted to compare the clinical efficacy of surgical masks versus N95 mask with and without fit testing, versus control in influenza transmission in 1,936 healthcare workers in China. N95 masks were found to have statistically significant efficacy, while surgical masks showed no efficacy (Liverman et al. 2009). The efficiency of N95 or N99 mask depends on user compliance. It is feasible that the improved efficiency of an N95 respirator over a surgical mask may be easily lost if compliance is poor or inadequate training is provided. Radonovich et al. study showed that no more than 30 % of workers tolerated respiratory protective devices consistently throughout an 8-h workday, citing difficulties with speaking and communication, discomfort and other physical problems (Radonovich et al. 2009). Few data are available on the clinical effectiveness of surgical masks and N95 masks in preventing the transmission of respiratory disease viruses. There is a pressing need for research in respiratory protection, particularly for randomized, controlled trials on the effectiveness of different protection level masks. Faced with the emergence of a virulent disease like SARS, recommended the use of N95 mask, that must be properly fit and used in conjunction with other necessary protective equipment (eye protection, gloves, coveralls, etc.) and infection control procedures. Surgical masks do not offer sufficient protection against the inhalation of viral aerosol because they cannot provide a close face seal. In our study, the filter material of the surgical mask had good protection against viral aerosol, but they had lower face fit factor and cannot provide adequate protection efficiency against viral aerosol. If the surgical masks use the face seal technology and have good face fit factor, they can be used to protection against aerosol infection particularly where the availability of N95 respirators is limited. For the HCWs of healthcare settings in general, the surgical mask is enough, and it will be excellent if the surgical masks have used the face seal technology.
Acknowledgments
This work was supported by the National Importance Infectious Disease Program of China (No. 2012ZX10004402).
References
- Andersen AA. New sampler for the collection, sizing, and enumeration of viable particles. Journal of Bacteriology. 1958;76:471–484. doi: 10.1128/jb.76.5.471-484.1958. [DOI] [PMC free article] [PubMed] [Google Scholar]
- Balazy A, Toivola M, Adhikari A, Sivasubramani SK, Reponen T, Grinshpun SA. Do N95 respirators provide 95% protection level against airborne viruses, and how adequate are surgical masks? American Journal of Infection Control. 2006;34:51–57. doi: 10.1016/j.ajic.2005.08.018. [DOI] [PubMed] [Google Scholar]
- Chen SC, Chio CP, Jou LJ, Liao CM. Viral kinetics and exhaled droplet size affect indoor transmission dynamics of influenza infection. Indoor Air. 2009;19:401–413. doi: 10.1111/j.1600-0668.2009.00603.x. [DOI] [PubMed] [Google Scholar]
- Eninger RM, Honda T, Adhikari A, Heinonen-tanski H, Reponen T, Grinshpun SA. Filter performance of N99 and N95 facepiece respirators against viruses and ultrafine particles. The Annals of Occupational Hygiene. 2008;52:385–396. doi: 10.1093/annhyg/men019. [DOI] [PMC free article] [PubMed] [Google Scholar]
- Fabian P, McDevitt JJ, DeHaan WH, Fung ROP, Cowling BJ, Chan KH, et al. Influenza virus in human exhaled breath: An observational study. PLoS ONE. 2008;3(7):e2691. doi: 10.1371/journal.pone.0002691. [DOI] [PMC free article] [PubMed] [Google Scholar]
- Gamage B, Moore D, Copes R, Yassi A, Bryce E. Protecting health care workers from SARS and other respiratory pathogens: A review of the infection control literature. American Journal of Infection Control. 2005;33:114–121. doi: 10.1016/j.ajic.2004.12.002. [DOI] [PMC free article] [PubMed] [Google Scholar]
- General administration of quality supervision, inspection and quarantine (AQSIQ), P.R.C. Technical requirements for protective face mask for medical use. Beijing: Standards press of China; 2010. [Google Scholar]
- Grinshpun SA, Haruta H, Eninger RM, Reponen T, McKay RT, Lee SA. Performance of an N95 filtering facepiece particulate respirator and a surgical mask during human breathing: Two pathways for particle penetration. Journal of Occupational and Environmental Hygiene. 2009;6:593–603. doi: 10.1080/15459620903120086. [DOI] [PMC free article] [PubMed] [Google Scholar]
- Hannum D, Cycan K, Jones L, Stewart M, Morris S, Markowitz SM, et al. The effect of respirator training on the ability of health care workers to pass a qualitative fit test. Infection Control and Hospital Epidemiology. 1996;17:636–640. doi: 10.1086/647195. [DOI] [PubMed] [Google Scholar]
- Huff RD, Horwitz P, Klash SJ. Personnel protection during aerosol ventilation studies using radioactive technetium (Tc99 m) American Industrial Hygiene Association Journal. 1994;55:1144–1148. doi: 10.1080/15428119491018213. [DOI] [PubMed] [Google Scholar]
- Lavoie, J., Cloutier, Y., Lara, J. & Marchand, G. (2007) TECHNICAL GUIDE RG-501, Guide on respiratory protection against bioaerosols Recommendations on its selection and use. IRSST, www.irsst.qc.ca.
- Lee S, Grinshpun SA, Reponen T. Respiratory performance offered by N95 respirators and surgical masks: Human subject evaluation with NaCl aerosol representing bacterial and viral particle size range. The Annals of Occupational Hygiene. 2008;52:177–185. doi: 10.1093/annhyg/men005. [DOI] [PMC free article] [PubMed] [Google Scholar]
- Liverman, C. T., Harris, T. A., Rogers, M. E. B. & Shine, K. I. (2009) Respiratory protection for healthcare workers in the workplace against novel H1N1 influenza A: A letter report. IOM (Institute of Medicine). Washington, DC: The National Academies Press. http://www.nap.edu/catalog/12748.html. [PubMed]
- Loeb M, McGeer A, Henry B, Ofner M, Rose D, Hlywka T, et al. SARS among critical care nurses, Toronto. Emerging Infectious Diseases. 2004;10:251–255. doi: 10.3201/eid1002.030838. [DOI] [PMC free article] [PubMed] [Google Scholar]
- Oberg T, Brosseau LM. Surgical mask filter and fit performance. American Journal of Infection Control. 2008;36:276–282. doi: 10.1016/j.ajic.2007.07.008. [DOI] [PMC free article] [PubMed] [Google Scholar]
- Radonovich LJ, Cheng JJ, Shenal BV, Hodgson M, Bender BS. Respirator tolerance in health care workers. Journal of the American Medical Association. 2009;301:36–38. doi: 10.1001/jama.2008.894. [DOI] [PubMed] [Google Scholar]
- Seto WH, Tsang D, Yung RWH, Ching TY, Ng TK, Ho M, et al. Effectiveness of precautions against droplets and contact in prevention of nosocomial transmission of severe acute respiratory syndrome (SARS) Lancet. 2003;361:1519–1520. doi: 10.1016/S0140-6736(03)13168-6. [DOI] [PMC free article] [PubMed] [Google Scholar]
- Shine KI, Rogers B, Goldfrank LR. Novel H1N1 influenza and respiratory protection for health care workers. The New England Journal of Medicine. 2009;361:1823–1825. doi: 10.1056/NEJMp0908437. [DOI] [PubMed] [Google Scholar]
- Tai DY. SARS: How to manage future outbreaks? Annals of the Academy of Medicine, Singapore. 2006;35:368–373. [PubMed] [Google Scholar]
- Wen Z, Lu J, Li J, Li N, Zhao J, Wang J, et al. Determining the filtration efficiency of half-face medical protection mask (N99) against viral aerosol. Aerobiologia. 2010;26:245–251. doi: 10.1007/s10453-010-9160-4. [DOI] [PMC free article] [PubMed] [Google Scholar]
- Yu L, Wen Z, Li J, Yang W, Wang J, Li N, et al. Effects of different sampling solutions on the survival of bacteriophages in bubbling aeration. Aerobiologia. 2010;26:75–82. doi: 10.1007/s10453-009-9144-4. [DOI] [PMC free article] [PubMed] [Google Scholar]