Fig. 1.

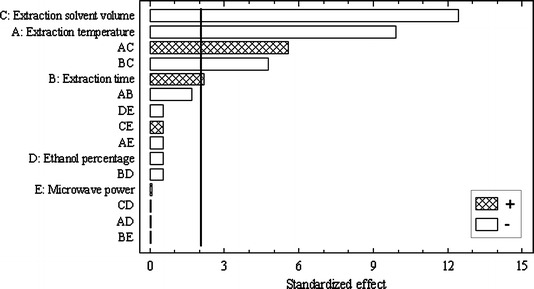
Pareto chart for the standardized effects in the full factorial design. Vertical lines indicate both statistically significant effects and cross effects (95% confidence level)

Pareto chart for the standardized effects in the full factorial design. Vertical lines indicate both statistically significant effects and cross effects (95% confidence level)