

Abstract
The present study focuses on the effects of three different sampling solutions, namely distilled water, phosphatic buffer solution, and suspension medium (SM), adding antifoam or not, on the survival probability of several different bacteriophages (EcP1,PhiX174,SM702, and F2) as surrogates for the mammalian viruses in the bubbling process. AGI-10 impinger was used as the representative for all the impingers which would bubble during operation. It was found that the survival probability of the same bacteriophage bubbling with different sampling solutions was different except that there was no significant difference observed for the bacteriophage F2. The use of SM as the collection fluid was relative to a high survival probability for the four bacteriophages. And the endurance or resistance of different kinds of bacteriophages in the same sampling solution was different. We conclude that SM is a promising sampling solution for liquid impingers in the process of sampling phages.
Keywords: Bacteriophage, Impinger, Sampling solutions, Bubbling aeration, Survival percentage correction, Viral surrogate
Introduction
Viruses are submicroscopic infectious agents that are pathogenic to humans and animals. Respiratory viruses such as influenza virus, smallpox virus, measles virus, mumps virus, rhinovirus, and coronavirus are capable of transmission through the bioaerosol droplets, which can quickly dry in air to submicrometer and even ultrafine sizes and remain airborne for prolonged periods (Morawska 2006). In order to simulate the viruses for bioaerosol study, bacteriophages have been typically used as surrogates for pathogenic viruses (Dubovi and Akers 1970; Harstad 1965; Hatch and Warren 1969).
Bacteriophages are viruses that infect bacteria, which are similar in size, shape, and structure with animal or human cell viruses (Ackermann 2005; Bamford et al. 2002; Benson et al. 2004; Lwoff and Tournier 1966), while they are not able to infect human or animals and cause infectious diseases (Chanishvili et al. 2001; Sayamov 1963). Thus, bacteriophages have been used as biological tracers and surrogate viruses in performance evaluation of bioaerosol samplers (Dahlgren et al. 1961; Harstad 1965; Tseng and Li 2005).
Various air samplers are available, but impingers are generally used to sample airborne viruses because (i) they are generally considered more effective than filters, bubblers, or impactors for collecting very small bioaerosol particles (Grinshpun et al. 1996; Harstad 1965) and ii) they can be used for serial dilutions and subsequent analysis of viable and non-viable organisms using various techniques to recover airborne viral particles in the liquid phase of the collection system (Alexandersen and Donaldson 2002; Donaldson et al. 1987). Since the impingers are widely used, the damage of microorganism caused by the violent motion in the liquid was also characterized. Willeke has proved that the bubbling in the impinger partially contributed to bacterial injury (Willeke et al. 1995). Agranovski et al. (2004) has investigated the inactivation rate of four viruses in the bubbling process by using distilled water and Hank’s solution with appropriate additives. It was concluded that the survival rates of the influenza, measles, and mumps viruses were increased compared to bubbling through the sterile water. Few researchers, however, focused on the collecting medium for bacteriophages and specialized in reflecting effect of bubbling aeration on the viability of bacteriophages quantitatively and statistically.
The purpose of this study was to select the optimum sampling solution among three different ones to decrease inactivation probability of bacteriophages during bubbling agitation, to rank the bacteriophages by endurance or resistance to bubbling stress and to determine the reaerosolized viable phage count quantitatively.
Materials and methods
Bacteriophages and hosts
Table 1 shows a list of the five viruses studied, as well as the hosts in which they were propagated and assayed and information about their biological properties. All the host strains were propagated in nutrient broth (OXOID) at 37°C except Serratia marcescens at 35°C with shaking at 180 rpm with a diameter of 12 mm. After overnight growth, the strains were streaked on nutrient agar petri dishes. When necessary, a new culture was grown from a single colony. The stock cultures were kept on nutrient agar petri dishes at 4°C. Host bacteria were infected with corresponding phages, and the completely lysed cultures were centrifuged at 4,000g for 15 min to remove bacterial debris. The supernatants were filtered through a 0.22-μm-pore size Millipore filter. The resulting phage stocks were stored at 4°C. Plaque-forming assay described by Adams was used to measure the bacteriophage concentrations (Adams 1959).
Table 1.
Subjects for the experiment and their characteristics
| Phage | Host | Morphological characteristics | Type of nucleic acid | Size of plaque (mm) |
|---|---|---|---|---|
| SM701a | S. marcescens 8039 | Isometric polyhedral head (about 64 nm in diameter) and a long non-contractile tail (about 143 nm long) | dsDNA | Around 1 |
| SM702b | S. marcescens 8039 | Similar to SM701 | dsDNA | 2–3 |
| PhiX174 | E. coli (ATCC13706) | Spherical structure (about 28 nm in diameter) | ssDNA | Around 3 |
| EcP1a | E. coli285 | Elongated head (length about 47 nm and width about 35 nm) with a short tail (about 20 nm in length) | dsDNA | 3–5 |
| F2a | E. coli285 | Spherical structure (30–100 nm) | ssRNA | 0.5–2 |
Impinger
The AGI-10 (KANGJIE Instrument Inc.) is an all-glass impinger with the nozzle positioned 10 mm above the bottom. Suction is applied to the small side arm and draws air in through an inlet tube curved to simulate particle collection in the nasal passage and down through the impinging jet. The diameter of the capillary is about 1.1 mm, which makes air flow velocity accelerated 123 m/s when the sampling flow is 7.0 l/min.
Data processing and statistical analysis
The survival of bacteriophages is reported as percentage correction, which was calculated by use of Eq. 1. Statistical computations and tests were performed by using the SAS statistical program (SAS Institute Inc 1999). For comparing two groups of subjects, proc sort, proc univariate normal, and proc ttest were invoked. For factorial anova, proc glm, proc class, proc model, and lsmeans were used. The treatment factors (solution and oil) appeared in the class statement. Main effects and interactions (solution*oil) were specified in the model statement. Multiple comparisons of interaction means were achieved by lsmeans statement. Differences were considered significant when P < 0.05, as determined by analysis of variance (ANOVA) and t-test.
 |
1 |
 |
2 |
where N
t is the plaque count at t which denotes bubbling time. N
C is the correction plaque count which is calculated by concentration equation ( ). N
0 is the initial plaque count when t equals 0. V
0 is the initial volume of sampling solution which is 10 ml here. V
t is the volume of sampling solution at t which denotes bubbling time. N
l is the plaque count lost from sampling solution due to reaerosolization. This is thought to be a consequence of particles being caused by bubbles in the liquid and reaerosolized when the bubbles burst at the surface. Although N
l is very limited compared to N
0 and it is omitted in the following calculation, it should not be neglected in design. And this supposition was proved by the experiment of determination of reaerosolized phages designed as later. Because of extensive evaporation of the collection fluid during operation, which reached 50% of the initial impinger volume per hour at a relative humidity of 30% (Terzieva et al. 1996), all plaque count results were corrected by a liquid evaporation factor, which was calculated by use of Eq. 2.
). N
0 is the initial plaque count when t equals 0. V
0 is the initial volume of sampling solution which is 10 ml here. V
t is the volume of sampling solution at t which denotes bubbling time. N
l is the plaque count lost from sampling solution due to reaerosolization. This is thought to be a consequence of particles being caused by bubbles in the liquid and reaerosolized when the bubbles burst at the surface. Although N
l is very limited compared to N
0 and it is omitted in the following calculation, it should not be neglected in design. And this supposition was proved by the experiment of determination of reaerosolized phages designed as later. Because of extensive evaporation of the collection fluid during operation, which reached 50% of the initial impinger volume per hour at a relative humidity of 30% (Terzieva et al. 1996), all plaque count results were corrected by a liquid evaporation factor, which was calculated by use of Eq. 2.
Evaluation of effect of antifoam on formation of bacteriophage plaque
Olive oil was added in sampling solution as antifoam to impede foam formation to reduce bacterial or virus stress during sampling. In order to investigate whether oil can affect the plaque formation of targeted bacteriophages, we designed the experiment as follows: 995 μl bacteriophage suspension (titration 104–105 PFU/ml) were pipetted into two sterilized tubes each, one added 5 μl olive oil, and the other added 5 μl dilution medium. Fully mixing solution, double-layer agar technique was used to numerate the plaque. The shape of plaque was observed. The average values and the standard deviations for the plaque counts were determined from the data of five replicates.
Bubbling aeration in different sampling solutions
Six identical AGI-10-1.1 impingers were placed inside a biological safety cabinet (TELSTAR Bio-II-A, Spain). Three of them contained 9.95 ml of distilled water, PBS, and SM liquid, respectively, besides 0.05 ml of olive oil added as anti-foam, totally 10.0 ml each, designated as the first group; the rest three impingers contained 10.0 ml of distilled water, PBS, and SM liquid, respectively, without olive oil designated as the second group. Then 1 μl bacteriophage suspension (titration 108–109 PFU/ml) was pipetted into each impinger and mixed fully. The impingers were operated at a flow rate of 7.0 l/min which was controlled by a flow meter. The bubbling process lasted for 30 min, and final volume of sampling solution was determined. Each group was repeated three times. At least three replicate measurements of the initial and final bacteriophage concentrations in the collection fluid were taken for each impinger. For all experiments, the air temperature was maintained between 20 and 23°C, and the relative humidity in cabinet was between 40 and 50%. The initial and final viable bacteriophage counts were determined by double-layer agar technique. Survival percentage correction was utilized for evaluation of bacteriophage resistance or endurance in bubbling aeration, which was calculated by use of Eq. 1.
Development of changing curves of survival percentage correction with bubbling time
SM liquid might be an optimum collection liquid for these four different bacteriophages. This conclusion has been made from the statistically analyzing results. Thus, curve of survival percentage correction with time of bubbling aeration in SM liquid was drawn to show the bacteriophage resistance or endurance differences intuitively. The experiment was carried out similar to the second group in earlier depiction except for only selecting SM liquid as sampling solution. The bubbling aeration lasted for 60 min, and one-microliter samples of the bacteriophage solution was collected at 20-min intervals using a pipettor. Three identical impingers were used at the same time, and three replicate measurements of bacteriophage counts were taken at every 20 min for each impinger. Volumes of sampling solution in the impinger at each 20 min were calculated averagely by final volume of sampling solution.
Determination of reaerosolized bacteriophage counts
To determine the reaerosolized bacteriophage counts caused by bursting of the bubbles at the liquid–air surface, we carried out an experiment with two series connected AGI-10 impingers. Ten milliliters of SM liquid was added to two identical AGI-10 impingers. One of them (impinger A) was pipetted into 1-μl bacteriophage suspension (titration 7.0 × 10⁸ PFU/ml), and the outlet was connected to the inlet tube of the other (impinger B) by a short plastic tube. Outlet of impinger B was connected to a flow control pump. This system was placed inside the biological safety cabinet except the pump. The bubbling process lasted for 30 min at a flow rate of 7.0 l/min. The number of viable agents which were reaerosolized from impinger A and escaped with the effluent air flow into the impinger B was determined by top soft agar using a large glass plate (diameter 20 cm), which was actually the N l mentioned previously in Eq. 1. This experiment was repeated three times, and three replicate measurements of bacteriophage counts in the solution of impinger B were taken.
Results
Effect of antifoam on plaque formation
The effect of olive oil on five different bacteriophages’ PFU counts is given in Table 2. The PFU counts for each kind of bacteriophages suffered from the different treatments did not differ significantly (t-test, P > 0.05). Besides, the morphologies and sizes of plaque of each kind of bacteriophages were not intuitively different between the two different treatment groups. Therefore, olive oil does not seem to influence phage PFU counts as well as the morphology and size of plaque in static state at the very short term.
Table 2.
Effect of olive oil on bacteriophage PFU counts
| Bacteriophage | Plaque-forming units (PFUs)a | ||
|---|---|---|---|
| Suspension | Suspension plus olive oil | t-test | |
| SM701 (n = 5) | 163 ± 12 | 161 ± 6 | 0.41 |
| SM702 (n = 5) | 182 ± 11 | 183 ± 10 | 0.09 |
| PhiX174 (n = 5) | 128 ± 9 | 125 ± 14 | 0.46 |
| EcP1 (n = 5) | 66 ± 9 | 69 ± 8 | 0.62 |
| F2 (n = 5) | 73 ± 5 | 70 ± 2 | 1.18 |
aMean of five values ± standard deviation
Bubbling aeration in different sampling solutions
Table 3 lists the state of sampling solution during bubbling process and the changing range of volume after 30 min bubbling aeration.
Table 3.
Observation of the sampling solution
| Volume of olive oil (μl) | Type of sampling solution | During bubbling aeration | Volume range after 30 min bubbling (ml) |
|---|---|---|---|
| 0 | DW | Impinged foam reached below midpart of the tube with blobs adhesion, which could reach the neck of the impinger | 7.3–8.0 |
| PBS | Impinged foam reached neck of the tube and slided down the wall quickly without blobs adhesion | 8.2–8.7 | |
| SM | Impinged foam extended below the neck of the impinger and foam slided down the wall quickly almost without blobs adhesion | 7.7–8.3 | |
| 50 | DW | Solution color became ivory. The level of impinged foam fell and with more blobs adhesion on the wall | 7.5–7.9 |
| PBS | Solution color became ivory. Impinged foam fell below the mid-part of tube with blobs adhesion on the wall | 8.5–8.6 | |
| SM | Solution color became weak ivory. Impinged foam fell below the midpart of tube with the least blobs adhesion on the wall | 7.7–8.2 |
Table 4 shows the survival percentage correction of bacteriophage EcP1, PhiX174, SM702, and F2 in different sampling solutions with or without olive oil as antifoam.
Table 4.
Survival percentage correction of different bacteriophages
| Phage | Sampling solution | Volume of olive oil (μl) | Survival percentage correction % (mean value ± standard deviation) |
|---|---|---|---|
| EcP1 | DW | 0 | 45.8 ± 17.9 |
| 50 | 47.6 ± 3.0 | ||
| PBS | 0 | 2.1 ± 1.4 | |
| 50 | 10.9 ± 7.8 | ||
| SM | 0 | 55.1 ± 25.7 | |
| 50 | 71.4 ± 12.7 | ||
| PhiX174 | DW | 0 | 46.5 ± 2.5 |
| 50 | 48.0 ± 6.1 | ||
| PBS | 0 | 54.5 ± 18.0 | |
| 50 | 62.0 ± 5.1 | ||
| SM | 0 | 83.4 ± 14.5 | |
| 50 | 84.8 ± 15.1 | ||
| SM702 | DW | 0 | 51.7 ± 10.9 |
| 50 | 15.0 ± 1.3 | ||
| PBS | 0 | 77.0 ± 11.4 | |
| 50 | 48.9 ± 11.9 | ||
| SM | 0 | 79.2 ± 2.8 | |
| 50 | 79.3 ± 6.8 | ||
| F2 | DW | 0 | 79.1 ± 12.8 |
| 50 | 70.2 ± 11.0 | ||
| PBS | 0 | 69.0 ± 14.1 | |
| 50 | 77.5 ± 9.9 | ||
| SM | 0 | 90.2 ± 5.2 | |
| 50 | 83.1 ± 2.9 |
Bacteriophage EcP1
The results indicated that there was a significant effect for sampling solution on the survival percentage correction of phage EcP1 (ANOVA, P < 0.01), but oil had no significant effect on it (ANOVA, P > 0.05). Further analysis showed the greatest survival percentage correction of phage EcP1 were, in DW and SM, with no significant difference between them (ANOVA, P > 0.05). These corrected survival percentages were significantly greater (ANOVA, P < 0.05) than those in PBS which were not significantly different (ANOVA, P > 0.05).
Bacteriophage PhiX174
Statistical analysis indicated that sampling solution had a significant effect on corrected survival percentage of phage PhiX174, while oil had no significant effect on it (ANOVA, P > 0.05). Phage PhiX174 showed the highest survival percentage correction in SM, with no significant difference between olive oil 0 μl and 50 μl (ANOVA, P > 0.05). The survival percentage correction in SM was significantly greater (ANOVA, P < 0.05) than those in DW or PBS with or without olive oil, which were not significantly different (ANOVA, P > 0.05).
Bacteriophage SM702
A significant main effect was obtained for solution (ANOVA, P < 0.01). Phage SM702 showed the highest survival percentage correction in SM, with no significant difference between olive oil 0 μl and 50 μl (ANOVA, P > 0.05). They were significantly greater (ANOVA, P < 0.05) than those in DW whose survival percentage correction was significantly different between olive oil 0 μl and 50 μl (ANOVA, P < 0.05). The survival percentage correction in PBS was significantly higher than that in DW for oil group (ANOVA, P < 0.01). A significant main effect was also obtained for olive oil (ANOVA, P < 0.01), indicating that 0 μl olive oil had significantly higher survival percentage than did 50 μl olive oil in the DW and PBS (ANOVA, P < 0.01), reflecting the main effect of olive oil. Zero microliter olive oil, however, did not have higher survival percentage than did 50 μl olive oil in the SM (ANOVA, P > 0.05). This prompted that adding olive oil into DW or PBS except for SM might reduce the survival percentage correction of bacteriophage SM702.
Bacteriophage F2
The statistical results indicated there were no significant differences between different groups (ANOVA, P > 0.05).
Dynamics of survival percentage correction
Figure 1 shows that the changes in survival percentage correction of five different bacteriophages with bubbling time in SM. It was obviously that the survival percentage correction of five different bacteriophages declined along with bubbling time. For example, Phix174 was the most resistant one in five different subjects; however, the survival percentage correction dropped from 100% at t = 0 min to 86.1% at t = 60 min. EcP1, which was the most susceptible to bubbling aeration, dropped most deeply to 49.8% after 60 min. SM701 and SM702 almost kept the same descending trend, but the survival percentage correction of SM701 was higher than SM702 during the whole process. The survival percentage correction of bacteriophage F2 went down slower than SM701 before 20 min but fell down deeper during the remaining 40 min. In conclusion, different bacteriophages might have different resistance or endurance to bubbling aeration. The number of viable bacteriophages could become lower with the bubbling time prolonged.
Fig. 1.
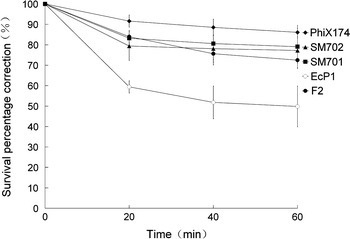
Dynamics of the survival percentage correction during bubbling aeration with AGI-10 impinger. Each point represents the mean percentage value, and the error bars represent the standard deviation
Numeration result of reaerosolized bacteriophage
The average plaque-forming units and the standard deviations per plate for bacteriophage solution in impinger B was 252 ± 16, which means the viable bacteriophages reaerosolized from impinger A escaped with the effluent air flow into the impinger B, and the counts could reach that value. It is obviously that this value compared to the initial viable agent counts in impinger A (7.0 × 10⁵ PFUs) was extremely trivial and almost could be ignored.
Discussion
Impingers such as the AGI-4, AGI-10, AGI-30, and other newly developed biosamplers were designed to draw aerosol by impingement into liquid, which could activize the violent bubbling of collection fluid. Research indicates that violent bubbling may beget inactivation of the viable agents and lose a considerable amount of the collection fluid (Willeke et al. 1995; Lin et al. 1997; Agranovski et al. 2004). Olive oil was added in sampling solution as antifoam to impede foam formation to reduce virus stress during bubbling. In order to investigate whether oil can affect the plaque formation of five targeted bacteriophages, we carried out the previously described experiments. The results indicated that olive oil did not seem to influence phage PFU counts as well as the morphology and size of plaque in static state in the very short term. This result was in correspondence with our previous observation that a very small amount of oil in suspension would not influence the non-enveloped and non-lipid-coated phages on formation of plaque. Phage SM701, SM702, and EcP1 belong to Caudovirales, and PhiX174 and F2 belong to Microviridae and Leviviridae, respectively. It has been known that phages of Caudovirales (including three families Myoviridae, Siphoviridae, and Podoviridae), Microviridae, and Leviviridae contain no lipids (Ackermann 1999). We consider this might well elucidate earlier results. For phage EcP1, PhiX174, and F2, results of 30-min bubbling aeration indicated whether olive oil was added or not, corrected survival percentage were not significantly different (ANOVA, P > 0.05), but the index was significantly higher in SM and DW than in PBS for EcP1 and higher in SM than in DW and PBS for PhiX174 (ANOVA, P < 0.05). There were no significant differences between sampling solutions, no matter whether or not adding olive oil as antifoam for phage F2 (ANOVA, P > 0.05). The most complex situation occurred in phage SM702, of which corrected survival percentage in SM was significantly higher than in PBS and DW, no matter whether or not adding oil. Adding olive oil into DW or PBS except for SM might reduce the survival percentage correction of bacteriophage SM702. Enveloped or lipid-coated phages were absent in present study, but we might made an inference that those kinds of phages might be influenced by olive oil. However, this inference needs to be proved further by experiments.
Agranovski investigated the inactivation rate of viruses in the bubbling process for a new personal bioaerosol sampler. Results indicated that the concentrations of influenza, mumps, and measles viruses decreased with bubbling time, but the vaccinia virus increased at the first hour then decreased with bubbling process in virus maintenance fluid (Agranovski et al. 2004). Theoretically, it is impossible for survivable viruses’ raise with bubbling. However, the concentration of survival agents might increase when the evaporation of sampling solution surpasses the decay of viruses. And in our previous study, the concentrations of robust or stress-endurable phage such as PhiX174 and SM702 could rise with time in SM before they were corrected, which made the survival line going up or appearing “V” type. Consequently, plaque counts should be corrected by a liquid evaporation percentage to actualize or illustrate a real situation for those impingers with fluid loss. Evaporation factor was cited in our study due to this consideration, and all results were corrected.
Different bacteriophages might have different resistance or endurance to bubbling aeration in the same sampling solution. And the number of viable bacteriophages could become lower with the bubbling time prolonged (as Fig. 1 illustrated). It is well known that phages consist of coat protein and nucleic acid which are enclosed by it. We suppose that the inactivation of phage was caused by the high-velocity air flow and bubbles, which helped the phages to reach a gas–liquid interface depriving of the property of infectivity (Adams 1948). Reaerosolized bacteriophage caused by bursting of the bubbles at the liquid–air surface was numerated in this study. The result indicated that the number was extremely trivial and could almost be ignored compared to the initial counts. This index, however, might be useful and helpful for evaluating the biocollecting efficiency of impingers indirectly.
Finally, it should also be noted that the research process used in this study considered that phages were exposed to the bubbling regime throughout the entire operation of the impinger. In reality, the phages could be collected gradually using the device throughout the whole sampling time, which would minimize exposure for the phages that arrived later and correspondingly should provide a higher survival percentage than the theoretical one (Agranovski et al. 2004).
In conclusion, (i) olive oil as antifoam may not influence the non-enveloped and non-lipid-coated phages on formation of plaque in static state in the very short term, but might have no effect or negative effect on different phages in different sampling solutions during bubbling agitation; (ii) SM as the collection fluid was relative to a high survival probability for the four bacteriophages; and (iii) Stress-resistant phages such as PhiX174, SM701, and SM702 were inactivated at slower rates. The use of them would add an extra margin of safety in predictive models of respiratory viruses’ behavior. Phage EcP1 might be better for evaluating the damage effect of impingers on alive agents, because it was sensitive to bubbling stress.
Acknowledgments
This work was supported by the Chinese National Programs for Science and Technology Development (NO.2004BA719A15) and Special Program for Prevention and Control of Infectious Diseases (NO. 2009ZX10004-501). Tong Yigang is thanked for his revising of this manuscript.
References
- Ackermann, H. W. (1999). Bacteriophages. In J. P. Lederberg (Ed.), Encylopedia of microbiology (2nd ed., Vol. 1, pp. 398–411). New York: Academic Press.
- Ackermann HW. Bacteriophage classification. In: Kutter E, Sulakvelidze A, editors. Bacteriophages: Biology and applications. Boca Raton: CRC Press; 2005. pp. 67–89. [Google Scholar]
- Adams MH. Surface inactivation of bacterial viruses and of proteins. Journal of General Physiology. 1948;31:417–431. doi: 10.1085/jgp.31.5.417. [DOI] [PMC free article] [PubMed] [Google Scholar]
- Adams MA. Bacteriophages. New York: Interscience Publishers, Inc; 1959. [Google Scholar]
- Agranovski IE, Safatov AS, Borodulin AI, Pyankov OV, Petrishchenko VA, Sergeev AN, Agafonov AP, Ignatiev GM, Sergeev AA, Agranovski V. Inactivation of viruses in bubbling processes utilized for personal bioaerosol monitoring. Applied and Environmental Microbiology. 2004;70:6963–6967. doi: 10.1128/AEM.70.12.6963-6967.2004. [DOI] [PMC free article] [PubMed] [Google Scholar]
- Alexandersen S, Donaldson AI. Further studies to quantify the dose of natural aerosols of foot-and-mouth disease virus for pigs. Epidemiology and Infection. 2002;128:313–323. doi: 10.1017/s0950268801006501. [DOI] [PMC free article] [PubMed] [Google Scholar]
- Bamford DH, Burnett RM, Stuart DI. Evolution of viral structure. Theoretical Population Biology. 2002;61:461–470. doi: 10.1006/tpbi.2002.1591. [DOI] [PubMed] [Google Scholar]
- Benson SD, Bamford JKH, Bamford DH, Burnett RM. Does common architecture reveal a viral lineage spanning all three domains of life? Molecular Cell. 2004;16:673–685. doi: 10.1016/j.molcel.2004.11.016. [DOI] [PubMed] [Google Scholar]
- Chanishvili N, Chanishvili T, Tediashvili M, Barrow PA. Phages and their application against drug resistant bacteria. Journal of Chemical Technology and Biotechnology. 2001;76:689–699. doi: 10.1002/jctb.438. [DOI] [Google Scholar]
- Dahlgren CM, Decker HM, Harstad JB. A slit sampler for collecting T-3 bacteriophage and Venezuelan equine encephalomyelitis virus. I. Studies with T-3 bacteriophage. Applied Microbiology. 1961;9:103–105. doi: 10.1128/am.9.2.103-105.1961. [DOI] [PMC free article] [PubMed] [Google Scholar]
- Donaldson AI, Gibson CF, Oliver R, Hamblin C, Kitching RP. Infection of cattle by airborne foot-and-mouth disease virus: Minimal doses with O1 and SAT 2 strains. Research in Veterinary Science. 1987;43:339–346. [PubMed] [Google Scholar]
- Dubovi EJ, Akers TG. Airborne stability of tailless bacterial viruses S-13 and MS-2. Applied Microbiology. 1970;19:624–628. doi: 10.1128/am.19.4.624-628.1970. [DOI] [PMC free article] [PubMed] [Google Scholar]
- Grinshpun SA, Willeke K, Ulevicius V, Donnelly J, Lin X, Mainelis G. Collection of airborne microorganisms: Advantages and disadvantages of different methods. Journal of Aerosol Science. 1996;27:247–248. doi: 10.1016/0021-8502(96)00196-6. [DOI] [Google Scholar]
- Harstad JB. Sampling submicron T1 bacteriophage aerosols. Applied Microbiology. 1965;13:899–908. doi: 10.1128/am.13.6.899-908.1965. [DOI] [PMC free article] [PubMed] [Google Scholar]
- Hatch MT, Warren JC. Enhanced recovery of airborne T3 coliphage and Pasteurella pestis bacteriophage by means of a presampling humidification technique. Applied Microbiology. 1969;17:685–689. doi: 10.1128/am.17.5.685-689.1969. [DOI] [PMC free article] [PubMed] [Google Scholar]
- Lin X, Willeke K, Ulevicius V, Grinshpun SA. Effect of sampling time on the collection efficiency of all-glass impingers. American Industrial Hygiene Association Journal. 1997;58:480–488. [Google Scholar]
- Lwoff A, Tournier P. The classification of viruses. Annual Review of Microbiology. 1966;20:45–74. doi: 10.1146/annurev.mi.20.100166.000401. [DOI] [PubMed] [Google Scholar]
- Morawska L. Droplet fate indoor environments, or can we prevent the spread of infection? Indoor Air. 2006;16:335–347. doi: 10.1111/j.1600-0668.2006.00432.x. [DOI] [PubMed] [Google Scholar]
- SAS Institute Inc . SAS/SAT user’s guide (version 8) Cary, NC: SAS Institute Inc; 1999. [Google Scholar]
- Sayamov RM. Treatment and prophylaxis of cholera with bacteriophage. Bulletin of the World Health Organization. 1963;28:361–367. [PMC free article] [PubMed] [Google Scholar]
- Terzieva S, Donnelly J, Ulevicius V, Grinshpun SA, Willeke K, Stelma GN, Brenner KP. Comparison of methods for detection and enumeration of airborne microorganisms collected by liquid impingement. Applied and Environmental Microbiology. 1996;62:2264–2272. doi: 10.1128/aem.62.7.2264-2272.1996. [DOI] [PMC free article] [PubMed] [Google Scholar]
- Tseng CC, Li CS. Collection efficicencies of aerosol samplers for virus-containing aerosols. Journal of Aerosol Science. 2005;36:593–607. doi: 10.1016/j.jaerosci.2004.12.004. [DOI] [PMC free article] [PubMed] [Google Scholar]
- Willeke K, Grinshpun SA, Ulevicius V, Terzieva S, Donnelly J, Stewart S, Juozaitis A. Microbial stress, bounce, and reaerosolization in bioaerosol samplers. Journal of Aerosol Science. 1995;26:883–884. doi: 10.1016/0021-8502(95)97349-J. [DOI] [Google Scholar]
- Yu L, Wang J, Zhao JJ, Wen Zh B, Yang WH, Li N, Wang J, Lu J Ch, Li JS. Isolation of Escherichia coli phages and their biological characteristics. Bulletin Academy of Military Medical Science. 2008;32:432–435. [Google Scholar]
- Yu L, Wen Zh B, Yang WH, Li N, Wang J, Lu J Ch, Li JS. Isolation and characterization of Serrratia marcescens phage. Acta Microbiologica Sinica. 2008;48:498–502. [PubMed] [Google Scholar]