

Summary
Hydrogen peroxide (H2O2) is a key redox intermediate generated within cells. Existing probes for H2O2 have not solved the problem of detection of the ultra-low concentrations of the oxidant: these reporters are either not sensitive enough, or pH-dependent, or insufficiently bright, or not functional in mammalian cells, or have poor dynamic range. Here we present HyPer7, the first bright, pH-stable, ultrafast and ultrasensitive ratiometric H2O2 probe. HyPer7 is fully functional in mammalian cells and in other higher eukaryotes. The probe consists of a circularly permuted GFP integrated into the ultrasensitive OxyR domain from Neisseria meningitidis. Using HyPer7, we were able to uncover the details of H2O2 diffusion from the mitochondrial matrix, to find a functional output of H2O2 gradients in polarized cells, and to prove the existence of H2O2 gradients in wounded tissue in vivo. Overall, HyPer7 is a probe of choice for real-time H2O2 imaging in various biological contexts.
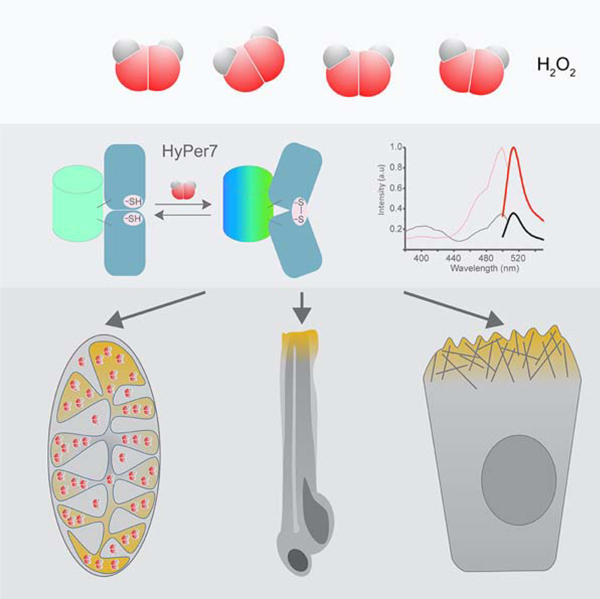
Graphical Abstract
eTOC
Pak et al. have developed HyPer7, a next generation genetically encoded fluorescent probe for H2O2 detection. Importantly, HyPer7 is resistant to pH changes. Applying HyPer7 to study H2O2 diffusion from the mitochondrial matrix, the authors decipher the topology of H2O2 production by Complex I and visualize oxidant gradients in cell motility and wounded tissue.
Introduction
Hydrogen peroxide is one of the key intermediates of aerobic metabolism. Being a substrate for four-electron reduction in the respiratory chain, oxygen can also undergo incomplete reduction to the superoxide anion radical (O2.−) and H2O2 (Droge, 2002). These two products have different molecular targets, interaction chemistry, and lifetime (Winterbourn, 2008). In contrast to extremely short-living superoxide, H2O2 can exist for up to several seconds in aqueous solutions, and can serve as a secondary messenger by reversibly oxidizing specific protein thiolates. There are many sources of H2O2 within cells, ranging from specific enzymatic sources – including NADPH oxidases (Bedard and Krause, 2007) or monoamine oxidases (Edmondson and Binda, 2018) – to the multiple mitochondrial sites where electrons can “leak” from intermediate acceptors in the respiratory chain (Brand, 2010; Murphy, 2009). H2O2 levels are tightly controlled by antioxidant machinery, including thioredoxin (Collet and Messens, 2010; Lu and Holmgren, 2014) and glutathione (Arteel and Sies, 2001) systems that both take electrons from NADPH and transfer them to terminal peroxidases such as peroxiredoxins and glutathione peroxidases. These enzymes convert H2O2 into water.
For many decades reactive oxygen species (ROS) in biological systems were viewed as toxic intermediates of aerobic metabolism. Since the mid-90s, however, it became clear that H2O2 is a signaling molecule (Bae et al., 1997; Lee et al., 1998), and the concept of oxidative stress has recently been revised (Sies et al., 2017). Indeed, sites of redox regulation through reversible thiol oxidation have till now been found in virtually all metabolic and signaling pathways using bioinformatics (Fomenko et al., 2007) and proteomics (Yang et al., 2016).
The earlier generation of genetically encoded oxidant-sensitive fluorescent probes provided new insights into redox biology by allowing the real-time monitoring of redox intermediates in living cells. Such probes provide advantages of selectivity, reversibility, ease of intracellular targeting, and the possibility of generating transgenic animals. However, these previous biosensors have limited effectiveness because of moderate sensitivity, poor brightness, pH-sensitivity, and a limited dynamic range.
The first genetically encoded probe for H2O2 – HyPer and its later versions– consisted of circularly permuted YFP (cpYFP) integrated into the regulatory domain of the E. coli protein OxyR, an H2O2 sensing domain (Belousov et al., 2006; Bilan and Belousov, 2015; Ermakova et al., 2014). OxyR has several structural features which render its Cys199 residue selective towards oxidation by H2O2 but not by other oxidants (Choi et al., 2001). In contrast to synthetic H2O2-sensitive dyes, HyPer oxidation is reversible, a sensitivity and reaction rate that are several orders of magnitude higher, and it does not generate photodynamic ROS. By now, HyPer has been used in a wide range of biological settings, from cultured cells to in vivo (Bilan and Belousov, 2015; Steinhorn et al., 2018). However, all HyPer family probes have the disadvantage of being pH sensitive. As a result, this behavior necessitates control experiments using a HyPer C121S (C199S in wtOxyR) variant that is insensitive to H2O2 but retains pH-sensitivity (Belousov et al., 2006).
Another group of H2O2 probe is based on roGFP2. roFPs are fluorescent proteins in which engineered point mutations introduce a pair of Cys residues that are capable of disulfide formation upon oxidation. While roGFP itself is not directly sensitive to H2O2, fusion to a thiol peroxidase makes the roGFP protein a part of a redox relay, providing electrons for peroxidase, and undergoing spectral changes upon oxidation. The roGFP2-Orp1 probe appears to have similar sensitivity yet has slower responsiveness compared to HyPer (Gutscher et al., 2009). However, even fused with peroxidase, roGFP2 retains its sensitivity to the intracellular GSH/GSSG ratio, and other thiol species e.g. persulfides (Ezeriņa et al., 2018).
Taken together, the current H2O2 probes are sensitive to relatively high concentrations of H2O2 that are produced within the cell upon strong stimuli such as growth factors, death ligands, and various cytokines. However, smaller H2O2 concentration changes near the basal level of the oxidant remain invisible. A few attempts to design a probe with a higher sensitivity based on the use of peroxiredoxins as sensitive domains resulted in limited success because the probe turned out to be functional in yeasts but not in mammalian cells (Morgan et al., 2016), or had a very low signal change typical for FRET reporters (Langford et al., 2018). Therefore, the need for a highly sensitive and specific H2O2 probe functional in various physiological contexts, – and with a high dynamic range – has until now not been met.
Here, we report on HyPer7, a hydrogen peroxide probe based on cpGFP integrated into the OxyR-RD domain from Neisseria meningitidis. HyPer7 fulfills all the requirements for an ultrasensitive and ultrafast H2O2 sensor functional in a broad range of species. With its improved properties, we expect that HyPer7 will become the probe of choice in the redox biology field, and beyond.
Design
Generation of an ultrasensitive H2O2 probe
In order to find a suitable OxyR regulatory domain (OxyR-RD) with a higher sensitivity compared to the E. coli OxyR-RD, we constructed and analyzed a tree of OxyR sequences (Figure 1A). As we had no a priori information on the expected sensitivity of the different OxyRs, we have chosen 11 proteins from different bacterial taxa covering a broad range of species living in different environments and which are evolutionarily distant from one another. The set of the OxyR versions of choice are presented in Figure S1. We have integrated cpYFP between positions 125 and 126 of the OxyR-RDs (E. coli OxyR-RD nomenclature) (Figure 1B).
Figure 1.

Design of the ultrasensitive H2O2 indicator. (A) Neighbor joining-based phylogenetic tree of the OxyR-RD domain sequence based on the multiple sequence alignment derived from Supplementary Figure 1. The tested 11 OxyR regulatory domain sequences are highlighted in bold, and the regulatory domain sequence of HyPer7 (from Neisseria meningitidis) is highlighted in red. (B) cpYFP from HyPer probe was integrated into 11 selected OxyR-RD protein domains. The most sensitive version was further improved by mutagenesis.
Out of 11 constructs, 6 responded to exogenous H2O2 in bacterial suspension, although all of them were weakly fluorescent. Therefore, we designed several additional constructs in which the cpYFP insertion position was varied for each OxyR-RD in order to optimize the folding of the fluorescent domain. Among the constructs tested, the one with cpYFP inserted into the 126–127 position of Neisseria meningitidis OxyR demonstrated a 30% change of fluorescence intensity in HeLa-Kyoto cells upon addition of 2 μM H2O2 to the imaging medium. The protein was still relatively dim and possessed a single maximum in its excitation spectrum. We introduced Y132F mutation (corresponding to Y145F in the YFP nomenclature) reported to enhance the brightness of the cpYFP-based SypHer3s pH probe (Ermakova et al., 2018), along with a number of random mutations. This yielded a set of novel mutations (namely D135N, G298S and T379P in the current construct nomenclature) that enhanced the brightness of the probe and led to the appearance of a second maximum in the excitation spectrum. Interestingly, the G298S mutation corresponds to a substitution of the first amino acid of the amino acid triade that forms the GFP chromophore. With serine in this position, the chromophore becomes identical to the one of wtGFP from Aequorea victoria. The resulting protein, apart from its ultrahigh sensitivity to H2O2, was much brighter than the previous versions of the probe. The construct demonstrated a 30% change of the fluorescence ratio in HeLa-Kyoto and E. coli cells upon addition of 2 μM H2O2 in contrast to HyPer3 which did not react at all to this concentration (Figure S2A–E). The C121S version of the probe in which the redox sensitive cysteine was substituted to a Ser was not sensitive to H2O2. The working name for this clone was HyPer7, and we decided to leave it, as the name of the probe highlights its unique features (see below), jumping over several generations from its previous version, HyPer3.
Results
In vitro characterization of HyPer7
We have characterized the quantitative parameters of purified HyPer7. It has two excitation maxima, 400 and 499 nm, and one emission peak centered at 516 nm (Figure 2A). Upon oxidation, excitation and absorption spectra of HyPer7 changed in a ratiometric way, with a decrease at 400 nm and an increase of the 499 nm peak (Figure 2A and Figure S3A,B). For simplicity, we will further call the ratiometric HyPer7 signal “F500/F400” or “HyPer7 ratio”. HyPer7 has a molar extinction coefficient of 74,000 M−1cm−1 (vs. 17,000 for HyPer3) and a fluorescence quantum yield of 0.4 or 0.32 in the reduced and oxidized forms, respectively. Therefore, the sensor is ~15–17 fold brighter than HyPer3. Further, the oxidation of HyPer7 is fully reversible (Figure S3C).
Figure 2.

In vitro characterization of HyPer7. (A) Fluorescence excitation and emission spectra of HyPer7 in oxidized and reduced state. (B) pH-dependency of HyPer7 and HyPer3 in the physiological pH range. F500 and F400 are fluorescence intensities excited at 500 nm and 400 nm, respectively. (C) HyPer7 responds much faster than HyPerRed to the addition of exogenous H2O2 added to Ea926.hy human endothelial cells. Curves represent simultaneous responses to H2O2 treatment (50 μM) of Ea926.hy cells co-expressing HyPer7 (black curve) and HyPerRed (red curve). The speed of HyPer7 response is principally limited by the imaging system used. (D) The response of HyPer7 of the indicated concentrations to increasing concentrations of H2O2. The y-axis represents the HyPer7 ratio, normalized to the ratio prior to the addition of oxidant. Each point represents the mean of three repeats, the error bars denote the standard deviation. The inset depicts the lower nM range for HyPer7 at a concentration of 1 μΜ. (E) Selectivity of HyPer7. Reduced HyPer7 was incubated with the respective substances. XOX = xanthine oxidase; X = xanthine (50 μΜ); cat = catalase (100 nM); tBOOH = tert-butyl hydroperoxide; CumOOH = cumene hydroperoxide; benzOOH = benzoyl hydroperoxide; 4H2N = 4-hydroperoxy 2-nonenal. Catalase was added to ONOO− sample to remove any H2O2. The y-axis represents the HyPer7 ratio, normalized to the ratio obtained with the addition of an equal volume of vehicle (100 mM phosphate buffer, pH 7.4 + 0.1 mM DTPA or acetone for the organic and lipid hydroperoxides). Each bar represents the mean of three replicates and the error bars denote the standard deviation. The dotted vertical lines separate two different concentrations of the organic hydroperoxides and H2O2. The horizontal black line separates the conditions where HyPer7 reacts to the oxidant (gray bars) from those where it does not, i.e. normalized ratio >1 (white bars).
Although the fluorescence intensity of both the 400 and 500 nm excitation maxima depended on the pH, the ratiometric readout of the probe demonstrated a high pH-stability in the physiological pH range (Figure 2B and Figure S3D), similar to roGFP2-based probes.
To understand how the enhanced pH-stability of the probe results in stability of the signal in living mammalian cells, we incubated cells expressing either HyPer7 or HyPer3 in media with different pH and performed flow cytometry analysis. To avoid possible oxidation events, C121S versions of the probes were used in these experiments. Incubation of the cells in medium of pH 7.4, or alternatively, pH 6 or 8, resulted in large shifts in the HyPer3 ratio, whereas the HyPer7 ratio remained unchanged (Figure S3E,F). This indicates that the high pH stability of the probe allows its application for imaging under experimental conditions associated with relatively large pH shifts.
To compare the HyPer7 reaction rate with H2O2 with that of previous HyPer versions, we developed progress curves for the three biosensors under the same experimental conditions and determined that the initial velocities for HyPer 1, 3 and 7 are 0.454 ± 0.014, 0.315 ± 0.007 and 26.9 ± 0.28 AU/s, respectively (Figure S3G). This means that the initial velocity of HyPer7 is approximately 60 and 86 times faster compared to those of HyPer 1 and 3, respectively.
The faster kinetics of HyPer7 resulted in the improved responsiveness of the probe in cultured mammalian endothelial cells (Figure 2C and Figure S3H–J).
To quantitatively evaluate the sensitivity of HyPer7, three different concentrations of the probe, 1, 2.5 and 7.5 μM were incrementally treated with a broad range of H2O2 concentrations starting from low nanomolar to micromolar (Figure 2D). As can be seen in the inset of the Figure 2D, 1 μΜ HyPer7 responds to approximately 10 nM H2O2, i.e. 100x less than the concentration of the protein. This amount of H2O2 changes the HyPer7 ratio by approximately 5%.
To compare the sensitivities between the different HyPer versions, we determined the minimum H2O2 concentration that elicits a ratio increase by 0.1 a.u. For HyPer 1/3 this concentration is approximately 1 μΜ, while for HyPer7 this concentration is 0.03 μΜ. Hence, HyPer7 is at least 30 times more sensitive than previous HyPer versions (Figure S3K,L).
Because the selectivity of N. meningitidis OxyR towards H2O2 could differ from that of the E. coli one, we determined the spectral responses of HyPer7 to various oxidants. H2O2 and high concentrations of organic hydroperoxides were able to induce substantial changes in the HyPer7 signal. However, when the peroxides were applied at concentrations of 1 μΜ, οnly H2O2 elicited a substantial response – that of CumOOH was much lower, and HyPer7 did not respond to tert-butyl hydroperoxide and 4-hydroxy-2-nonenal. Other oxidants were not able to induce HyPer7 oxidation. This indicates high selectivity of the probe towards H2O2 (Figure 2E). A likely explanation for the response of HyPer7 to cumene hydroperoxide is traces of H2O2 known to contaminate all commercial organic hydroperoxides (Nakashima et al., 1994).
Visualization of H2O2 transport across mitochondrial membranes
Mitochondria are the main oxygen consuming organelles in cells, and historically have been considered as a principal intracellular source of ROS. In the mitochondria, a number of sites have been shown to donate electrons to molecular oxygen. These sites include Complex I, Complex III, oxoglutarate dehydrogenase and several other enzymes (Murphy, 2009).
Whereas enzymes like pyruvate dehydrogenase and oxoglutarate dehydrogenase generate the superoxide anion radical in the mitochondrial matrix, ETC ROS production sites vary in their location relative to the mitochondrial inner membrane. For example, Complex I generates superoxide to the matrix whereas Complex III mainly to the IMS (Brand, 2010). Although experiments with isolated mitochondria clearly demonstrate the possibility of H2O2 diffusion from the matrix outside, it is not clear if this diffusion takes place in the context of intact living cells. Indeed, purified mitochondria lack their natural environment including a broad variety of cytosolic metabolites, proteins that interact with the mitochondria, antioxidant systems and their substrates, etc.
To overcome the abovementioned challenges, we performed a series of experiments using the HyPer7 probe combined with other H2O2 probes and a chemogenetic substrate-controlled H2O2 generator, D-amino acid oxidase (DAO) (Bogdanova et al., 2017), targeted to the mitochondrial matrix.
First, we studied H2O2 diffusion into the mitochondrial matrix. Our previous experiments demonstrated that H2O2 efficiently diffuses from the cytosolic compartment to the matrix (Mishina et al., 2019). To evaluate whether there is a gradient of H2O2 between the cytosol and the mitochondrial matrix we performed titration with low doses of H2O2 on K562 cells expressing either HyPer7-NES (NES=nucleus exclusion signal, cytosolic localization) or mito-HyPer7 (Figure 3A).
Figure 3.

Mitochondrial H2O2 production: diffusion and topology. (A) HyPer7 F500/F400 ratio in cytosol (NES, nuclear exclusion signal) and mitochondrial matrix (mito) of transiently transfected K562 cells exposed to different concentrations of H2O2. Data are the results of flow cytometry analysis. Each bar represents the mean of N replicates and the error bars denote the standard deviation (at [H2O2] ≤ 0.2 μM N=5, at [H2O2] > 0.2 μM N=3; *,** P < 0.05 versus control using unpaired t-test) (B) Images of HyPer7 and HyPerRed in different compartments of HeLa-Kyoto cells expressing mito-DAO before and after the addition of D-Ala. HyPer7 is targeted to the mitochondrial matrix (mito, scale bar 20 μm), mitochondrial intermembrane space (IMS, scale bar 30 μm), cytosol (NES, nuclear export signal, scale bar 15 μm), nucleus (NLS, nuclear localization signal, scale bar 10 μm). Cells on the lowest panel were preincubated with auranofin (Aur). (C, D) H2O2 dynamics in various compartments of mito-DAO expressing cells in the absence (C) or in the presence (D) of auranofin detected with HyPer7 and HyPerRed. Traces represent mean and standard deviation from at least 10 cells in each of 3 biological replicates. (E, F) Flow cytometry histograms displaying mito-HyPer (E) and mito-HyPer7 (F) ratio signals in K562 cells exposed to rotenone. (G) HyPer7 ratio in cytosol (NES, nuclear exclusion signal) and mitochondrial matrix (mito) of transiently transfected K562 cells exposed to different concentrations of rotenone. Data are the results of flow cytometry analysis. Each bar represents the mean of four replicates and the error bars denote the standard deviation (* P < 0.05 versus control using unpaired t-test).
Minimal doses of externally added H2O2 that caused a detectable oxidation of both probes were in the nanomolar range of concentrations (Figure 3A). Given an approximately 400-fold gradient between the extracellular and intracellular peroxide levels which is established in the cytosol of K562 cells due to effective H2O2 scavenging by cellular antioxidants (Lyublinskaya and Antunes, 2019), we may suppose that HyPer7-NES responded to subnanomolar concentrations of intracellular hydrogen peroxide. This is in contrast to the previous version of the probe, HyPer-3, which was sensitive to only 3 nM of intracellular H2O2 (Huang and Sikes, 2014). Mito-HyPer7-MLS sensitivity differed only slightly from that of HyPer7-NES, indicating that the mitochondrial matrix is relatively weakly protected from external sources of H2O2.
To verify if H2O2 produced within the matrix can exit and reach the cytosol we placed DAO into the matrix and co-expressed it with mito-HyPerRed and with HyPer7 placed in various compartments of the cell. Both mito-HyPer7 and mito-HyPerRed were able to reflect matrix H2O2 production after addition of D-Ala, although mito-HyPer7 showed a fast and complete saturation whereas mito-HyPerRed was oxidized slower and did not reach saturation (Figure 3B,C). This is a clear consequence of higher sensitivity of HyPer7. However, in striking contrast to almost unrestricted H2O2 diffusion from the cytosol into the matrix, we observed no oxidation of HyPer7 in the cytosol indicating the strict restriction of diffusion of matrix-produced H2O2 to the cytosol (Figure 3B,C).
We assumed that since thioredoxin (Trx)-fueled thiol peroxidases are known to be the main scavenger of H2O2 in both cytosol and mitochondria, the thioredoxin system could be responsible for scavenging mitochondrial H2O2 on its way to the cytosol. Indeed, preincubation of the cells with the thioredoxin reductase (TRR) inhibitor auranofin led to immediate release of mitochondrial H2O2 upon addition of D-Ala (Figure 3B,D). This indicates that the thioredoxin system is responsible for H2O2 restriction within the mitochondria.
The mitochondrial matrix is separated from the cytosol by two membranes, inner and outer, with the intermembrane space (IMS) being a distinct compartment with a unique redox environment (Hu et al., 2008). We tested whether H2O2 produced within the matrix can reach the IMS. Therefore, we co-expressed mito-DAO with HyPer7-IMS wherein the SMAC/DIABLO protein was used as an IMS localization tag (Du et al., 2000). Addition of D-Ala induced a substantial increase of the HyPer7-IMS signal indicating that some part of the H2O2 produced in the matrix can leak to the IMS (Figure 3B,C). Therefore, either the IMS or the outer mitochondrial membrane or both serve as an additional barrier for H2O2 on its way from the mitochondria to the cytosol.
In the presence of auranofin the signal of HyPer7 in the IMS quickly reached saturation, again indicating the crucial role of the Trx system in preventing the spread of mitochondrial H2O2 (Figure 3D).
Topology of H2O2 production by Complex I
The next set of experiments allowed us to compare the ability of HyPer7 vs. HyPer3 to detect endogenous H2O2 production in the mitochondrial matrix. Inhibition of Complex I of the mitochondrial electron transport chain (ETC) has been shown to induce H2O2 production by isolated mitochondria (Turrens and Boveris, 1980) and that leads to the appearance of H2O2 in the cytosol of living cells (Malinouski et al., 2011). Moreover, it was demonstrated using HyPer that a 24-hour treatment of cells with rotenone, an inhibitor of Complex I, leads to the appearance of H2O2 in the cytosol, but not in the mitochondrial matrix (Forkink et al., 2015). This observation could lead to an important conclusion about the topology of oxidant production by Complex I which contradicts the prevalent view that Complex I generates superoxide in the matrix. However, HyPer as well as its second and third generation versions could be either i) not sensitive enough to detect low concentrations of H2O2 or ii) too pH-sensitive to detect low amounts of H2O2 over the background of matrix acidification caused by blocking the ETC. To test both possibilities we added rotenone to cells expressing either mito-HyPer7 or mito-HyPer3. Indeed, the signal of mito-HyPer3 did not increase, but even decreased indicating acidification of the matrix (Figure 3E). The same result was obtained using the pH probe mito-SypHer (Figure S4B). In contrast, mito-HyPer7 showed a ratiometric increase, indicating the appearance of H2O2 in the matrix (Figure 3F), while mito-HyPer7-C121S did not respond to rotenone (Figure S4C). Therefore, the H2O2 sensitivity of HyPer7 permits the quantitation of endogenous mitochondrial H2O2 production, with the HyPer7 signal unaffected by pH changes during mitochondrial respiration.
To determine the topology of H2O2 production by Complex I, we have performed a series of experiments where we incubated cells expressing HyPer7 in the mitochondrial matrix, IMS, or cytosol and compared the degree of probe signal changes in these compartments in response to Complex I inhibition (Figure 3G and Figure S4D). We observed substantial H2O2 changes in the mitochondrial matrix, but not in the IMS and cytosol, indicating that Complex I releases H2O2 to the matrix side of the inner mitochondrial membrane. Notably, auranofin led to a substantial increase of rotenone-driven H2O2 in all compartments indicating that the Trx system is indeed responsible for the prevention of H2O2 diffusion from the mitochondrial matrix (Figure S4D).
H2O2 gradients determine the stability of cellular protrusions
Cellular motility is based on the dynamic rearrangement of actin networks, with actin polymerization events being a driving force for protrusion formation (Wang, 1984). It has been shown that H2O2 levels are increased in migrating cells compared to stationary ones (Cameron et al., 2015), and intracellular H2O2 gradients are formed with the highest concentrations being in the front edge of migrating cells (Bouzigues et al., 2014). There are several mechanisms by which H2O2 influences actin dynamics including direct actin glutathionylation (Sakai et al., 2012) and the oxidation of cofilin, a key regulator of the actin network (Cameron et al., 2015).
However, it remains unknown which particular property of protrusion formation is regulated by H2O2. While it is known that the H2O2 concentration in the protrusion is elevated, it is not clear how this elevation is reflected in the protrusion dynamics. To address this question, we fused HyPer7 with LifeAct, a peptide that binds actin filaments with a relatively weak affinity and that allows actin visualization without affecting the shape and dynamics of native actin filaments, in contrast to direct fusions of FPs with actin (Riedl et al., 2008). We transfected NIH-3T3 fibroblasts with HyPer7-LifeAct and followed dynamics of H2O2 changes within spontaneously migrating cells.
The cells underwent spontaneous polarization and formed an intra-cytosolic H2O2 gradient with an elevated concentration of the oxidant at the leading edge (Figure 4A). HyPer7-LifeAct signal at the front edge was 2.14 +/− 0.08-fold higher compared to the perinuclear part of the cytosol (mean +/− SE, p<0.001). During changes in the direction of cell polarization, the gradient transiently disappeared (see 3:00 time point at Figure 4A,B). Migrating cells constantly formed small filopodia-like protrusions not only at the front edge, but also at all other sides indicating that protrusion appearance itself does not determine the directionality of the cell movement. We further analyzed the dynamics of protrusion formation and the decrease of H2O2 levels in them and found that the H2O2 gradient positively correlates with the stability of the protrusion (Figure 4C). Those protrusions that formed a strong gradient of H2O2 (HyPer7-LifeAct signal in protrusion/cytosol > 2) demonstrated an average protrusion lifetime of 52 +/− 3 min, whereas the protrusions with a low intensity gradient (HyPer7-LifeAct signal in protrusion/cytosol < 2) existed only for 19 +/− 3 min (p<0.001). High or low average concentration of H2O2 in the cytosol had no influence on protrusion dynamics (Figure 4D), indicating that the gradient rather than the absolute concentration of H2O2 correlates with protrusion lifetime.
Figure 4.

H2O2 gradients in cell polarization. NIH-3T3 cells transiently expressing HyPer7-LifeAct were imaged during spontaneous migration. (A) Images of a migrating cell at different time points. Upper and middle rows: fluorescent images excited by 405 nm and 488 nm. Lower row: ratiometric images. Addition of PEG-catalase (PEG-Cat) destroys the gradient and leads to retraction of the protrusions. Lines 1 and 2 were used to build kymographs. Scale bar shows 10 μm. (B) Kymographs of the HyPer7-LifeAct ratio along lines 1 and 2 representing the leading edge and the side of the cell from images shown in panel A, respectively. Notice that a more extensive gradient makes the protrusion more stable. (C, D) Correlation plots between the protrusion lifetime and either HyPer-LifeAct ratio gradient (C) or the mean HyPer-LifeAct ratio in the cell demonstrates positive correlation between protrusion stability and the intensity of the H2O2 gradient from the protrusion to the cell body (correlation coefficient 0.37), but not the mean H2O2 levels (correlation coefficient −0.06).
It is possible that the expression of HyPer7-LifeAct affects the dynamics of protrusion formation. To rule out this possibility we quantified the protrusion lifetime in cells expressing HyPer7-LifeAct, HyPer7-C121S-LifeAct, HyPer7 and EGFP. At low to moderate expression levels, we have found no differences between cells expressing either of the proteins and non-transfected cells. At high overexpression levels (in the top 15% brightest cells), however, all proteins affected protrusion dynamics indicating that while overexpression of recombinant proteins itself partially impairs cell motility, the mechanism of this impairment is not directly caused by HyPer7 or LifeAct overexpression (Figure S5A).
in vivo imaging of H2O2 gradients
Previous studies of tissue-scale H2O2 gradients in wound healing using the pH-sensitive H2O2 biosensor HyPer were confounded with possible pH effects on the regeneration response (Love et al., 2013; Niethammer et al., 2009). In the current experiments, zebrafish embryos were injected with HyPer7 mRNAs at the single cell stage and a tail fin amputation assay was performed on 48 hpf larvae. Imaging HyPer7 in the pH-insensitive ratiometric mode revealed the appearance of a clear gradient of H2O2 with maximal intensities at the wounding site (Figure 5). Control experiments with H2O2 insensitive HyPer7-C121S demonstrated no change in the signal, confirming that the gradient observed with HyPer7 is due to the specific oxidation of the probe. Therefore, the tissue-scale gradient of H2O2 in the wounded tissue indeed exists.
Figure 5.

Monitoring H2O2 production with HyPer7 in zebrafish larvae after wounding. Zebrafish embryos were injected with HyPer7 or HyPer7-C121S mRNAs at the one-cell stage and tail fin amputation assay was performed on 48 hpf larvae. Images were taken before amputation and time lapse imaging was performed up to 60 min post-amputation (mpa). HyPer7 and HyPer7-C121S ratios were quantified at the amputation plane and normalized to the mean fluorescence of the uncut tail for each larvae. (A) Representative images of HyPer7 and HyPer7-C121S expressing larvae before and after amputation. Scale bar is 100µm. (B) Time course of HyPer7 (black lines) or HyPer7-C121S (gray lines) in the wounding site of the larvae tail fin (values ± SEM, N=2) experiments, n≥4 embryos/time point; **, P<0,01; ***, P<0,001). Uncut tails - dashed line.
To demonstrate that HyPer7 expression does not affect the process of regeneration, we have measured the regeneration dynamics in zebrafish larvae expressing HyPer7, HyPer7-C121S, and un-injected animals. We have found no differences in the regeneration capacity between the animals (Figure S5B,C).
Discussion
An ideal H2O2 probe should be sensitive, bright, ratiometric, fast, stable to pH variations, and functional in different organisms. HyPer7 described in this paper has all these features. Although we do not know the details of the redox environment of N. meningitidis, a cause of bacterial meningitis, one could suggest that it evolved the ultrasensitive OxyR to ensure a very early response to survive host immune cells. The explanations of high reaction rate of N. meningitidis OxyR may lie in its active site pocket: while most OxyRs have a histidine residue before the peroxidatic cysteine, the OxyRs from the Neisseria group are the only ones with an asparagine residue at this position (Figure S1).
Due to its high sensitivity, HyPer7 can be applied for the assessment of basal hydrogen peroxide concentrations in cells. Our experiments allow us to estimate the range of basal intracellular H2O2 concentrations to be in the sub-nanomolar to low nanomolar range. This concentration range perfectly matches recently published data obtained using a cell culture model (Lyublinskaya and Antunes, 2019) and a perfused liver (Chance et al., 1979; Oshino et al., 1973).
The previous versions of HyPer suffered from a high pH-sensitivity. Several observations made in the current work highlight the importance of having a pH-stable readout for this ultrasensitive H2O2 probe. An example of the model where pH changes are able to produce substantial artifacts in H2O2 imaging is the fish-tail-fin-wound experiment. Experiments on D. rerio tail fin amputation demonstrated that H2O2 forms tissue-scale gradients upon tissue wounding. The oxidant gradient, visualized by the HyPer probe, serves as a chemotactic signal for neutrophils (Niethammer et al., 2009). It was subsequently demonstrated in Xenopus leavis larvae (Love et al., 2013) and adult zebrafish (Meda et al., 2016) that H2O2 is necessary for the induction of regeneration. However, in both studies, the pH sensitivity of HyPer was not properly considered. The pH probes used in these studies as a control have different pKas and smaller dynamic ranges compared to HyPer. In fact, the only proper controls for HyPer family reporters are their redox-insensitive counterparts, the C121S variants, also known as the SypHer family of pH probes (Ermakova et al., 2018; Matlashov et al., 2015; Poburko et al., 2011). They have the same pH sensitivity as HyPer probes, including the pKa and dynamic range. The lack of such controls in these experiments produced numerous personal communications about possible artifacts of H2O2 measurements. Our experiments with HyPer7 confirm H2O2 gradient existence, not only demonstrating the utility of a pH-independent readout, but also providing a much more solid background for numerous studies on inflammation and regeneration that are based on the existence of a tissue-scale H2O2 gradient. However, it is important to note that the probe is pH stable only in the ratiometric mode: intensiometric imaging would still be prone to pH driven artifacts.
Using HyPer7, we have addressed one of the key questions in redox biology: can H2O2 produced within the mitochondrial matrix reach other compartments? Hundreds of studies of mitochondrial H2O2 generation were performed using isolated mitochondria. It is clear that in many conditions H2O2 can leave mitochondria, however in all experimental conditions of this type one key element is missing: the context of the cell. Inside the living cell, mitochondria are surrounded by the complex environment of the cytoplasm, form contact sites with other organelles, have protein binding partners and exchange a great variety of factors with the rest of the cell. In contrast, purified mitochondria lack all these factors. Therefore, within the cellular context the properties of H2O2 release could differ dramatically. And, indeed, using HyPer7 we have found that although H2O2 is able to enter the mitochondrial matrix from the cytosol, the reverse direction is prohibited. These data are in agreement with previous observations that H2O2 generated by the mitochondria-targeted redox cycler, MitoPQ, caused oxidation of the matrix isoform of peroxiredoxin, Prdx3, but not the cytosolic Prdx2 in C2C12 myotubes (Hinchy et al., 2018) and that elevated H2O2 levels in the matrix of respiratory chain mutant yeast strains do not affect cytosolic H2O2 (Morgan et al., 2016). Our observations call for a re-evaluation of the role of mitochondria as the main source of ROS in the cell.
In the previous study (Mishina et al., 2019), we demonstrated that the thioredoxin system is responsible for restricting intracytosolic diffusion of H2O2. In the present study, we found that the same system is responsible for entrapping H2O2 within the matrix and for the restriction of the matrix-cytosol diffusion of the oxidant. It is clear that H2O2 is able to leak from the mitochondria to the cytosol only in case of a decrease in thioredoxin system functionality or upon a sustained generation of high concentrations of H2O2 in the matrix (Stein et al., 2018), when the thioredoxin system is most likely exhausted. In agreement with this, studies involving MitoPQ in adipocytes demonstrated that low concentrations of the redox cycler caused Prdx3 oxidation only, whereas high doses led to dimerization of both Prdx3 and Prdx2 indicating leakage of H2O2 from the matrix to the cytosol (Fazakerley et al., 2018).
Whereas the inner mitochondrial membrane is usually considered to be impermeable for most of the ions and metabolites, the outer membrane is viewed as much less selective. Therefore, it seemed logical that the inner membrane would be a major barrier for H2O2 on its way from the matrix to the cytosol, whereas the outer membrane would be more or less freely permeable for the oxidant. To our surprise, we have found that a substantial amount of H2O2 produced within the matrix leaks into the IMS, but does not pass further to the cytosol, indicating that the IMS is an additional line of antioxidant defense against H2O2 produced within the matrix. Another explanation of this phenomenon is that the large volume of the cytosol compared to the mitochondria and a high abundancy of cytosolic peroxiredoxins make the cytosol an effective scavenger of mitochondrial H2O2.
Our data and those of others discussed above indicate that mitochondria can be a source of H2O2 at the cellular scale only in a limited spectrum of conditions of i) continuous and/or excessive ROS production in the matrix, or ii) inactivation of the thioredoxin – peroxiredoxin axis. The latter scenario can be caused by either insufficient electron influx from NADPH or by overoxidation of Prdx3 which was shown to cause accumulation of H2O2 (Kil et al., 2012).
The central open question in the mitochondrial redox biology field is the molecular identity of the H2O2 transporter across the inner mitochondrial membrane, and whether it is also a water transporter. Although both the diffusion of H2O2 to and from mitochondria and a rapid swelling of the mitochondria in hypotonic solutions (indicating water transport), are known for decades, the mitochondrial transporters for both molecules remain unknown. One candidate for such a transporter would be an aquaporin (AQP) family member (King et al., 2004) as some of them function also as peroxiporins (Bertolotti et al., 2013; Miller et al., 2010). AQP8 was found to be associated with mitochondria in various cells, however the studies are mostly based on subcellular fractionation protocols that do not exclude impurities from other organelles, such as the endoplasmic reticulum (Calamita et al., 2005; Lee and Thévenod, 2006). In agreement with the latter, studies exist demonstrating that AQP8 is rather an ammonia but not a water transporter in mitochondria, or even does not exist in the mitochondria (Soria et al., 2010; Yang et al., 2006). Overall, the molecular identity of mitochondrial H2O2 transport remains to be elucidated.
It has been known since the late-80s that ROS promote cell motility (Sundaresan et al., 1995; Wach et al., 1987). Since then some molecular mechanisms were uncovered linking H2O2 production at the front edge of the migrating cell to the remodeling of the actin filament network. However, an important question remained open: which decision-making parameter of the H2O2 gradient is being used by the cell? This could be either the absolute concentration of H2O2 in the protrusion or the difference in H2O2 concentration between the protrusion and the cell body. Our experiments clearly demonstrated that the latter is the case: the stability of the protrusion is associated with steepness of the H2O2 gradient from the protrusion to the cytosol. Most likely our observation suggests that the F-actin polymerization and depolymerization events occur constantly and randomly in all directions and therefore an increase of H2O2 in some particular direction over other directions dictates the orientation and stability of the protrusion.
Taken together, our findings demonstrate the full power of HyPer7 in uncovering the role of low levels of H2O2 in cell physiology.
Limitations of Study
We expect that being an ultrasensitive and ultrafast indicator, HyPer7 would not be able to discriminate between moderate and high concentrations of H2O2 that are above its saturation range. Therefore, if needed, HyPer7 and be used in combination with the probes with lower sensitivity, such as HyPer3 or HyPerRed. This case can be illustrated by the Figure 3C where mito-HyPer7 becomes saturated immediately after mito-DAO activation whereas lower sensitivity mito-HyPerRed operates within its dynamic range.
HyPer7 has green fluorescence. It means that its spectrum is not optimal for deep tissue imaging in relatively large non-transparent organisms like rodents. Visible light poorly penetrates tissues, therefore future development of far-red probes for H2O2 is necessary to overcome this limitation.
STAR Methods
LEAD CONTACT AND MATERIALS AVAILABILITY
Further information and requests for resources and reagents should be directed to and will be fulfilled by the Lead Contact, Vsevolod V. Belousov (belousov@ibch.ru). This study generated plasmids encoding HyPer7 that are deposited on Addgene (name #Addgene ID: pLifeAct-HyPer7 #136464; pCMV-HyPer7-MEM #136465; pCS2+HyPer7 #136466; pCS2+HyPer7-NES #136467; pCS2+HyPer7-NLS #136468; pCS2+IMS-HyPer7 #136469; pCS2+MLS-HyPer7 #136470)
EXPERIMENTAL MODEL AND SUBJECT DETAILS
Cell culture
HeLa Kyoto cells (gender: F) were cultured in RPMI1640 (PanEko) supplemented with 10% FBS v/v (Biosera), 2 mM L-glutamine (PanEko), 100 U/ml penicilin (PanEko) and 100 mg/ml streptomycin (PanEko) at 37 °C in a 5% CO2 atmosphere.
EA.hy926 cells (gender: M) were obtained from ATCC and maintained in Dulbecco’s modified Eagle’s medium (DMEM) supplemented with 10% FBS, v/v, 1% HAT (5 mM hypoxanthine, 20 μM aminopterin, 0.8 mM thymidine), 4 mM glutamine, 50 U/ml penicillin and 50 mg/ml streptomycin, at 37 °C in a 5% CO2 atmosphere.
NIH-3T3 cells (gender: M) were cultured in DMEM containing 10% FBS without antibiotics at 37 °C in a 5% CO2 atmosphere.
K562 cells (gender: F) were maintained in RPMI-1640 medium supplemented with 10% fetal bovine serum and 1% L-glutamine at 37 °C in a 5% CO2 atmosphere.
Zebrafish Danio rerio
Zebrafish colonies (AB-TU strain) were maintained using standard methods. The animal facility obtained an agreement from the French Ministère de l’Agriculture (no. C75–05-12), and the protocols were approved by the Ministère de l’Education Nationale de l’Enseignement Supérieur et de la Recherche (00477.02). To maintain a healthy colony, a 14 h light to 10 h dark cycle was adopted, and a water temperature of 28 °C was maintained, with a maximal density of five fish per liter. Water filtration depended on the aquatic habitat stand-alone fish housing and was operated automatically (Aquatic Habitat Inc, FL, USA). The fish were fed twice a day with live 2-day-old paramecia.
METHOD DETAILS
Multiple sequence alignment and phylogeny of OxyR sequences
The 38 OxyR regulatory domain protein sequences (see full list in Figure S1) were taken from the Uniprot/Uniparc database (http://www.uniprot.org) or Genbank. Multiple sequence alignment was performed with ClustalW included in the MEGA software package (Kumar et al., 2016). The obtained multiple sequence alignment was used to create a neighbor-joining based phylogenetic tree and the Jones–Taylor–Thornton matrix method (Jones et al., 1992) was utilized to generate the distance matrix. A pairwise deletion was utilized, and the level of confidence was measured based on 3000 bootstrap replicates. The MEGA software package was used to generate the phylogenetic tree (Kumar et al., 2016), and the web-based program iTOL was utilized to generate the final figure (Letunic and Bork, 2016).
Gene design and cloning
Codon-optimized sequences (Supporting information) of OxyR regulatory domains were purchased from IDT. Chimeric constructs containing the cpYFP coding sequence inserted into OxyR and their point mutants were created by overlap extension PCR (Ho et al., 1989) and subcloned into the pQE30 vector using BamHI/HindIII restriction sites (see primer list). Random libraries of the H7 206–207 construct were created by an error-prone PCR reaction with primers 5’-attagctacaggatcccgggaattcgccaccatg-3’ and 5’-attggatcgaaagcttacagtcggcctcgagtca-3’.
For expression in eukaryotic cells, selected cDNAs were cloned into the pCS2+ vector using EcoRI/XhoI sites. Mitochondrial matrix, mitochondrial intermembrane space, nuclear and cytosolic versions of HyPer7 were also created by overlap extension PCR and subcloned into the pCS2+ vector using the same sites. pC1-HyPer3-dmito, pC1-HyPer2-IMS, pC1-HyPer2-NLS and pC1-HyPer2-NES vectors previously generated in our laboratory were used as PCR matrices for amplification of mitochondrial matrix, mitochondrial intermembrane space, nuclear and cytoplasmic (nuclear exclusion signal) localization signals, respectively. The pLifeAct-HyPer7 plasmid was obtained by replacing the FusionRed coding sequence with HyPer7 in pLifeAct-FusionRed plasmid using the AgeI and NotI sites.
Library screening
Libraries were transformed into XL1-blue competent cells and grown overnight on agar plates. After 12–24 hours incubation at room temperature, colony brightness was visually inspected in the cyan and blue excitation channels using an Olympus US SZX12 fluorescent stereo microscope. Brightest clones were transferred onto new plates and grown overnight. After incubation at room temperature bacteria were resuspended in PBS (pH 7.4) and excitation spectra in the 390–510 nm range were recorded in the absence/presence of 2–20-200 μM H2O2. Selected clones were grown in LB (100 μg/mL) overnight and plasmid DNA was extracted and sequenced.
Protein expression and purification
HyPer7 was expressed in the M15 E. coli strain from the pQE30 vector. An overnight LB culture set up in LB medium from a single colony was diluted 1:100 in LB + 100 μg/ml ampicillin and 50 μg/ml kanamycin. The culture was grown at 37°C with shaking at 130 rpm and induced at A600nm=0.4 and with 0.5 mM isopropyl-β-D-thiogalactopyranoside (IPTG). The temperature was then lowered to 18°C and the cultures were grown for an additional 18 h. The cells were harvested by centrifugation at 4,000 x g for 15 min at 4°C. After one freeze-thaw cycle, the cells were resuspended in 3 ml/g pellet lysis buffer (50 mM Tris, pH 8.0, 300 mM NaCl, 1.5 mM DTT, 10% glycerol, 1 mM benzamidine, 1 μg/ml Leupeptin, 0.1 mg/ml 4-(2-aminoethyl) benzenesulfonyl fluoride hydrochloride (AESBF), 100 μg/ml DNaseI, 20 mM MgCl2) and lysed by sonication at 70% amplitude for 3 min with a 30 sec on – 15 sec off cycle (Sonics Vibra-cell). The lysate was clarified by centrifugation at 39,000 x g for 30 min at 4°C, filtered through a 0.45 μm filter and added to Ni2+-Sepharose (GE Healthcare) affinity beads equilibrated with 40 mM (4-(2-hydroxyethyl)-1- piperazineethanesulfonic acid (HEPES), pH 7.4, 400 mM NaCl, 10% glycerol, 1 mM DTT. The lysate-bead suspension was incubated for 1 h at 4°C while rotating and subsequently packed into a column. After a wash step with 40 mM HEPES, pH 7.4, 400 mM NaCl, 10% glycerol, 1 mM DTT, the protein was eluted with a linear gradient to 1 M imidazole in the same buffer solution. Imidazole was removed by dialysis in 30 mM HEPES, pH 7.4, 150 mM NaCl, 10% glycerol, 2 mM DTT at 4°C, and the elution fraction was concentrated using a Vivaspin 6 10,000 MWCO PES concentrator (Sartorius) and further purified by gel filtration using a HiLoad Superdex75 PG (16/60) column (GE Healthcare) equilibrated with 30 mM HEPES, pH 7.4, 200 mM NaCl, 5 mM tris(2-carboxyethyl)phosphine (TCEP). The first and second purification steps were performed on the ÄKTA Pure FPLC system (GE Healthcare). The protein was stored in the same buffer at 4°C for up to a week.
Fluorimetry
Experiments for the determination of the specificity and sensitivity of HyPer7 were carried out by fluorimetry using an LS55 luminescence spectrophotometer at 25°C (Perkin Elmer). Prior to the experiment, HyPer7 was buffer-exchanged into Ar-flushed 100 mM sodium phosphate buffer, pH 7.4 containing 0.1 mM diethylene triamine penta-acetic acid (DTPA) using a 5 ml HiTrap desalting column (GE Healthcare). The protein concentration was determined with the Bradford reagent (Bio-Rad), using bovine serum albumin as standard. The protein was diluted to a final concentration of 2.5 μΜ and incubated with a 25x molar excess of TCEP for 12 h at 4°C. HyPers 1 and 3 were prepared the same way.
For the sensitivity measurements, the concentration of H2O2 was measured at 240 nm and calculated using the Lambert-Beer Law, taking ε240nm = 43.6 M−1 cm-1. Stock solutions with concentrations of 125 nM, 1.25 μΜ and 12.5 μΜ H2O2 were prepared. The assay was carried out by adding 20 μl from each stock solution to a cuvette with 300 μl protein till a plateau was reached. Following H2O2 addition, the excitation at λ = 495 nm with emission at λ = 520 nm was monitored in real time until a steady state had been reached, after which the excitation spectrum from λ = 350 nm to λ = 512 nm with emission at λ = 520 nm was recorded.
For the specificity measurements, each putative oxidant was added at 50x the final volume to a cuvette containing 490 μl protein, otherwise the measurements were carried out as described above. The organic and lipid hydroperoxides, which are poorly soluble in water, were added directly to the cuvette to obtain the indicated concentrations (in all cases < 5 μl was added). As these lipid hydroperoxides were dissolved in acetone, we first tested HyPer7 with acetone to make sure that it was not influencing the read-out. For the experiments with the lower concentrations (1 μΜ), the organic and lipid hydroperoxides were first diluted 100 times in the aforementioned phosphate buffer and sonicated for 10 s with an amplitude of 37% to increase solubility. Volumes needed to obtain a final concentration of 1 μΜ were then used to treat HyPer7. The concentration of the peroxynitrite (ONOO−) stock was determined spectrophotometrically, using ε302nm = 1670 M−1 cm-1. As the ONOO− stock was stored in strongly alkaline conditions, we also checked the pH of the solution with a final concentration of 100 μΜ ONOO−, and found a pH of approximately 7.4. All chemicals used for the specificity assay were purchased from Sigma-Aldrich, except for ONOO− and 4-hydroperoxy 2-nonenal (Cayman Chemical), and GSSG (Roche).
Pre-steady state kinetic measurements
Pre-steady state kinetic measurements were performed using a stopped-flow apparatus coupled with a fluorescence detector (Bio-Logic) with λex = 495 nm, and by following the emission at λ = 515 nm. HyPer7 was prepared in the same way as for the fluorimetry assays, i.e. the protein was used at a concentration of 2.5 μΜ in Ar-flushed 100 mM sodium phosphate buffer, pH 7.4, containing 0.1 mM DTPA. The protein was mixed with increasing concentrations of H2O2 at a 37:1 protein: H2O2 ratio. The progress curves were used to estimate the initial velocities. The experiment was performed in triplicates.
pKa determination
To determine the pKa of HyPer7, the protein was buffer-exchanged to 100 mM sodium phosphate buffer, pH 7.4, containing 0.1 mM DTPA, and its concentration was determined as described above. The protein was then diluted to a final concentration of 0.5 μΜ in the respective pH buffer solutions: pH 3.0 – 4.5 – 130 mM KCl, 30 mM NaCl, 0.5 mM MgCl2, 0.2 mM EDTA, 30 mM NaH2C6H5O7/HCl; pH 5.0 – 7.5 – 130 mM KCl, 30 mM NaCl, 0.5 mM MgCl2, 0.2 mM EDTA, 15 mM KH2PO4/Na2HPO4; pH 8.0 – 13.0 – 130 mM KCl, 30 mM NaCl, 0.5 mM MgCl2, 0.2 mM EDTA, 20 mM Na2B4O7/HCl (or NaOH). To reduce the protein, TCEP (pH adjusted to 7.4) was added to all the samples to a final concentration of 5 mM. To oxidize HyPer7, each sample was treated with H2O2 to a final concentration of 100 μΜ. The excitation spectra (λex = 350 nm - λex =520 nm; λem = 560 nm) at varying pH were recorded in the SpectraMax ID5 plate reader (Molecular Devices). The assays were performed in triplicates.
Cell culture, plasmid transfection, and real-time imaging
For imaging experiments, HeLa Kyoto cells were seeded into 35 mm glass bottom dishes. After 24 h, cells were transfected using FuGeneHD transfection reagent (Promega) according to the manufacturer’s recommendations.
24 h after transfection, culture medium was replaced with 1.2 mL of HBSS solution (Sigma) supplemented with 20 mM HEPES (PanEko). Cell imaging was performed using a Leica DMI6000 microscope, equipped with an HCX PL APO lbd. BL 63 × 1.4NA oil objective at 37 °C. Fluorescence of HyPer probes was excited sequentially via 427/10 and 504/12 band-pass excitation filters. Emission was collected every 20 s using a 525/50 bandpass emission filter. For the HyPerRed probe, a TX2 filter cube was used (excitation: BP 560/40, dichromatic mirror 595, emission: BP 645/75). After 5–10 images were acquired, 300 µl Tyrode containing D-alanine or H2O2 was added.
To determine the response of the HyPer3/7 probes to exogenous H2O2, a solution of H2O2 was added to a final concentration of 2–20–200 µM. To induce intracellular H2O2-generation by DAO, D-alanine (Sigma) was used as a substrate. Solution of D-Ala in imaging medium was added to cells at 300 μl volume obtaining a final concentration of 4 mM. For experiments with TrxR inhibition cells were incubated in culture medium with 1 μM auranofin (Enzo) for 1 h prior to imaging.
The time series were analyzed using the Fiji freeware (https://fiji.sc). The background was subtracted from 420 and 500 nm stacks (corresponding to two HyPer excitation peaks). Each 500 nm stack was divided by the corresponding 420 nm stack frame-by-frame. The resulting stack was depicted in pseudocolors using a “16-colors” lookup table. The time course of HyPer fluorescence was calculated for regions of interest (ROI) inside the imaged cell.
EA.hy926 cells at ~80% confluency were transfected in cell culture medium using the transfection reagent PolyJet (SignaGen Laboratories) with 1 µg plasmid DNA following the manufacturer’s protocols. Cells were incubated for 5 h and then the culture media was replaced. All imaging experiments were performed 16–24 h after transfection. Prior to the imaging experiments, cells were washed with PBS and incubated for at least 2 h in a HEPES-buffered solution containing 138 mM NaCl, 5 mM KCl, 2 mM CaCl2, 1 mM MgCl2, 1 mM HEPES, 2.6 mM NaHCO3, 0.44 mM KH2PO4, 0.34 mM Na2HPO4, 10 mM D-glucose, 0.1% vitamins, 0.2% essential amino acids and 1% penicillin–streptomycin, pH 7.4. Imaging experiments were performed using a custom perfusion system with a peristaltic pump to maintain stable superfusion conditions. The superfusion solution consists of a physiological buffer with the following composition: 140 mM NaCl, 5 mM KCl, 2 mM CaCl2, 1 mM MgCl2, 10 mM D-glucose and 1 mM HEPES, pH 7.4. For live-cell imaging, the intensiometric HyPer-Red was excited at 561 nm and emission was collected at 615 nm. The ratiometric HyPer7 was excited both at 420 nm and 490 nm, and emission was collected at 530 nm. All cells were visualized using a ×40 oil immersion objective (Olympus). Images were acquired with a CCD camera from Hamamatsu. Real-time signals were acquired using Metafluor Software (Molecular Devices). For each experiment, an additional region for the background signal was acquired. Background subtraction was calculated in Microsoft Excel. The HyPerRed signal was normalized to 100% to the average signal in the corresponding cell population. The fluorescent signal of HyPerRed was calculated using the formula ΔF= 1-(F/F0)x100. The ratiometric signal of HyPer7 was calculated by first subtracting the background in each wavelength and calculating the ratio by dividing the intensity of the emission signals excited by 490nm/420nm.
To show that HyPer7-IMS indeed localizes to the IMS, we used a mitochondrial uncoupler test (Ermakova et al., 2014). As the matrix of energized mitochondria is more alkaline than the IMS due to constant proton export, we expect an acidification of the matrix upon addition of an uncoupler (CCCP) to the cells, i.e. HyPer7-mito fluorescence in the intensiometric observation mode would decrease. In contrast, the IMS has either the same pH as the cytosol due to the rapid proton exchange via the mitochondrial outer membrane or is slightly more acidic because of the proton gradient across the inner mitochondrial membrane. Therefore, the F500 fluorescence intensity of the HyPer7-IMS would not change or would increase upon the uncoupler addition. Indeed, HyPer7-IMS did not respond to CCCP, whereas HyPer7-mito demonstrated a slight decrease (Figure S4A), indicating proper localization of the probe in both cases.
H2O2 registration in polarized cells
NIH-3T3 cells were seeded in WillСo glass bottom dishes (WillCo Wells B.V., Netherlands) in DMEM containing 10% FBS without antibiotics at a density equivalent to 50% confluence. The next day cells were transfected with the HyPer7-LifeAct construct using the FuGene HD transfection reagent (Promega, USA). To reveal intracellular dynamics of actin and H2O2 during cell migration we used a Zeiss LSM780 (Zeiss, Germany) equipped with 63x/1.40 Plan-Apochromat oil immersion objective, an on-stage cell culture box, and humidifier life-time confocal microscope. During imaging, the cells were kept in full growth medium (DMEM supplemented with 10% FBS and 20mM HEPES without antibiotics). The time-lapse series were continuously acquired every 5 min over 5 h using the ‘Positions’ application in ZEN 2010 (Zeiss, Germany) to achieve simultaneous image acquisition in different fields of view. HyPer7 fluorescence was excited with a low-powered 30 mW 405 diode laser and 35 mW 488 nm Argon lasers and was detected in the 499–560 nm wavelength interval. The excitation intensities and gain were chosen manually to level the fluorescence intensity in both channels within the range of 80–150 out of a maximum of 256 units on the 8 bit grayscale. To minimize phototoxic effects, the least possible light intensity and a 625 mV gain on the detector were used. The time series were analyzed using free ImageJ software. The background was subtracted from 405- and 488-nm stacks (corresponding to two HyPer excitation peaks. Each 488-nm stack was divided by the corresponding 405-nm stack frame-by-frame. The resulting stack was depicted in pseudocolors using a “16-colors” lookup table. Protrusion activity was analyzed by making kymographs on the front and side edges of the cell. Routinely, 40–50 positions were tracked in every independent experiment.
Flow cytometry
For flow cytometry measurements, the next day after seeding (100,000 cells/mL), K562 cells cells were transfected with HyPer7 or HyPer3 (as well as the corresponding C121S mutants) expression vectors using the FuGene 6 (Promega, USA) reagent. Transfection mixtures were prepared according to the manufacturer’s instructions at a 3:1 ratio of FuGene to DNA. Experiments were performed 36–48 h after transfection.
To analyze the HyPer7 response to extracellular H2O2, transfected cells were resuspended in PBS and incubated for 30 min in standard growth conditions (37°C, 5% CO2) for adaptation to a new environment. After that, prewarmed H2O2 solution in PBS (100 μL, 0.2 – 10 μM) was added to the cell suspension aliquot (100 μL). Cells were incubated with H2O2 at standard growth conditions for 5 min and then analyzed with a flow cytometer (CytoFLEX, Beckman Coulter, USA; 405/488 nm laser).
To investigate the HyPer response to endogenous H2O2 production, cells transfected with HyPer vectors were exposed to 20 to 1000 μM of rotenone (an inhibitor of Complex I of the mitochondrial electron transport chain). Control cells were treated with an appropriate volume of vehicle (DMSO). Cells were incubated with rotenone at standard growth conditions for 30 min and then analyzed with a flow cytometer (CytoFLEX, Beckman Coulter, USA; 405/488 nm laser).
During flow cytometry analysis of the samples, cells were gated for HyPer expression (Lyublinskaya et al., 2017), and within this gate the λex=488 nm/ λem = 530 nm to λex=405 nm/ λem = 530 nm signal ratios multiplied by 100 (parameter denoted in the measurement protocol as HyPer ratio) was determined for each cell analyzed.
Danio rerio micro-injections, imaging and data quantification
100 ng/µL of HyPer7 or HyPer7-C121S mRNA were injected into one-cell stage embryos.
The larvae were anesthetized in tricaine solution and embedded in low-melting agarose (0.8%). Imaging were performed with a CSU-W1 Yokogawa spinning disk coupled to a Zeiss Axio observer Z1 inverted microscope equipped with a sCMOS Hamamatsu camera and a 25× (Zeiss 0.8 Imm WD: 0.19mm) oil objective. DPSS 100 mW 405 nm and 150 mW 491 nm lasers and a 525/50 bandpass excitation filter were used. Quantification was performed by measuring the signal at the amputation plane and normalizing it to the fluorescence mean on the uncut tails before amputation. A statistical two-way ANOVA test with Tukey’s multiple comparisons post-test was then performed.
QUANTIFICATION AND STATISTICAL ANALYSIS
Flow Cytometry Data Processing and Analysis
To assess the oxidation level of HyPer7 localized in different compartments of K562 cells upon the extracellular addition of H2O2, the cell suspension was split into two parts and placed into the experimental and control tubes. H2O2 solution in PBS was added to the experimental tube, whilst the same volume of pure PBS was added to the control cells. Upon incubation, both samples were analyzed with the flow cytometer, and the HyPer7 signal collected from the cells in the experimental tube was normalized to the signal measured in the control sample. This procedure was repeated 3 – 5 times (N) and the mean and SD values of the normalized HyPer signal were estimated for each H2O2 concentration added. An unpaired t-test was applied to estimate the significance of the results obtained, in which the HyPer signal was considered to be significantly changed after H2O2 addition in case of p < 0.05. In the experiments where endogenous production of H2O2 was stimulated with rotenone, a similar experimental protocol was used except that the same volume of the DMSO solution, used as a vehicle for rotenone, was added to the control tube. Number of samples: Figure 3A - at [H2O2] ≤ 0.2 μM N=5, at [H2O2] > 0.2 μM N=3, Figure 3G N=4.
HyPer7 in vitro characterization
Unless otherwise indicated, all experiments were carried out using biological triplicates, as indicated in the figure legends. Each replicate represents a separately reduced, quantified and buffer-exchanged protein sample prepared from the same purification batch. The results are presented as the ratio between the excitation maxima at 500 and 400 nm with emission at 520 nm, normalized to the untreated or vehicle-treated sample, depending on the experiment (see figure legends). The plotted data points and bars represent the mean and the error bars the standard deviation. No hypothesis test was used. All calculations were performed using GraphPad Prism version 7.0d.
HyPer7 ratio in polarized cells
Statistical analysis was performed using Sigma-Plot 12.0 software. Data was assessed for normality of distribution using the Kolmogorov-Smirnov test. Values are expressed as mean ± standard error of mean (s.e.m.). Comparison of two independent groups was performed using Student’s t-test for normally distributed data and the Mann–Whitney U-criteria (M-U test) for not normally distributed data. Multiple comparisons were made using the Kruskall-Wallis test with subsequent application of the Dann criteria. Statistical significance was defined as p < 0.05.
Supplementary Material
Supplemental video S1. H2O2 gradients in cell polarization: example #1, related to the Figure 4. NIH-3T3 cells transiently expressing HyPer7-LifeAct demonstrate spontaneous formation of protrusions. H2O2 gradients determine the stability of the protrusions. Addition of PEG-catalase (PEG-Cat) destroys the gradient and leads to the retraction of the protrusions
Supplemental video S2. H2O2 gradients in cell polarization: example #2, related to the Figure 4.
KEY RESOURCES TABLE
| REAGENT or RESOURCE | SOURCE | IDENTIFIER |
|---|---|---|
| Bacterial and Virus Strains | ||
| Escherichia coli, M15 strain | Qiagen | N/A |
| Chemicals, Peptides, and Recombinant Proteins | ||
| Isopropyl β-D-1-thiogalactopyranoside (IPTG) | Fisher Scientific | BP1755-10; CAS: 367-93-1 |
| Dithiothreitol (DTT) | Roche | 10708984001; CAS: 3483-12-3 |
| Leupeptin | Carl Roth | CN33.3; CAS: 103476-89-7 |
| 4-(2-aminoethyl)benzenesulfonyl fluoride hydrochloride (AESBF) | Carl Roth | 2931.3; CAS: 34284-75-8 |
| Benzamidine hydrochloride hydrate | Sigma-Aldrich | B6506; CAS: 206752-36-5 |
| DNAse I | Sigma-Aldrich | DN25; CAS: 9003-98-9 |
| Ni2+-Sepharose 6 Fast Flow | GE Healthcare | 17531802 |
| 4-(2-Hydroxyethyl)piperazine-1-ethanesulfonic acid (HEPES) | Sigma-Aldrich | H3375; CAS number: 7365-45-9 |
| Imidazole | Merck | 1.04716.1000; CAS: 288-32-4 |
| Tris(2-carboxyethyl)phosphine (TCEP) | Roth | HN951; CAS: 51805-45-9 |
| Diethylenetriaminepentaacetic acid (DTPA) | Sigma-Aldrich | 285560; CAS: 67-43-6 |
| Hydrogen peroxide (H2O2) | Sigma-Aldrich | 95321; CAS: 124-43-6 |
| tert-butyl hydroperoxide | Sigma-Aldrich | B2633; CAS Number 75-91-2 |
| cumene hydroperoxide | Sigma-Aldrich | 247502; CAS Number 80-15-9 |
| benzoyl hydroperoxide | Sigma-Aldrich | 228877; CAS Number 94-36- |
| 4-hydroperoxy-2-nonenal | Cayman Chemical | 10004413; CAS Number 7439-43-2 |
| Peroxynitrite (ONOO−) | Cayman Chemical | 81565; CAS: 14042-01-4 |
| Oxidized glutathione (GSSG) | Roche | 105635; CAS:103239-24-3 |
| Reduced glutathione (GSH) | Sigma-Aldrich | 64251; CAS: 70-18-8 |
| 6-(2-Hydroxy-1-methyl-2-nitrosohydrazino)-N-methyl-1-hexanamine (MAHMA NONOate) | Sigma-Aldrich | M1555; CAS: 146724-86-9 |
| Xanthine oxidase | Sigma-Aldrich | X4376; CAS: 9002-17-9 |
| Xanthine | Sigma-Aldrich | X0626; CAS: 69-89-6 |
| Catalase | Sigma-Aldrich | C9322; CAS: 9001-05-2 |
| D-alanine | Sigma-Aldrich | A7377 |
| Auranofin | Enzo | BML-EI206-0100 |
| Rotenone | Sigma-Aldrich | R8875 |
| PEG-catalase | Sigma-Aldrich | C4963 |
| PolyJet™ In Vitro DNA Transfection Reagent | Signagen Laboratories | SL100688 |
| Experimental Models: Cell Lines | ||
| NIH-3T3 fibroblasts | Collection of cell cultures of vertebrates, Institute of Cytology Russian Academy of Sciences, Russia, originally obtained from ATCC | RRID:CVCL_0594 ATCC CRL 1658 |
| HeLa-Kyoto | EMBL | RRID:CVCL_1922 |
| EA.hy926 | ATCC | CRL-2922 |
| K-562 | ATCC | CCL-243 |
| Experimental Models: Organisms/Strains | ||
| Zebrafish, Danio rerio, AB-Tu strain | ZFIN | https://zfin.org/action/genotype/view/ZDB-GENO-010924-10 |
| Oligonucleotides | ||
| 5’-attagctacaggatcccgggaattcgccaccatg-3’ Forward primer for HyPer7 cloning into PQE-30 | This paper | N/A |
| 5’-attggatcgaaagcttacagtcggcctcgagtca-3’ Reverse primer for HyPer7 cloning into PQE-30 | This paper | N/A |
| Recombinant DNA | ||
| pQE30-HyPer7 | This paper | N/A |
| pQE30-HyPer | (Belousov et al., 2006) | N/A |
| pQE30-HyPer3 | (Bilan et al. 2012); Addgene | https://www.addgene.org/42132/ |
| pC1-HyPerRed | Belousov lab, Addgene | https://www.addgene.org/48249/ |
| FusionRed-Lifeact-7 | Addgene | https://www.addgene.org/54778/RRID:Addgene_54778 |
| pC1-HyPer3-dmito | (Mishina et al., 2019) | N/A |
| pC1-HyPer2-IMS | (Ermakova et al.,2014) | N/A |
| pC1-HyPer2-NES | Belousov lab | pC1-HyPer2-NES |
| pC1-HyPer2-NES | Belousov lab | N/A |
| pC1-HyPer3 | Belousov lab, Addgene | https://www.addgene.org/42131/ |
| Software and Algorithms | ||
| Prism 7 | GraphPad Software | https://www.graphpad.com |
| FIJI | Fiji.sc | |
| MEGA software package | (Kumar et al., 2016) | https://www.megasoftware.net |
| MetaFluor® Imaging System | Molecular Devices,San Jose, California, United States | https://www.moleculardevices.com/sites/default/files/en/assets/brochures/dd/img/metafluorfluorescence-ratioimagingsoftware.pdf |
| iTOL(Interactive Tree of Life) | (Letunic and Bork, 2016) | https://itol.embl.de |
| Jalview | (Waterhouse et al., 2009) | http://www.jalview.org |
| CytExpert Software v2.0 | Beckman Coulter, USA | https://www.beckman.com/flowcytometry/instruments/cytoflex/software |
Highlights:
HyPer7 is an ultrasensitive, ultrafast, and pH-stable indicator for H2O2
Being controlled by the Trx system, H2O2 does not diffuse out from mitochondria
Intensity of the H2O2 gradient associates with the stability of cellular protrusions
H2O2 gradients can be visualized in wounded tissues with HyPer7
Context and Significance.
Hydrogen peroxide, H2O2, is not only disinfection reagent, but also an important molecule naturally occurring in living cells. It plays a role as a signaling molecule, and its excessive production leads to oxidative stress. Due to the high reactivity of H2O2, it is complicated to study its biological roles. Currently existing indicators are not sensitive enough and respond not only to H2O2 but also to pH changes. In this study, investigators in Moscow and their collaborators have developed an ultrasensitive H2O2 probe, HyPer7, which is resistant to pH. The tool allows the researchers to discover new details on H2O2 production and distribution in cells and tissues, and its roles in cell motility and mitochondrial functioning. HyPer7 is readily available for the study of H2O2 in physiology and pathology.
Acknowledgments
This work was supported by Russian Science Foundation grants 17–14-01086 to V.V.B and 19–14-00108 to O.G.L; DFG IRTG1816; grants from the National Institutes of Health (P30 DK057521 and R21 AG063073), and by a Brigham and Women’s Hospital Health and Technology Innovation Award to T.M.; by the Austrian science foundation grant FWF (J4113) to E.E; DFG SFB1190 and SFB1027 for I.B.; Vlaams Instituut voor Biotechnologie (VIB), the Strategic Research Programme (SRP34) of the VUB, and the Research Foundation-Flanders (Excellence of Science project no. 30829584) to J.M.; an IWT PhD fellowship (to B.P.); grant # 075–15-2019–1789 from the Ministry of Science and Higher Education of the Russian Federation to V.B.; Russian Foundation for Basic Research grant 19–315-80018 to P.A.T.-K. FusionRed-Lifeact-7 was a gift from Michael Davidson (Addgene plasmid #54778; http://n2t.net/addgene:54778; RRID:Addgene_54778)
Footnotes
Publisher's Disclaimer: This is a PDF file of an unedited manuscript that has been accepted for publication. As a service to our customers we are providing this early version of the manuscript. The manuscript will undergo copyediting, typesetting, and review of the resulting proof before it is published in its final form. Please note that during the production process errors may be discovered which could affect the content, and all legal disclaimers that apply to the journal pertain.
Declaration of Interests
The authors declare no competing financial interests.
DATA AND CODE AVAILABILITY
This study did not generate any unique datasets or code
References
- Arteel GE, and Sies H (2001). The biochemistry of selenium and the glutathione system. Environ. Toxicol. Pharmacol 10, 153–158. [DOI] [PubMed] [Google Scholar]
- Bae YS, Kang SW, Seo MS, Baines IC, Tckle E, Chock PB, and Rhee SG (1997). Epidermal growth factor (EGF)-induced generation of hydrogen peroxide. Role in EGF receptor-mediated tyrosine phosphorylation. J. Biol. Chem 272, 217–221. [PubMed] [Google Scholar]
- Bedard K, and Krause KH (2007). The NOX family of ROS-generating NADPH oxidases: physiology and pathophysiology. Physiol Rev 87, 245–313. [DOI] [PubMed] [Google Scholar]
- Belousov VV, Fradkov AF, Lukyanov KA, Staroverov DB, Shakhbazov KS, Terskikh AV, and Lukyanov S (2006). Genetically encoded fluorescent indicator for intracellular hydrogen peroxide. Nat Methods 3, 281–286. [DOI] [PubMed] [Google Scholar]
- Bertolotti M, Bestetti S, García-Manteiga JM, Medraño-Fernandez I, Dal Mas A, Malosio ML, and Sitia R (2013). Tyrosine kinase signal modulation: a matter of H2O2 membrane permeability? Antioxid. Redox Signal. 19, 1447–1451. [DOI] [PMC free article] [PubMed] [Google Scholar]
- Bilan DS, and Belousov VV (2015). HyPer Family Probes: State of the Art. Antioxid. Redox Signal 24, 731–751. [DOI] [PubMed] [Google Scholar]
- Bogdanova YA, Schultz C, and Belousov VV (2017). Local Generation and Imaging of Hydrogen Peroxide in Living Cells. Curr. Protoc. Chem. Biol 9, 117–127. [DOI] [PubMed] [Google Scholar]
- Bouzigues CI, Nguyên T-L, Ramodiharilafy R, Claeson A, Tharaux P-L, and Alexandrou A (2014). Regulation of the ROS Response Dynamics and Organization to PDGF Motile Stimuli Revealed by Single Nanoparticle Imaging. Chem. Biol 21, 647–656. [DOI] [PubMed] [Google Scholar]
- Brand MD (2010). The sites and topology of mitochondrial superoxide production. Exp. Gerontol 45, 466–472. [DOI] [PMC free article] [PubMed] [Google Scholar]
- Calamita G, Ferri D, Gena P, Liquori GE, Cavalier A, Thomas D, and Svelto M (2005). The inner mitochondrial membrane has aquaporin-8 water channels and is highly permeable to water. J. Biol. Chem 280, 17149–17153. [DOI] [PubMed] [Google Scholar]
- Cameron JM, Gabrielsen M, Chim YH, Munro J, McGhee EJ, Sumpton D, Eaton P, Anderson KI, Yin H, and Olson MF (2015). Polarized Cell Motility Induces Hydrogen Peroxide to Inhibit Cofilin via Cysteine Oxidation. Curr. Biol 25, 1520–1525. [DOI] [PMC free article] [PubMed] [Google Scholar]
- Chance B, Sies H, and Boveris A (1979). Hydroperoxide metabolism in mammalian organs. Physiol. Rev 59, 527–605. [DOI] [PubMed] [Google Scholar]
- Choi H, Kim S, Mukhopadhyay P, Cho S, Woo J, Storz G, and Ryu S (2001). Structural basis of the redox switch in the OxyR transcription factor. Cell 105, 103–113. [DOI] [PubMed] [Google Scholar]
- Collet J-F, and Messens J (2010). Structure, function, and mechanism of thioredoxin proteins. Antioxid. Redox Signal 13, 1205–1216. [DOI] [PubMed] [Google Scholar]
- Droge W (2002). Free radicals in the physiological control of cell function. Physiol Rev 82, 47–95. [DOI] [PubMed] [Google Scholar]
- Du C, Fang M, Li Y, Li L, and Wang X (2000). Smac, a mitochondrial protein that promotes cytochrome c-dependent caspase activation by eliminating IAP inhibition. Cell 102, 33–42. [DOI] [PubMed] [Google Scholar]
- Edmondson DE, and Binda C (2018). Monoamine Oxidases. (Springer; ), pp. 117–139. [DOI] [PubMed] [Google Scholar]
- Ermakova YG, Bilan DS, Matlashov ME, Mishina NM, Markvicheva KN, Subach OM, Subach FV, Bogeski I, Hoth M, Enikolopov G, et al. (2014). Red fluorescent genetically encoded indicator for intracellular hydrogen peroxide. Nat. Commun 5, 5222. [DOI] [PMC free article] [PubMed] [Google Scholar]
- Ermakova YG, Pak VV, Bogdanova YA, Kotlobay AA, Yampolsky IV, Shokhina AG, Panova AS, Marygin RA, Staroverov DB, Bilan DS, et al. (2018). SypHer3s: A genetically encoded fluorescent ratiometric probe with enhanced brightness and an improved dynamic range. Chem. Commun 54. [DOI] [PubMed] [Google Scholar]
- Ezeriņa D, Takano Y, Hanaoka K, Urano Y, and Dick TP (2018). N-Acetyl Cysteine Functions as a Fast-Acting Antioxidant by Triggering Intracellular H 2 S and Sulfane Sulfur Production. Cell Chem. Biol 25, 447–459.e4. [DOI] [PMC free article] [PubMed] [Google Scholar]
- Fazakerley DJ, Minard AY, Krycer JR, Thomas KC, Stöckli J, Harney DJ, Burchfield JG, Maghzal GJ, Caldwell ST, Hartley RC, et al. (2018). Mitochondrial oxidative stress causes insulin resistance without disrupting oxidative phosphorylation. J. Biol. Chem 293, 7315–7328. [DOI] [PMC free article] [PubMed] [Google Scholar]
- Fomenko DE, Xing W, Adair BM, Thomas DJ, and Gladyshev VN (2007). High-throughput identification of catalytic redox-active cysteine residues. Science 315, 387–389. [DOI] [PubMed] [Google Scholar]
- Forkink M, Basit F, Teixeira J, Swarts HG, Koopman WJH, and Willems PHGM (2015). Complex I and complex III inhibition specifically increase cytosolic hydrogen peroxide levels without inducing oxidative stress in HEK293 cells. Redox Biol. 6, 607–616. [DOI] [PMC free article] [PubMed] [Google Scholar]
- Gutscher M, Sobotta MC, Wabnitz GH, Ballikaya S, Meyer AJ, Samstag Y, and Dick TP (2009). Proximity-based protein thiol oxidation by H2O2-scavenging peroxidases. J Biol Chem 284, 31532–31540. [DOI] [PMC free article] [PubMed] [Google Scholar]
- Hinchy EC, Gruszczyk AV, Willows R, Navaratnam N, Hall AR, Bates G, Bright TP, Krieg T, Carling D, and Murphy MP (2018). Mitochondria-derived ROS activate AMP-activated protein kinase (AMPK) indirectly. J. Biol. Chem 293, 17208–17217. [DOI] [PMC free article] [PubMed] [Google Scholar]
- Ho SN, Hunt HD, Horton RM, Pullen JK, and Pease LR (1989). Site-directed mutagenesis by overlap extension using the polymerase chain reaction. Gene 77, 51–59. [DOI] [PubMed] [Google Scholar]
- Hu J, Dong L, and Outten CE (2008). The Redox Environment in the Mitochondrial Intermembrane Space Is Maintained Separately from the Cytosol and Matrix. J. Biol. Chem 283, 29126–29134. [DOI] [PMC free article] [PubMed] [Google Scholar]
- Huang BK, and Sikes HD (2014). Quantifying intracellular hydrogen peroxide perturbations in terms of concentration. Redox Biol 2, 955–962. [DOI] [PMC free article] [PubMed] [Google Scholar]
- Jones DT, Taylor WR, and Thornton JM (1992). The rapid generation of mutation data matrices from protein sequences. Comput. Appl. Biosci 8, 275–282. [DOI] [PubMed] [Google Scholar]
- Kil IS, Lee SK, Ryu KW, Woo HA, Hu M-C, Bae SH, and Rhee SG (2012). Feedback control of adrenal steroidogenesis via H2O2-dependent, reversible inactivation of peroxiredoxin III in mitochondria. Mol. Cell 46, 584–594. [DOI] [PubMed] [Google Scholar]
- King LS, Kozono D, and Agre P (2004). From structure to disease: The evolving tale of aquaporin biology. Nat. Rev. Mol. Cell Biol 5, 687–698. [DOI] [PubMed] [Google Scholar]
- Kumar S, Stecher G, and Tamura K (2016). MEGA7: Molecular Evolutionary Genetics Analysis Version 7.0 for Bigger Datasets. Mol. Biol. Evol 33, 1870–1874. [DOI] [PMC free article] [PubMed] [Google Scholar]
- Langford TF, Huang BK, Lim JB, Moon SJ, and Sikes HD (2018). Monitoring the action of redox-directed cancer therapeutics using a human peroxiredoxin-2-based probe. Nat. Commun 9, 3145. [DOI] [PMC free article] [PubMed] [Google Scholar]
- Lee WK, and Thévenod F (2006). A role for mitochondrial aquaporins in cellular life-and-death decisions? Am. J. Physiol. - Cell Physiol 291. [DOI] [PubMed] [Google Scholar]
- Lee SR, Kwon KS, Kim SR, and Rhee SG (1998). Reversible inactivation of protein-tyrosine phosphatase 1B in A431 cells stimulated with epidermal growth factor. J Biol Chem 273, 15366–15372. [DOI] [PubMed] [Google Scholar]
- Letunic I, and Bork P (2016). Interactive tree of life (iTOL) v3: an online tool for the display and annotation of phylogenetic and other trees. Nucleic Acids Res 44, W242–5. [DOI] [PMC free article] [PubMed] [Google Scholar]
- Love NR, Chen Y, Ishibashi S, Kritsiligkou P, Lea R, Koh Y, Gallop JL, Dorey K, and Amaya E (2013). Amputation-induced reactive oxygen species are required for successful Xenopus tadpole tail regeneration. Nat. Cell Biol 15, 222–228. [DOI] [PMC free article] [PubMed] [Google Scholar]
- Lu J, and Holmgren A (2014). The thioredoxin antioxidant system. Free Radic. Biol. Med 66, 75–87. [DOI] [PubMed] [Google Scholar]
- Lyublinskaya O, and Antunes F (2019). Measuring intracellular concentration of hydrogen peroxide with the use of genetically encoded H2O2 biosensor HyPer. Redox Biol 24, 101200. [DOI] [PMC free article] [PubMed] [Google Scholar]
- Lyublinskaya OG, Ivanova JS, Pugovkina NA, Kozhukharova IV, Kovaleva ZV, Shatrova AN, Aksenov ND, Zenin VV, Kaulin YA, Gamaley IA, et al. (2017). Redox environment in stem and differentiated cells: A quantitative approach. Redox Biol 12, 758–769. [DOI] [PMC free article] [PubMed] [Google Scholar]
- Malinouski M, Zhou Y, Belousov VV, Hatfield DL, and Gladyshev VN (2011). Hydrogen peroxide probes directed to different cellular compartments. PLoS One 6, e14564. [DOI] [PMC free article] [PubMed] [Google Scholar]
- Matlashov MEME, Bogdanova YAYA, Ermakova GVGV, Mishina NMNM, Ermakova YGYG, Nikitin ESES, Balaban PMPM, Okabe S, Lukyanov S, Enikolopov G, et al. (2015). Fluorescent ratiometric pH indicator SypHer2: Applications in neuroscience and regenerative biology. Biochim. Biophys. Acta - Gen. Subj 1850, 2318–2328. [DOI] [PMC free article] [PubMed] [Google Scholar]
- Meda F, Gauron C, Rampon C, Teillon J, Volovitch M, and Vriz S (2016). Nerves Control Redox Levels in Mature Tissues Through Schwann Cells and Hedgehog Signaling. Antioxid. Redox Signal 24, 299–311. [DOI] [PMC free article] [PubMed] [Google Scholar]
- Miller EW, Dickinson BC, and Chang CJ (2010). Aquaporin-3 mediates hydrogen peroxide uptake to regulate downstream intracellular signaling. Proc. Natl. Acad. Sci 107, 15681–15686. [DOI] [PMC free article] [PubMed] [Google Scholar]
- Mishina NM, Bogdanova YA, Ermakova YG, Panova AS, Kotova DA, Bilan DS, Steinhorn B, Arnér ESJ, Michel T, and Belousov VV (2019). Which Antioxidant System Shapes Intracellular H 2 O 2 Gradients? Antioxid. Redox Signal ars.2018.7697. [DOI] [PMC free article] [PubMed]
- Morgan B, Van Laer K, Owusu TNE, Ezeriņa D, Pastor-Flores D, Amponsah PS, Tursch A, and Dick TP (2016). Real-time monitoring of basal H2O2 levels with peroxiredoxin-based probes. Nat. Chem. Biol 12, 437–443. [DOI] [PubMed] [Google Scholar]
- Murphy MP (2009). How mitochondria produce reactive oxygen species. Biochem. J 417, 1–13. [DOI] [PMC free article] [PubMed] [Google Scholar]
- Nakashima K, Wada M, Kuroda N, Akiyama S, and Imai K (1994). High-performance liquid chromatographic determination of hydrogen peroxide with peroxyoxalate chemiluminescence detection. J. Liq. Chromatogr 17, 2111–2126. [Google Scholar]
- Niethammer P, Grabher C, Look AT, and Mitchison TJ (2009). A tissue-scale gradient of hydrogen peroxide mediates rapid wound detection in zebrafish. Nature 459, 996–999. [DOI] [PMC free article] [PubMed] [Google Scholar]
- Oshino N, Chance B, Sies H, and Bücher T (1973). The role of H2O2 generation in perfused rat liver and the reaction of catalase compound I and hydrogen donors. Arch. Biochem. Biophys 154, 117–131. [DOI] [PubMed] [Google Scholar]
- Poburko D, Santo-Domingo J, and Demaurex N (2011). Dynamic regulation of the mitochondrial proton gradient during cytosolic calcium elevations. J Biol Chem 286, 11672–11684. [DOI] [PMC free article] [PubMed] [Google Scholar]
- Riedl J, Crevenna AH, Kessenbrock K, Yu JH, Neukirchen D, Bista M, Bradke F, Jenne D, Holak TA, Werb Z, et al. (2008). Lifeact: a versatile marker to visualize F-actin. Nat. Methods 5, 605–607. [DOI] [PMC free article] [PubMed] [Google Scholar]
- Sakai J, Li J, Subramanian KK, Mondal S, Bajrami B, Hattori H, Jia Y, Dickinson BC, Zhong J, Ye K, et al. (2012). Reactive Oxygen Species-Induced Actin Glutathionylation Controls Actin Dynamics in Neutrophils. Immunity 37, 1037–1049. [DOI] [PMC free article] [PubMed] [Google Scholar]
- Sies H, Berndt C, and Jones DP (2017). Oxidative Stress. Annu. Rev. Biochem 86, 715–748. [DOI] [PubMed] [Google Scholar]
- Soria LR, Fanelli E, Altamura N, Svelto M, Marinelli RA, and Calamita G (2010). Aquaporin-8-facilitated mitochondrial ammonia transport. Biochem. Biophys. Res. Commun 393, 217–221. [DOI] [PubMed] [Google Scholar]
- Stein KT, Moon SJ, and Sikes HD (2018). Mitochondrial H 2 O 2 Generation Using a Tunable Chemogenetic Tool To Perturb Redox Homeostasis in Human Cells and Induce Cell Death. ACS Synth. Biol 7, 2037–2044. [DOI] [PubMed] [Google Scholar]
- Steinhorn B, Sorrentino A, Badole S, Bogdanova Y, Belousov V, and Michel T (2018).Chemogenetic generation of hydrogen peroxide in the heart induces severe cardiac dysfunction. Nat. Commun 9, 4044. [DOI] [PMC free article] [PubMed] [Google Scholar]
- Sundaresan M, Yu ZX, Ferrans VJ, Irani K, and Finkel T (1995). Requirement for generation of H2O2 for platelet-derived growth factor signal transduction. Science 270, 296–299. [DOI] [PubMed] [Google Scholar]
- Turrens JF, and Boveris A (1980). Generation of superoxide anion by the NADH dehydrogenase of bovine heart mitochondria. Biochem. J 191, 421–427. [DOI] [PMC free article] [PubMed] [Google Scholar]
- Wach F, Hein R, Adelmann-Grill BC, and Krieg T (1987). Inhibition of fibroblast chemotaxis by superoxide dismutase. Eur. J. Cell Biol 44, 124–127. [PubMed] [Google Scholar]
- Wang YL (1984). Reorganization of actin filament bundles in living fibroblasts. J. Cell Biol 99, 1478–1485. [DOI] [PMC free article] [PubMed] [Google Scholar]
- Waterhouse AM, Procter JB, Martin DMA, Clamp M, and Barton GJ (2009). Jalview Version 2--a multiple sequence alignment editor and analysis workbench. Bioinformatics 25, 1189–1191. [DOI] [PMC free article] [PubMed] [Google Scholar]
- Winterbourn CC (2008). Reconciling the chemistry and biology of reactive oxygen species. Nat Chem Biol 4, 278–286. [DOI] [PubMed] [Google Scholar]
- Yang B, Zhao D, and Verkman AS (2006). Evidence against functionally significant aquaporin expression in mitochondria. J. Biol. Chem 281, 16202–16206. [DOI] [PubMed] [Google Scholar]
- Yang J, Carroll KS, and Liebler DC (2016). The Expanding Landscape of the Thiol Redox Proteome. Mol. Cell. Proteomics 15, 1–11. [DOI] [PMC free article] [PubMed] [Google Scholar]
Associated Data
This section collects any data citations, data availability statements, or supplementary materials included in this article.
Supplementary Materials
Supplemental video S1. H2O2 gradients in cell polarization: example #1, related to the Figure 4. NIH-3T3 cells transiently expressing HyPer7-LifeAct demonstrate spontaneous formation of protrusions. H2O2 gradients determine the stability of the protrusions. Addition of PEG-catalase (PEG-Cat) destroys the gradient and leads to the retraction of the protrusions
Supplemental video S2. H2O2 gradients in cell polarization: example #2, related to the Figure 4.