Abstract
The multimodal lateral cortex of the inferior colliculus (LCIC) exhibits a modular-extramodular micro-organization that is evident early in development. In addition to a set of neurochemical markers that reliably highlight its modular-extramodular organization (e.g. modules: GAD67-positive, extramodular zones: calretinin-positive, CR), mature projection patterns suggest that major LCIC afferents recognize and adhere to such a framework. In adult mice, distinct afferent projections appear segregated, with somatosensory inputs targeting LCIC modules and auditory inputs surrounding extramodular fields. Currently lacking is an understanding regarding the development and shaping of multimodal LCIC afferents with respect to its emerging modular-extramodular microarchitecture. Combining living slice tract-tracing and immunocytochemical approaches in GAD67-GFP knock-in mice, the present study characterizes the critical period of projection shaping for LCIC auditory afferents arising from its neighboring central nucleus (CNIC). Both crossed and uncrossed projection patterns exhibit LCIC extramodular mapping characteristics that emerge from initially diffuse distributions. Projection mismatch with GAD-defined modules and alignment with encompassing extramodular zones becomes increasingly clear over the early postnatal period (birth to postnatal day 12). CNIC inputs terminate almost exclusively in extramodular zones that express CR. These findings suggest multimodal LCIC inputs may initially be sparse and intermingle, prior to segregation into distinct processing streams. Future experiments are needed to determine the likely complex interactions and mechanisms (e.g. activity-dependent and independent) responsible for shaping early modality-specific LCIC circuits.
Keywords: multimodal, topography, mapping, modularity, patch-matrix, compartments, immunocytochemistry
Introduction
A common organizational feature of the nervous system is the use of neural maps to provide an orderly arrangement of complex connections (Luo and Flanagan, 2007). Continuous or topographic maps preserve nearest neighbor relationships or the spatial ordering of inputs between source and target (e.g. retinotopy or tonotopy in visual and auditory systems, respectively), whereas discrete maps provide a means for segregating converging inputs of different types into separate information streams or target domains (e.g. olfactory glomeruli or striosome/matrix striatal compartments). The midbrain inferior colliculus (IC) provides a model system for examining both map types within a given brain structure, as its central nucleus (CNIC) exhibits a frequency continuum, in contrast to the discontinuous, compartmental organization of its neighboring lateral cortex (LCIC). CNIC afferents from a variety of auditory brainstem nuclei form orderly arrays of frequency-specific axonal layers during an early critical period (Fathke and Gabriele, 2009) that appear to be instructed in part by molecular gradients (Gabriele et al., 2011; Wallace et al., 2013; Cramer and Gabriele, 2014; Wallace et al., 2016) and relative levels of cochlear generated spontaneous activity (Gabriele et al., 2000; Tritsch et al., 2007; Tritsch and Bergles, 2010). Considerably less is known, however, concerning the mapping and shaping of discrete LCIC multimodal inputs onto its modular-extramodular framework (Chernock et al., 2004; Dillingham et al., 2017; Gay et al; 2018).
Embedded within the seemingly laminar LCIC (layers 1–3, superficial to deep) is a neurochemically defined compartmental micro-organization. A series of intermittent patchy domains, or modules, spanning LCIC layer 2 have been described previously in rodents (Chernock et al., 2004, Stebbings et al., 2014; Lesicko et al., 2016; Dillingham et al., 2017; Gay et al., 2018), suggesting such a modularity may be of importance for LCIC integrative processing. GAD67 (glutamic acid decarboxylase-67) is one of a host of neurochemical and metabolic markers that reliably labels LCIC modular zones. Tracing studies paired with GAD67 immunostaining in adult mice suggest ascending and descending projection patterns target discrete aspects of the LCIC modular-extramodular framework based on modality (Lesicko et al., 2016). Somatosensory inputs appear to overlap GAD-defined modules, while inputs of auditory origin target surrounding presumptive extramodular zones. To date, nothing is known concerning the development or critical period for shaping multimodal projection patterns in the nascent LCIC.
The present study examines the development of auditory inputs to the LCIC arising from the neighboring CNIC with respect to its emerging modular-extramodular framework. Recent work from our laboratory characterized the emergence of LCIC modular fields, as well as identifying calretinin (CR) as a reliable marker of extramodular zones (Dillingham et al., 2017; Gay et al., 2018). While not readily apparent at birth, LCIC compartments take shape over the first postnatal week and are well defined by postnatal day 12 (P12). Here, a combination of tract-tracing approaches in neonatal fixed tissue and living slice preparations document the developmental progression of bilateral CNIC inputs to the LCIC. Tracings in living explants was pursued and ultimately utilized as they alleviate major shortcomings associated with more conventional approaches in fixed tissue preparations (e.g. lipophilic dyes), namely poor fiber resolution after myelination and incompatibility with immunocytochemical methods. Culminating experiments coupling CR immunocytochemistry in GAD67-GFP mice show labeled afferents arising from the CNIC exhibit an early projection specificity in keeping with discrete mapping, reliably targeting LCIC extramodular domains. Mechanisms that may influence the development and mapping of multimodal systems to distinct LCIC compartments are discussed.
Materials and Methods
Animals
Experiments were performed on C57BL/6J control mice (total n = 8; P8, n = 5; P12, n = 3) Jackson Laboratories, Bar Harbour, ME) and GAD67-GFP mice (total n = 30; P0, n = 8; P6, n = 9; P12 = 13) from birth to postnatal day 12 (P12); spanning the critical period for emerging LCIC compartments (Dillingham et al., 2017). A nearly equivalent number of males and females were examined and no gender related differences were observed. Generation of the GAD67-GFP (Δ neo) line (C57BL/6J background) in which a cDNA-encoding enhanced GFP was inserted into the GAD67 locus is described in detail elsewhere (Tamamaki et al., 2003; permission granted by Dr. Yuchio Yanagawa, Gunma University Graduate School of Medicine, Gunma Japan), and enables easy visualization of inhibitory, GABAergic neurons. C57BL/6J mice were utilized in initial fixed tissue tract-tracing experiments, living slice preparation pilots, and controls determining antibody specificity and optimal working dilutions. Experiments directly comparing projection pattern refinement with respect to the developing LCIC microarchitecture were performed in the GAD67-GFP line. Results are representative of at least three mice (usually n > 3) at each of the developmental stages for each study. Experimentation was always carried out in accordance with the National Institutes of Health Guide for the Care and Use of Laboratory Animals (NIH publications No.80–23, revised 1996) and received approval by the Institutional Animal Care and Use Committee at James Madison University (Gabriele IACUC Protocol No. A18–15).
Fixed tissue tract-tracing
Tract-tracing experiments were initially performed in fixed C57BL/6J tissue blocks to determine the time course for the emergence of CNIC to LCIC projection patterns (for detailed procedures see Wallace et al., 2013). Briefly, mice were given an overdose of ketamine (200 mg/kg) and xylazine (20 mg/kg) and perfused transcardially with physiological rinse followed by 4% paraformaldehyde fixative solution. Brains were post-fixed in paraformaldehyde prior to embedding and sectioning on a vibratome. Coronal sections were taken at 75μm from rostral-to-caudal through the superior colliculus (SC) and intercollicular zone until the rostral extreme of the CNIC was visualized. Tissue blocks were then placed under a dissecting scope to visualize placement of NeuroVue Red dye-soaked filter paper (24835–1, Polysciences Inc., Warrington, PA) into a small incision made in the CNIC. Placements at later ages were slightly larger to ensure sufficient filling of the CNIC, but not so large to allow spreading into neighboring subdivisions. Following dye placement, remaining tissue blocks were kept in fixative in the dark at 37°C for two weeks. After this period allowing for adequate diffusion of the dye, serial sections of the remaining tissue block including aspects from the rostral IC through the caudal extent of the cochlear nucleus complex were mounted and coverslipped with Pro Long Diamond (P36970, Thermo Fisher Scientific, Waltham, MA). Slides were subsequently sealed with Cytoseal 60 (8310–4, Thermo Fisher Scientific) and stored in the dark at −20°C.
Living slice tract-tracing
Alternative anterograde tracing approaches in living slice preparations were developed to solve shortcomings encountered with the NeuroVue dyes, namely the fact that the clarity and resolution of their labeling of cellular detail declines rapidly as pathways myelinate, as well as their incompatibility with immunocytochemical protocols. To instill optimal conditions for maintaining tissue viability in vitro, mice were perfused with chilled, oxygenated (95% O2, 5% CO2) artificial cerebrospinal fluid (aCSF, in mM; 126 NaCl, 3 KCl, 1.25 NaH2PO4, 10 dextrose, 20 NaHCO3, 1.2 MgSO4, 2.5 CaCl2, pH 7.4). Brains were immediately harvested and blocked coronally just rostral to the SC and at the caudal brainstem. The SC was grossly removed with fine tweezers under a dissecting microscope until the rostral IC was visualized. Biocytin crystals (B1758, Sigma-Aldrich, Burlington, MA) of different sizes were chosen to maximally fill the CNIC at the different stages. Following crystal insertion into a small CNIC incision, the tissue block was bubbled in aCSF at room temperature for 18–20 hours to facilitate transport. Tissue was subsequently post-fixed at 4 °C in 4% paraformaldehyde, followed by the same fixative with increasing grades of sucrose up to 30% (pH 7.4). Coronal sections were taken at 50μm on a sliding freezing microtome and collected in PBS. Free-floating sections were rinsed three times in PBS for 5 min prior to further processing for biocytin visualization and in some cases calretinin immunocytochemistry as described below.
Fluorescence tissue processing
Calretinin staining in GAD67-GFP tissue using a biotinylated-streptavidin amplification was performed at three early postnatal stages (P0, P6, and P12) to document the emergence of LCIC compartments (GAD modules and CR extramodular zones). Following initial PBS rinses, tissue was blocked in 5% normal horse serum (NHS) in PBS for 30 min. Sections were then incubated in primary antibody in 1% NHS (anti-CR, made in rabbit, 1:250, CR 7697, Swant, RRID: AB_2619710) at 4 °C for 48hrs. After returning to room temperature, tissue was again rinsed in PBS before application of secondary antibody for 1 hr (1:600, biotinylated horse anti-rabbit IgG, BA-1100, Vector Laboratories, RRID:AB_2336201). Following another series of PBS rinses, sections were placed in an AlexaFluor 350 streptavidin solution (1:200, S11249, Thermo Fisher Scientific) for 2 hrs. Tissue underwent a final round of PBS rinses prior to mounting sections on charged slides (12–550-15, Fisher Scientific) and coverslipping with ProLong Diamond (P36970, Thermo Fisher Scientific).
To visualize biocytin labeling in living slice tracing experiments, sections were rinsed in PBS three times for 10 min and then agitated for 2.5 hours in Dylight 549 streptavidin (1:200, SA-5549, Vector Laboratories, RRID:AB_2336408). For CR extramodular staining in biocytin-labeled tissue, procedures similar to those described above were followed, except a directly conjugated secondary antibody was used instead of a biotinylated-streptavidin detection system. While the primary antibody and dilution remain unchanged, the blocking step and primary were made in normal donkey serum as an Alexa Fluor 350 donkey anti-rabbit IgG was utilized (1:25, A10039, Thermo Fisher Scientific, RRID:AB_2534015).
Image acquisition and LCIC sampling
Wide-field fluorescence image capturing was performed on a Nikon TE 2000 microscope (Nikon, Melville, NY) using a monochrome, Hamamatsu ORCA-Flash 4.0 V3 sCMOS camera (Hamamatsu, Bridgewater, NJ). Specific filter sets (Chroma Technology, Bellows Falls, VT) were designed for unequivocal separation of the three markers. Three-dimensional Z-stacks were acquired for each channel, pseudocolored (green: GAD, red: biocytin, blue: CR), and flattened using an extended depth of field (EDF) deconvolution algorithm (Elements Software; Nikon). The EDF module generates a two-dimensional image from Z-stacks using only regions of focus for each optical slice. CNIC tracer deposits were verified based on comparable rostrocaudal levels of age-matched coronal sections using The Atlas of the Developing Mouse Brain (Paxinos et al., 2007). Furthermore, the presence of retrogradely-labeled cells in frequency-specific regions matching that of the CNIC tracer placement was confirmed in downstream nuclei known to send robust projections to the CNIC (e.g. lateral lemniscal nuclei, superior olivary complex, and cochlear nuclei). LCIC layers were determined based upon GAD-GFP rich regions spanning layer 2.
Uncompressed TIFF images of separated channels were imported into ImageJ software (NIH, Bethesda, MD) to generate raw data for brightness plot profiles of respective labeling. Imported images from the mid-rostrocaudal third of the LCIC where modular-extramodular patterning is most apparent were converted to grayscale and the threshold function was used to accentuate compartmental boundaries. Markers were placed to denote modular confines prior to reverting back to the raw image. To assess the periodicity and spatial registry of discontinuous LCIC patterns, a freehand tool was used to sample ventral-to-dorsal along a curved contour bisecting defined layer 2 modules. A line thickness was specified in each case (values varied slightly with developmental stage, ranging from an ImageJ-defined thickness of 75 at birth up to 200 at P12) to optimize sampling of the full modular extent. The region of interest (ROI) function was used to ensure consistent sampling in separate channels for any given section. Raw data for each of the channels were plotted to generate brightness profiles highlighting relative signal fluctuations with respect to one another. Raw signal values were shifted and scaled to facilitate relative brightness comparisons between channels. Discrete ipsilateral and contralateral projection patterns at P12 that appeared consistently out of phase with GAD-defined modular labeling were highly suggestive of complementary patterns, and thus the impetus for further experimentation at this time point confirming projection alignment with CR-defined extramodular zones.
Autocorrelation analyses determined periodicity strength of emerging patterns within individual signals at each of the ages, while cross-correlation analyses assessed relative overlap or offset between selected signal pairs. Raw brightness profile data was imported into Microsoft Excel (Redmond, WA) and the CORREL function was used to compute auto- and cross-correlations. Full methods are described elsewhere in detail (Gay et al., 2018). In brief, signals with high autocorrelation peak values off the origin have a strong periodic component (Peak at +1.0 ⇒ perfect aligned periodicity. Trough at −1.0 ⇒ perfect out-of-phase periodicity. No discernible peaks implies no detectable periodicity). Prominent cross-correlation extrema indicate strong signal pattern matching (+1.0 implies perfect signal overlap or pattern alignment; −1.0 indicates perfect opposite signal variations or complementary patterns). A minimum of four sections from multiple mice were analyzed at each of the ages. Statistical comparisons of signal quantification were made using independent, two-tailed Student’s t-tests with statistical significance (p < 0.05).
Results
Identification of critical period for CNIC to LCIC projection shaping
Prior to characterizing the development and registry of CNIC inputs with respect to LCIC compartments, pilot tracing studies were performed to ascertain if the peak period for afferent shaping coincided with the known time course for emerging modular-extramodular zones. Initial tracing experiments were performed in fixed tissue preparations of early postnatal C57BL/6J mice, utilizing the lipophilic carbocyanine dye NeuroVue Red. Resultant labeling from CNIC placements revealed pioneer fibers occupying the ipsilateral and contralateral LCIC at birth, with extramodular projection distributions becoming apparent by P8 (Fig. 1a, ipsilateral shown). LCIC inputs at this age are concentrated in layers 1 and 3, and largely avoid patchy domains that are in keeping with the size and position of previously described modular fields (Fig 1a, dashed contours). Despite elaborate fills and crisp labeling at the earliest postnatal timepoints with this fixed tissue labeling, visualization of projection patterns at later stages as myelination of IC afferents progresses were severely compromised with this approach. Furthermore, multiple attempts at combining carbocyanine tract-tracing with immunocytochemistry protocols in the same tissue were unsuccessful. Thus, an in vitro living preparation was developed to provide a means for characterizing developing projection patterns at later developmental stages, in concert with established markers highlighting emerging LCIC modular-extramodular fields. CNIC placements of biocytin in vitro in living tissue slices yielded anterograde results similar to NeuroVue Red labeling at early ages, yet remained equally effective at later developmental stages (Fig. 1b), as well as when coupled with additional immunocytochemical staining (see Figs. 8–10).
Fig 1.
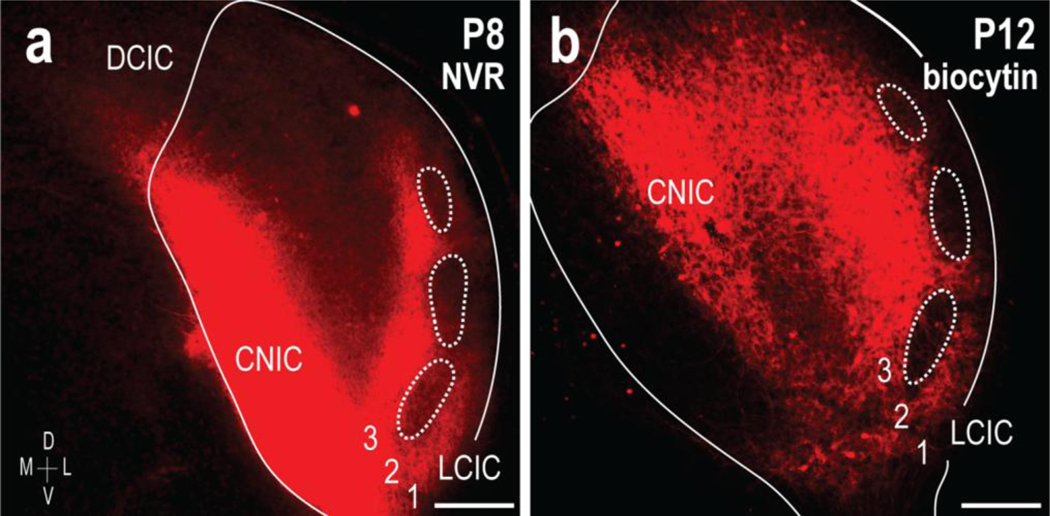
Anterograde tracing approaches in early postnatal mouse IC. Placement of NeuroVue Red dye-soaked filter paper in the CNIC labels projections to the LCIC (a, right IC, ipsilateral input shown). Inputs preferentially target presumptive extramodular zones by P8, terminating throughout layers 1 and 3, as well as intermodular areas of layer 2. Similar CNIC placements of biocytin in living slice preparations yield comparable results, with extramodular projection patterns that avoid LCIC layer 2 patches (b, dashed contours). Unlike pilot lipophilic dye tracings in fixed tissue, this approach facilitates better visualization at later developmental stages after myelination (P12 shown in b), as well as being compatible with subsequent immunostaining protocols (see Figs. 8–10). Scale bars = 200 μm
Fig 8.
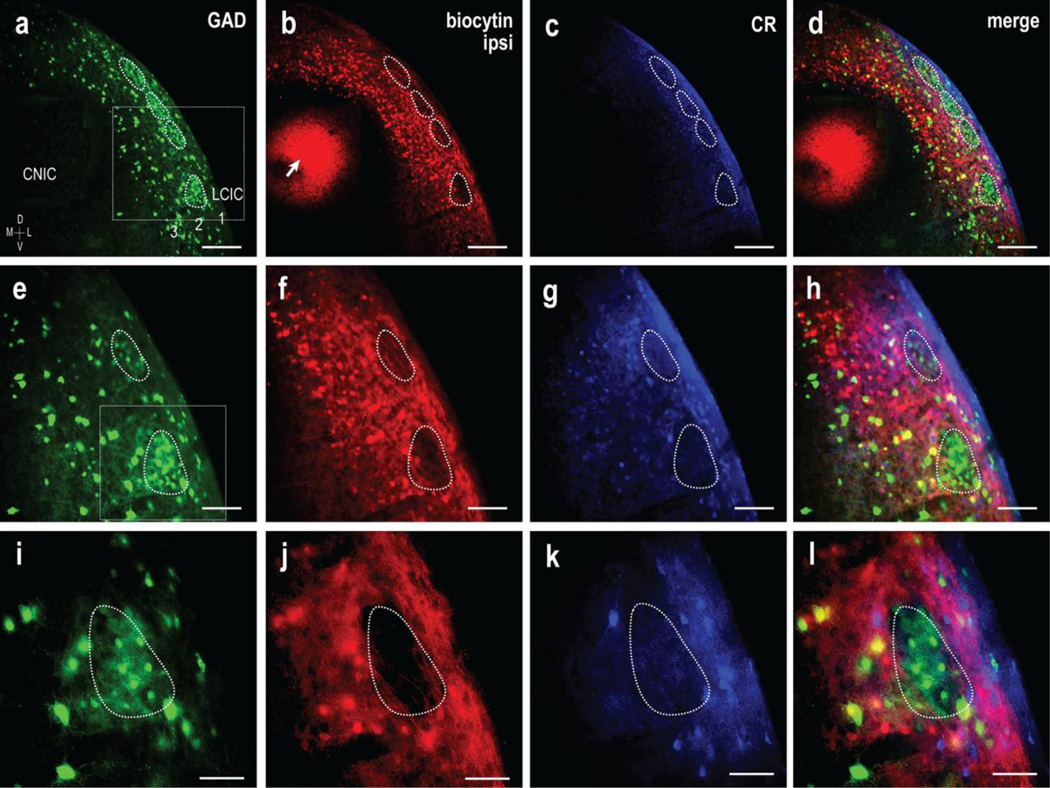
CNIC targeting of ipsilateral LCIC extramodular domains in a P12 GAD67-GFP mouse. Magnification series of separate channels (GAD = green, biocytin = red, CR =blue) and corresponding digital merges. Inset boxes in (a, e) are shown at higher magnification in (e-h) and (i-l) respectively. A series of GAD modules are evident at low magnification (a, dashed contours) that appear complementary to ipsilateral terminal labeling as well as calretinin expression (a-d). Overlap of the ipsilateral input with CR-defined extramodular regions and offset from GAD modules is shown at higher magnifications (e-h and i-l). Retrogradely labeled cell bodies were frequently observed in deep aspects of the LCIC, which is keeping with recent studies of intracollicular connections in gerbil that provide evidence of bilateral LCIC projection components to the CNIC. CNIC biocytin placement in (b, arrow). Scale bars in (a-d) = 200 μm, (e-h) = 100 μm, and (i-l) = 50 μm
Fig 10.
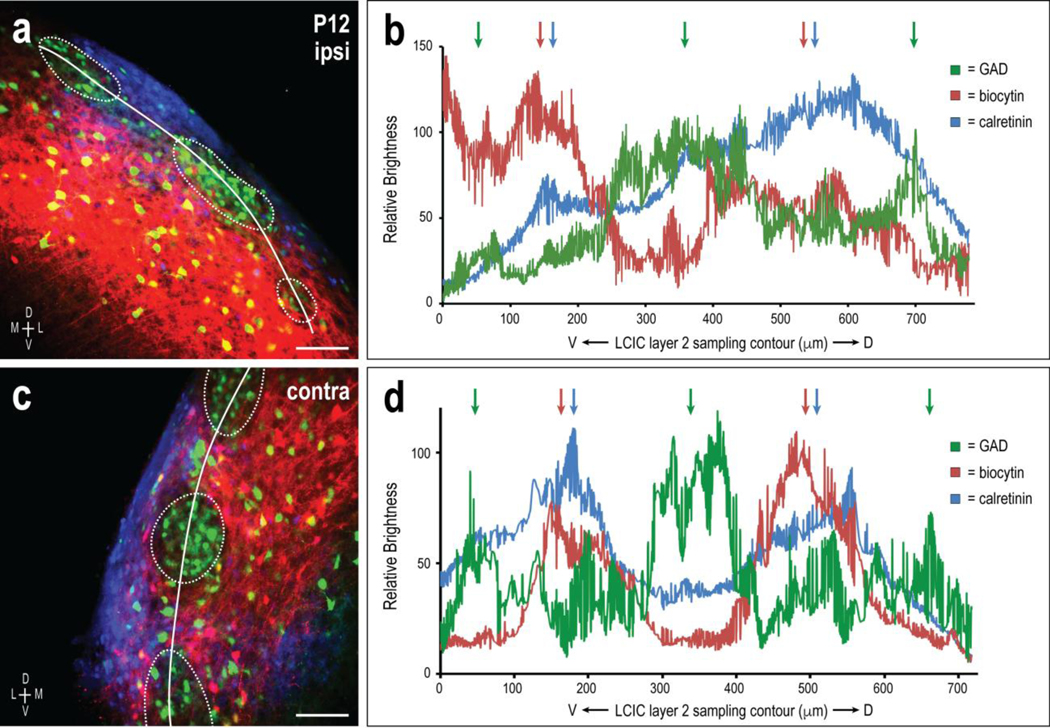
Ipsilateral and contralateral CNIC targeting of LCIC extramodular fields in a P12 GAD67-GFP mouse. Sampling of both the uncrossed (a, b) and crossed (c, d) inputs yields highly periodic signals for each channel. Both projection distributions overlap CR-defined extramodular zones (b, d, blue and red arrows) and are out-of-phase with peak GAD modular labeling (green arrows). Scale bars in (a, c) = 100 μm
Confirmation of time course of emerging neurochemical LCIC compartments
Pilot tracing experiments described above suggest a peak period of CNIC to LCIC projection shaping that occurs during the first two postnatal weeks. Subsequent experimentation focused on three developmental stages: P0 (onset of critical period), P6 (presumptive peak shaping; just prior to largely established patterns at P8), and P12 (discrete, adult-like projection patterns, similar to that observed in adult mouse). As a first-step in determining how developing inputs from the CNIC interface with emerging LCIC compartments, CR staining was performed in GAD67-GFP mice at each of these ages to visualize the evolving LCIC modular-extramodular framework. At birth, GAD-positive modules are not easily discernible (Fig. 2a), nor is a definitive CR extramodular pattern, although expression is most evident in LCIC layers 1 and 3 (Fig. 2b) and absent from aspects of layer 2 (Fig. 2b, arrowheads). By P6, LCIC modularity is more established, with a series of discontinuous GAD-positive layer 2 patches encompassed by largely complementary CR labeling (Fig. 2d–f, dashed contours). Discrete LCIC compartments are fully segregated by P12, with readily identifiable modular-extramodular zones (Fig. 2g–i, dashed contours). These findings suggest that the time course for emerging LCIC compartments coincides with the shaping of discretely mapped projection patterns, and were thus the impetus for experiments coupling tract-tracing approaches with these reliable markers of emerging modular-extramodular zones.
Fig 2.
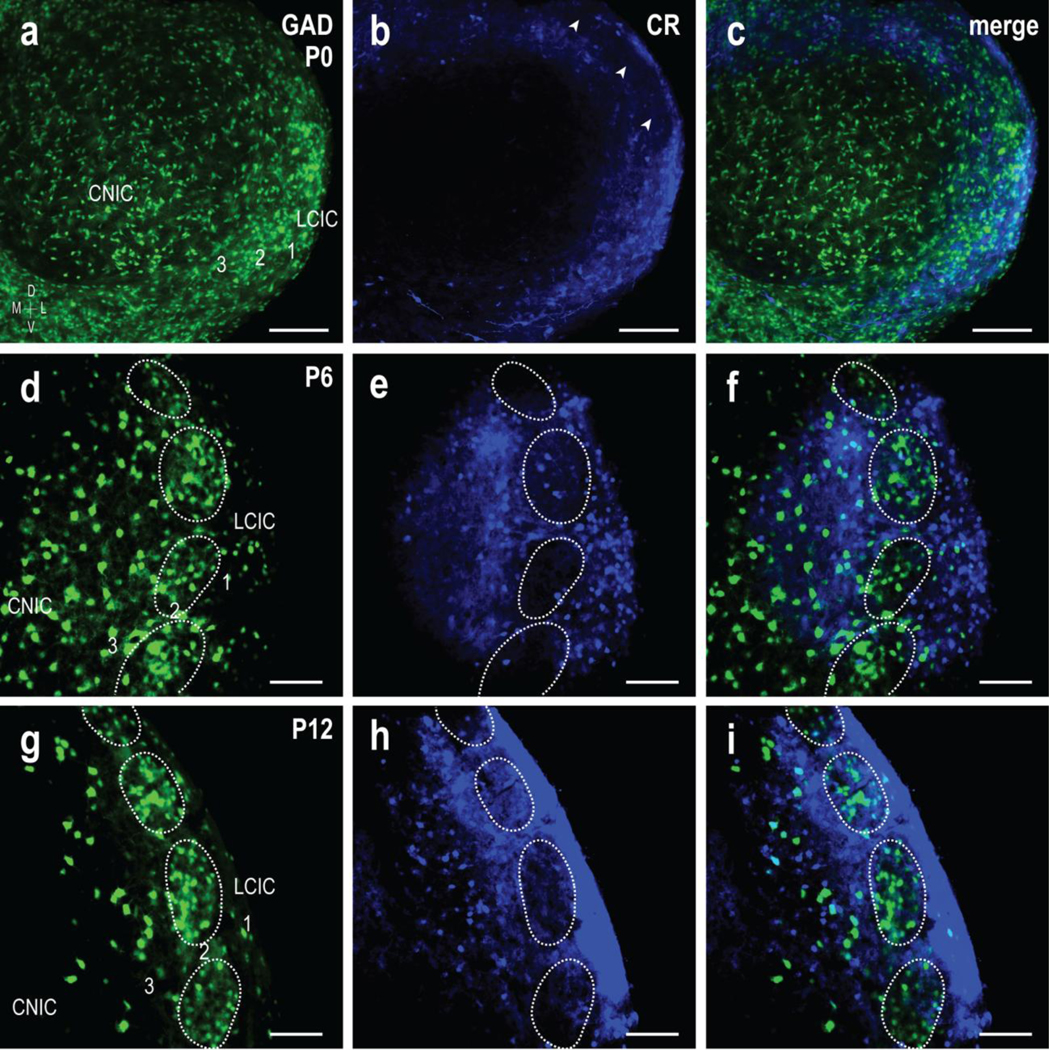
Development of complementary GAD and CR LCIC patterning. The emergence of GAD67-positive modules (green) and CR-positive extramodular zones (blue) was examined from birth (P0) to P12. These endpoints, including a midpoint at P6, were chosen as previous work from our lab highlighted this as the critical period for sorting of LCIC compartments. Furthermore, our pilot tracing studies presented here suggest that LCIC afferent patterns are largely unorganized at birth and form discrete projection maps by P12. At birth (a-c), GAD modules are not readily apparent (a), although CR expression is already concentrated in layers 1 and 3, surrounding layer 2 labeling voids (b, arrowheads). No clear compartmental organization is apparent in P0 merges (c). Periodic layer 2 GAD clustering is more evident at P6, as is extramodular CR labeling (d-f). Markers at this age reveal early indications of complementary modular-extramodular zones (d-f, dashed contours). By P12 (g-i), discrete GAD-positive LCIC modules are easily distinguished from surrounding extramodular CR expression, yielding sharpened boundaries of the complementary LCIC compartmental framework (g-i, dashed contours). Sporadic GAD-positive neurons were commonly observed at all ages in the LCIC outside concentrated layer 2 patches, as well as throughout neighboring IC subdivisions. Scale bars in = 100 μm
Ipsilateral CNIC projection development and LCIC targeting with respect to emerging modular zones
Biocytin labeling in living slice preparations of GAD67-GFP mice spanning the period of peak projection shaping (P0, P6, and P12) facilitated direct comparison of sculpting auditory afferents with respect to emerging LCIC compartments. Consistent with that mentioned previously, GAD-positive modules were not readily apparent at birth, although pioneer fibers from the ipsilateral CNIC have invaded the LCIC (Fig. 3a, b, respectively). A digital merge at this earliest postnatal timepoint illustrates that axons are present in the LCIC, diffusely distributed throughout all layers, with no clear organization yet or preference for any primitive LCIC compartments (Fig. 3c). With comparable CNIC fills at P6, a more robust ipsilateral input to LCIC was reliably observed, as well as early indications of a preference for extramodular terminal distributions, largely surrounding GAD-defined modules (Fig. 3d–f, dashed contours). By P12, concentrated layer 2 GAD-positive modules are distinct (Fig. 3g), as are extramodular terminal patterns of the uncrossed CNIC input (Fig. 3h). At this age labeled afferents form a dense terminal plexus that encompasses all aspects of extramodular LCIC domains, including layers 1, 3, and intermodular bridge zones. Digital merges at P12 unequivocally show that discontinuous layer 2 voids in the ipsilateral CNIC projection pattern are occupied by GAD-positive modules (Fig. 3i, dashed contours). These qualitative findings suggest that the discretely mapped ipsilateral CNIC projection arises from an initially sparse and nonspecific distribution, subsequently segregating during an early critical period into extramodular zones that are complementary to GAD-defined modules.
Fig 3.
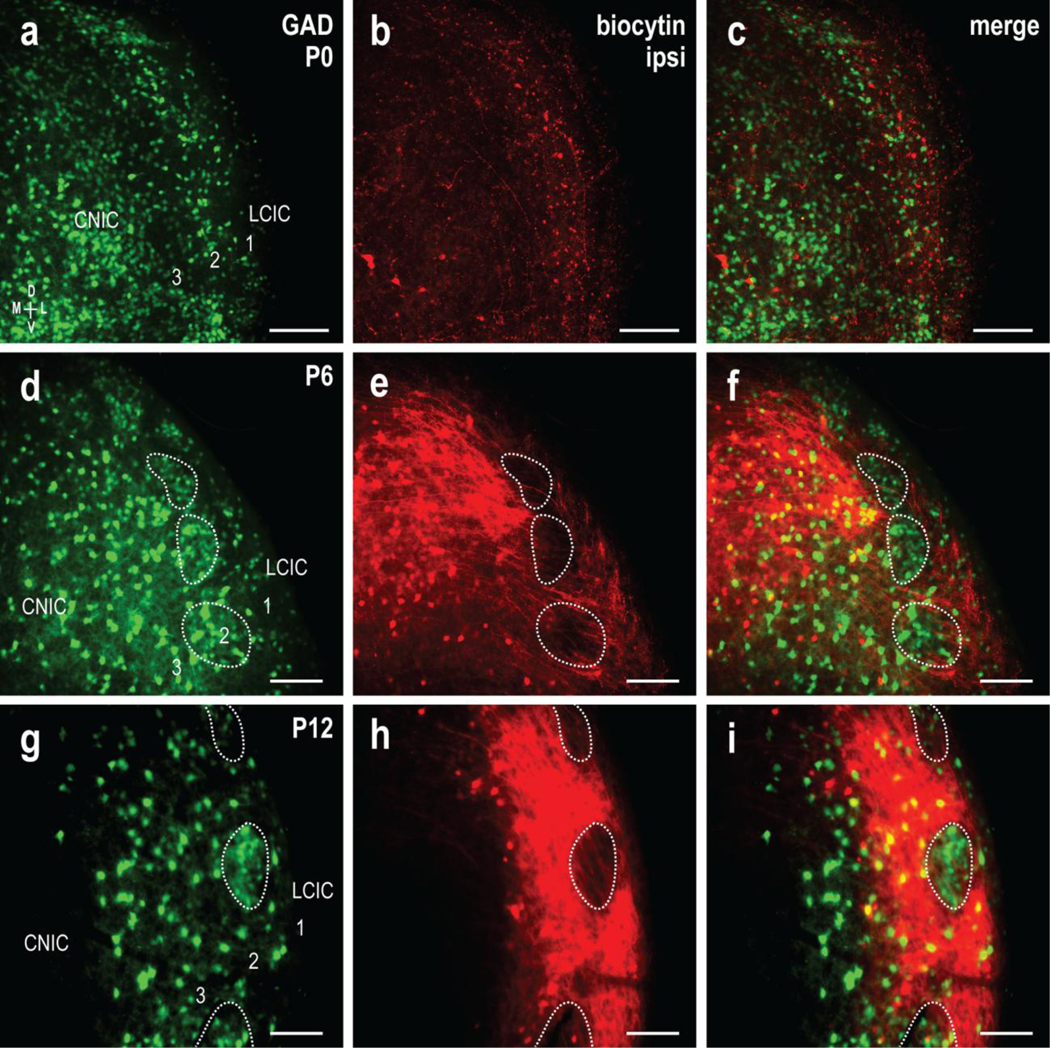
Developmental segregation of the uncrossed CNIC projection from GAD-positive LCIC modular fields. GAD67-GFP (green) and biocytin labeling (red) of the ipsilateral input at P0 (a-c), P6 (d-f), and P12 (g-i). At birth, some CNIC fibers occupy aspects of the LCIC, although labeling was sparse and unorganized. With emerging compartments at P6, uncrossed inputs show a preference for extramodular zones, with few fibers evident in GAD-defined modules (d-f, dashed contours). By P12, labeled projection distributions were consistently robust and discretely mapped to extramodular zones, with prominent voids throughout layer 2 that coincided with GAD-positive modules (g-i, dashed contours). Scale bars = 100μm
Shaping of ipsilateral CNIC patterns relative to emerging modular zones.
Further analyses were performed for each case on multiple sections throughout the mid-rostrocaudal third of the LCIC where discrete patterning was most readily apparent. Consistent ROI sampling was performed on each section for each channel from ventral-to-dorsal along LCIC layer 2 contours, bisecting defined modules (threshold-defined at P6, and P12; not identifiable at birth; Fig. 4a, c, e). A line thickness that was age appropriate was set in each case to include the full modular extent, while not encroaching into layers 1 and 3. Sampling of GAD and biocytin channels yielded brightness plot profiles that suggest projection shaping during this early critical period with respect to emerging LCIC compartments (Fig. 4b, d, f). Periodicities for both channels at birth were not consistently apparent or pronounced (Fig. 4b). No obvious periodic correlation between the two waveforms regarding overlap or offset was evident. The qualitative observation that by P6 ipsilateral CNIC projections begin to align with LCIC extramodular zones that are complementary to emerging GAD-modules was confirmed by the generated plot profile waveforms (Fig. 4d). Both P6 signals exhibit more pronounced periodicities than those at birth. In short, concentrated ipsilateral CNIC labeling in layer 2 peaks periodically between GAD-positive modules (Fig. 4d, alternating green and red arrows), consistent with intermodular bridge zones that link extramodular layers 1 and 3. Projection shaping and increasing specificity appears to continue up to P12 with even more distinct patterns (Fig. 4e, f). Channel waveforms are clearly periodic and nearly perfectly offset or out-of-phase with each other (Fig. 4f, alternating green and red arrows). Quantitative analyses of these qualitative findings are presented later with crossed projection data in Fig. 7.
Fig 4.
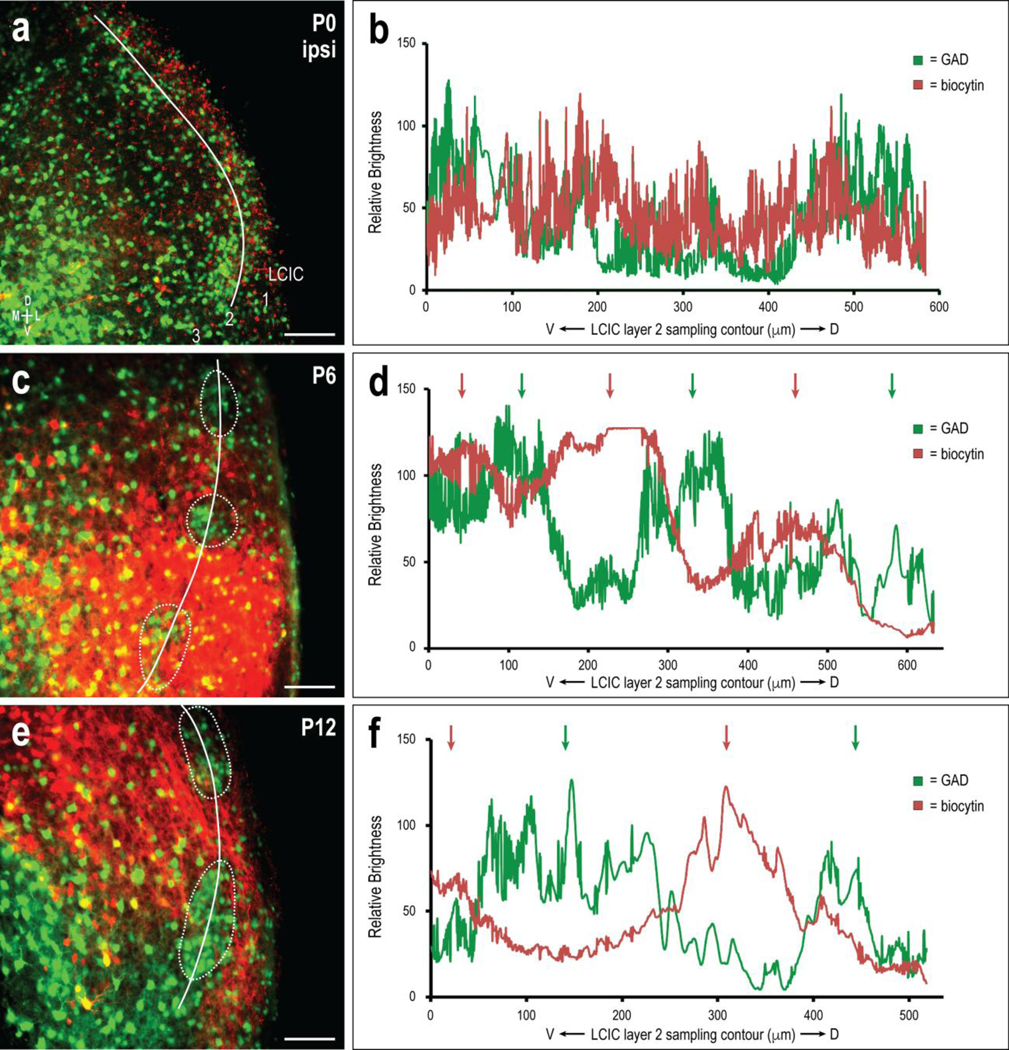
Sampling of developmental progression of ipsilateral CNIC projection specificity and targeting of extramodular zones. Developmental sequence (P0, a; P6, c; P12, e) and corresponding brightness plot profiles (b, d, f) for GAD (green) and biocytin (red) labeling in the mid-rostrocaudal aspect of the LCIC where compartments and discrete projection patterns are most readily apparent. Channel waveforms at birth (b), show no evidence of strongly periodic signals. By P6, noticeably periodic and largely out-of-phase fluctuations emerge (d, alternating green and red arrows), highlighting non-overlap of ipsilateral CNIC inputs with LCIC modules. Projection specificity complementary to that of GAD-defined modular zones appears further sharpened by P12 (f, alternating green and red arrows), indicating early postnatal adult-like patterning. White curves (a, c, e) indicate LCIC layer 2 sampling. Dashed contours highlight layer 2 modules, corresponding to peaks in adjacent brightness plot profiles (green arrows). Scale bars in (a, c, e) = 100μm
Fig 7.
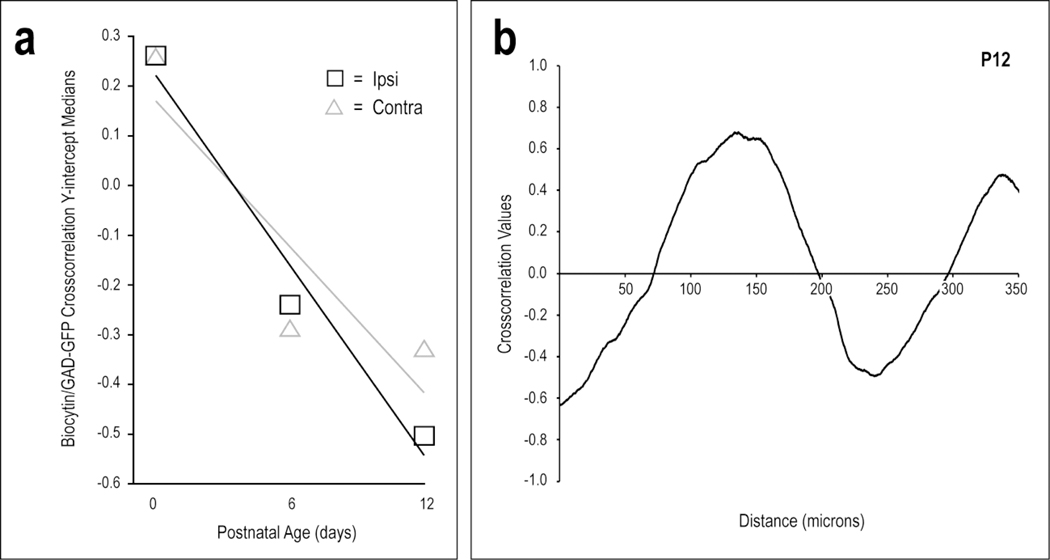
Quantification of projection pattern shaping over defined critical period. Crosscorrelation y-intercept medians for both the ipsilateral and contralateral inputs consistently decrease with age (a). Linear regressions are shown for each of the plotted projections. These definitive negative trends confirm that both CNIC projections become increasingly complementary to emerging LCIC modular fields. A representative crosscorrelation function of raw data from a P12 ipsilateral case (b) has a y-intercept value of −0.64. Off-origin peaks and troughs indicate spatial shifts between biocytin and GAD signals that align or misalign, respectively.
Development of contralateral CNIC-to-LCIC targeting with respect to emerging modular zones
In addition to assessing the developmental progression of uncrossed inputs with respect to emerging modular zones, we also examined that of the crossed CNIC projection that courses through the IC commissure en route to the contralateral LCIC. Like the ipsilateral projection, sparse fibers occupy the contralateral LCIC at birth and are largely unorganized (Fig. 5a–c). At P6, GAD-positive modules were readily apparent (Fig. 5d, dashed contours) and biocytin labeling of the crossed input was again more dense and most heavily concentrated in LCIC layers 1 and 3, leaving conspicuous patchy voids along layer 2 (Fig. 5e, dashed contours). Channel merges at this age reveal developing contralateral specificity for extramodular LCIC domains that surround emerging modules (Fig. 5f, dashed contours). By P12, anterograde labeling of the crossed projection consistently yielded an exceedingly dense extramodular fibrous plexus that encased discrete zones occupied by GAD-positive modules (Fig. 5g–i, dashed contours).
Fig 5.
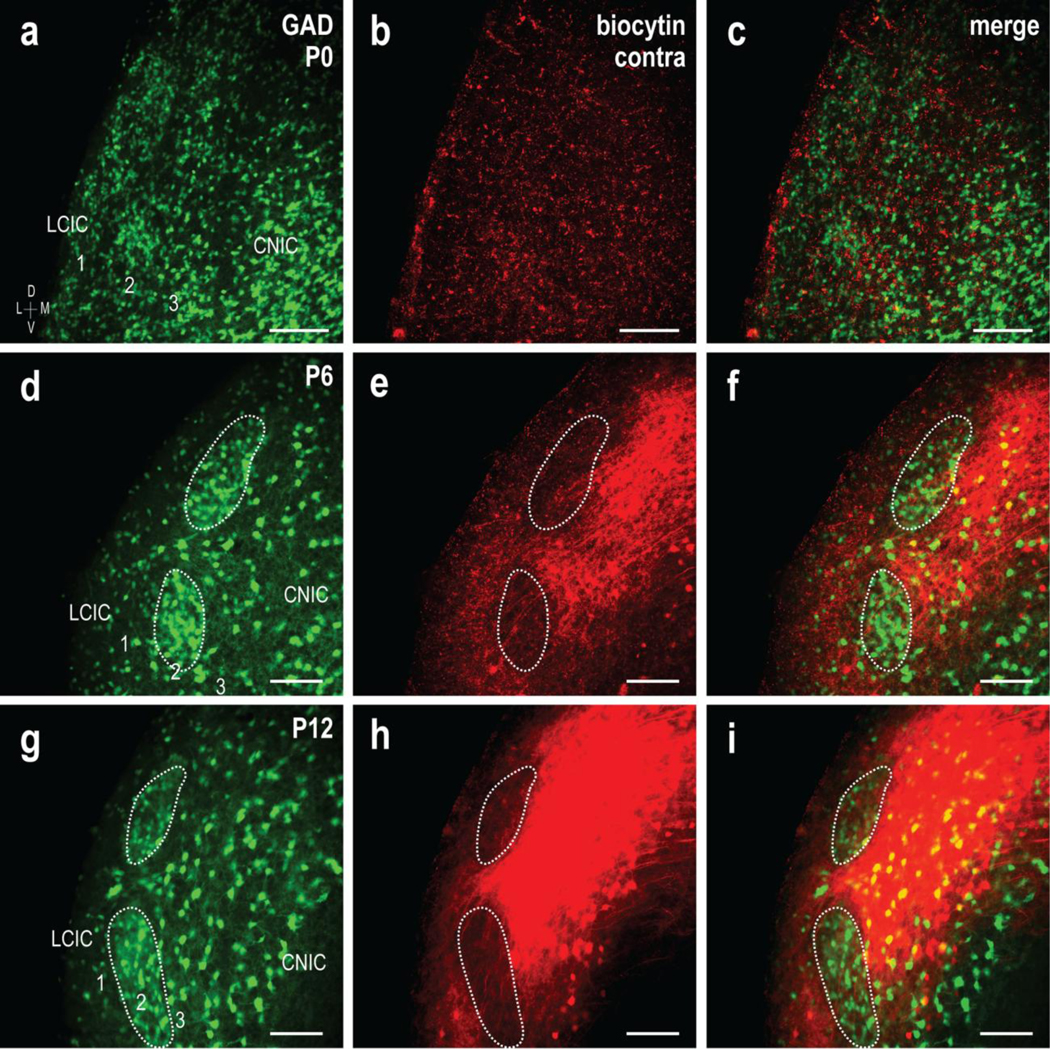
Shaping of the crossed CNIC projection to LCIC extramodular zones. GAD67-GFP (green) and biocytin labeling (red) of the contralateral input at P0 (a-c), P6 (d-f), and P12 (g-i). Similar to that described for the uncrossed input, GAD modules were indistinct at birth, and while present in the contralateral LCIC, crossed projections were sparse and unorganized. Discrete GAD modules are readily identifiable at P6, with crossed inputs that appear to preferentially target surrounding extramodular zones However, compared to the uncrossed input, the crossed projection at this age across cases appeared qualitatively to have more fibers remaining within modular confines (d-f, dashed contours). At P12, the projection distribution terminated heavily within the LCIC, with dense extramodular patterns encompassing GAD-defined modules (g-i, dashed contours). Scale bars = 100μm
Developing contralateral CNIC patterns with respect to emerging modularity
A comparable developmental progression was observed for the crossed CNIC-to-LCIC input as was previously described for that of the uncrossed input (Fig. 6, refer back to Fig. 4). Sparse labeling at P0 for both channels (Fig. 6a) again indicated predominately intermingling waveforms (Fig. 6b). By P6, the contralateral CNIC projection distribution was concentrated mostly in LCIC extramodular zones, and complementary to emerging GAD-modules, although some overlap of axonal labeling was still apparent within modular confines (Fig. 6c, d, green and red arrows). The crossed input at P6 appears periodic, although weaker than its ipsilateral counterpart at this age; as evidenced both by the signals themselves and their autocorrelation analyses (ipsi peak median = 0.59, contra peak median = 0.26). By P12, dense crossed projection distributions reliably occupy extramodular domains and surround discontinuous GAD-positive layer 2 modules (Fig. 6e, f, alternating green and red arrows). Despite the stated P6 autocorrelation median disparity, by P12 they were both stronger and identical, with a 0.63 value. Thus, both ipsilateral and contralateral projections are strongly periodic and exhibiting characteristics of discretely mapped inputs by P12.
Fig 6.
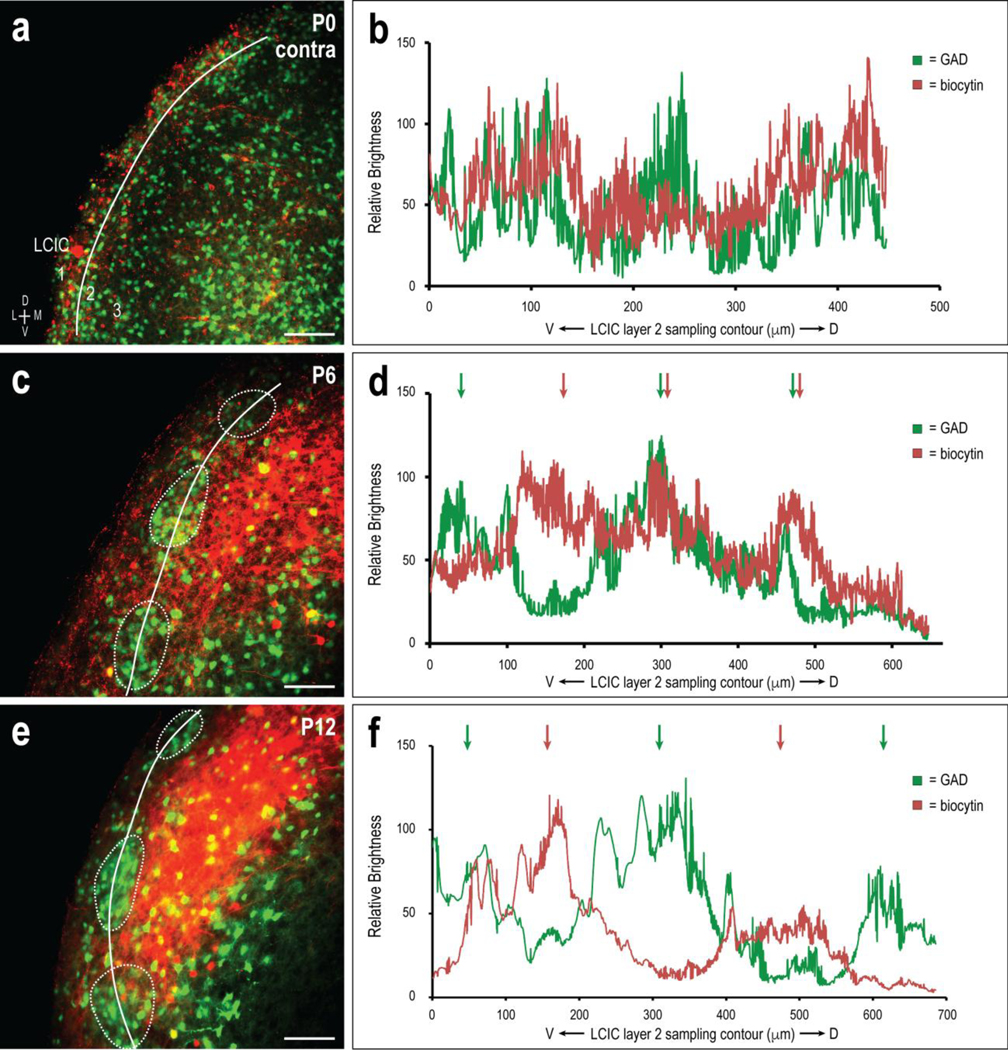
Developing CNIC projection patterns within the contralateral LCIC with respect to emerging LCIC modular fields. Developmental progression (P0, a; P6, c; P12, e) and corresponding brightness plot profiles (b, d, f) for GAD (green) and biocytin (red) labeling. Signals at birth (b) again gave no consistent indication of periodicity or ordered projection patterns. At P6, periodic waveform components strengthened, with evidence of labeling that appeared spatially offset from GAD modules in some areas, while others showed remnants of projection overlap (d, green and red arrows). While perhaps somewhat delayed in its overall organization at P6 compared to the uncrossed input, crossed projection patterns by P12 were fully sharpened, with clearly extramodular waveforms that were out-of-phase with discontinuous GAD labeling (f, alternating green and red arrows). Scale bars in (a, c, e) = 100μm
Quantitative assessment of developmental projection shaping
With age, signal periodicities for both projection patterns and GAD-defined modules become increasingly clear as evidenced by the decreasing coefficients of variation (CVs) of off-axis autocorrelation peaks. CVs averaged over all channels at P0, P6, and P12 were 47%, 26%, and 23% respectively. Both ipsilateral and contralateral projection patterns get increasingly out-of-phase with defined modular fields over the examined critical period as evidenced by crosscorrelation analyses (Fig. 7). At birth, slightly positive crosscorrelation y-intercept medians indicate sparse intermingling projections that overlap primitive LCIC compartments. With continued development, y-intercepts significantly decrease, indicating increasing mismatch of signal variations (Fig. 7a). P12 crosscorrelation functions show consistently negative y-intercept values, demonstrating out-of-phase signals. As the two signals are shifted spatially relative to each other, subsequent positive and negative extrema in crosscorrelation functions indicate the shift at which the two signals match and mismatch, respectively (Fig. 7b). These results quantitatively confirm that initially diffuse projections are shaped during this early critical period into discrete patterns that are complementary to GAD-defined layer 2 modular fields. For each developmental stage, comparison of crosscorrelation y-intercept values for the ipsilateral and contralateral inputs were not significantly different (p > 0.05). Therefore, compiled ipsilateral and contralateral crosscorrelation data at each age were compared and found to be statistically different from each other (p < 0.05 for P0 vs P6, P0 vs P12, P6 vs P12).
Bilateral CNIC projection patterns occupy LCIC extramodular zones
To further confirm the observed projection specificity at P12 for both the ipsi- and contralateral inputs as definitively extramodular, we repeated the above tracing experiments in GAD67-GFP mice in concert with immunostaining for calretinin. As CR is a reliable marker of extramodular domains, it was anticipated that CNIC inputs should be complementary to GAD-positive modules, while overlapping CR-positive zones. As in the previous P12 experiments, a series of GAD-positive modules were easily discerned in every case at mid-rostrocaudal aspects of the LCIC (Fig. 8a, e, i, dashed contours). As anticipated, inputs arising from the ipsilateral CNIC consistently yielded a dense plexus that filled the LCIC, except for a series of periodic voids of label that spanned layer 2 (Fig. 8b, f, j, dashed contours). A strikingly similar pattern to the labeled projection distribution was observed for CR staining (Fig. 8c, g, k). A magnification series of digital merges of the three channels confirm that discrete uncrossed CNIC projection patterns are established in the LCIC by P12, targeting zones complementary to GAD-defined modules that overlap CR-defined extramodular regions (Fig. 8d, h, l).
Examination of the LCIC opposite the CNIC tracer placement verified a similar specificity of crossed inputs to extramodular domains. Once again a series of layer 2 GAD modules were easily distinguished (Fig. 9a, e, i, dashed contours), afferent labeling was robust and extramodular in its appearance, avoiding discrete layers 2 patches (Fig. 9b, f, j), and CR expression patterns closely matched that of the labeled projection distribution (Fig. 9c, g, k). Taken together, these findings confirm that much like the uncrossed input, the crossed CNIC projection is also largely sculpted by P12, terminating specifically in defined extramodular regions that encompass LCIC modular fields (Fig. 9d, h, l, dashed contours).
Fig 9.
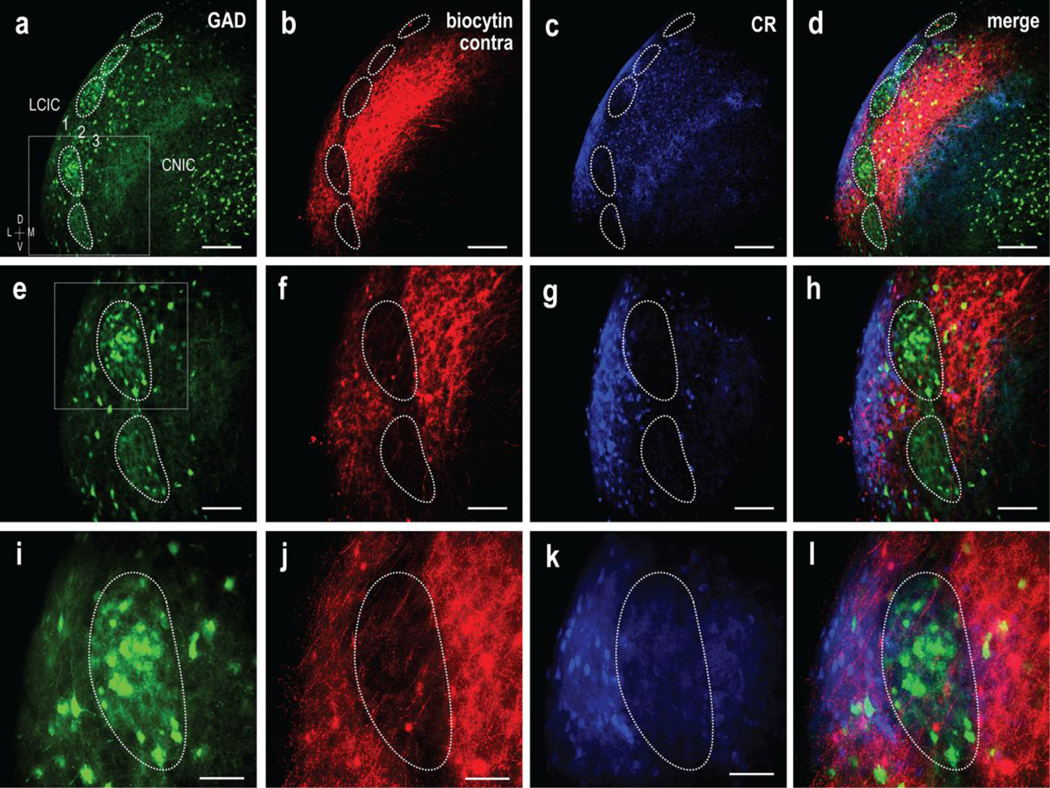
Projection specificity of contralateral CNIC inputs to extramodular LCIC domains in a P12 GAD67-GFP mouse. Magnification series of separate channels (GAD = green, biocytin = red, CR =blue) and corresponding digital merges. Inset boxes in (a, e) are shown at higher magnification in (e-h) and (i-l) respectively. Similar to that described for the ipsilateral input, a series of GAD modules are evident at low magnification (a, dashed contours) that appear complementary to the contralateral terminal plexus and calretinin labeling (a-d). Alignment of the crossed projection distribution with CR-positive extramodular zones that is complementary to GAD labeling is increasingly evident at higher magnification (e-h and i-l). Scale bars in (a-d) = 200 μm, (e-h) = 100 μm, and (i-l) = 50 μm
Confirmation and quantification of targeting of LCIC modular-extramodular framework at P12
Similar sampling and quantification assessments were performed for each of the culminating P12 cases (n = 4). In accordance with our P12 data reported above (Figs. 3–7), labeling of both pathways resulted in highly periodic patterns that appeared consistently out-of-phase with periodic GAD labeling (Fig. 10; green and red labeling/waveforms/arrows). The same ROI sampling for CR channels also resulted in strongly periodic profiles, with signal fluctuations that closely matched those of the ipsi- and contralateral projection distributions (Fig. 10; blue and red labeling/waveforms/arrows) and were spatially offset from GAD expression patterns (Fig. 10; blue and green labeling/waveforms/arrows). These findings confirm highly sculpted LCIC auditory afferent patterns by P12 that arise bilaterally from the CNIC and preferentially terminate within CR-positive extramodular zones.
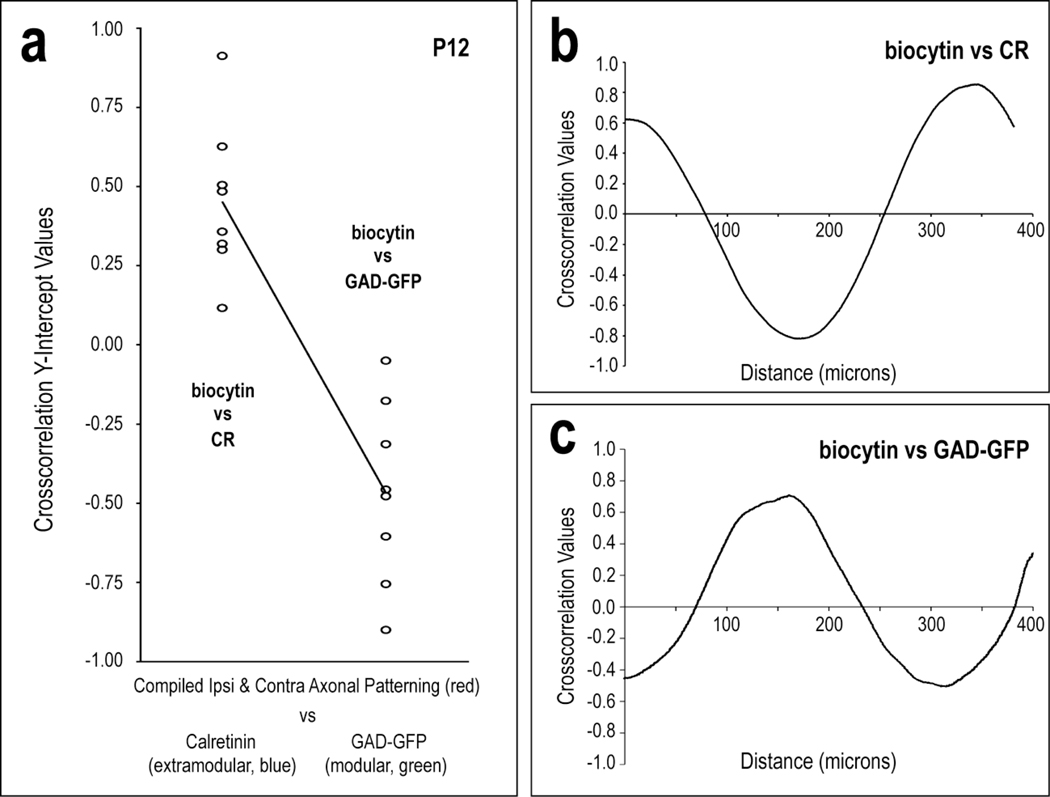
Crosscorrelation analysis results demonstrate the spatial relationship of LCIC afferent patterns arising from the CNIC with respect to established modular-extramdodular zones (Fig. 11). The positive y-intercept values for labeled projections patterns with respect to CR-defined extramodular zones indicate consistent signal overlap or registry. In contrast, equally consistent negative crosscorrelation y-intercept values for the same axonal distributions with respect to GAD-defined compartments confirm complementary or non-overlapping patterns with LCIC modular zones (Fig. 11a). These quantitative assessments support the qualitative observations (refer back to Fig. 10) of matching (extramodular) and mismatching (modular) axonal patterns with defined LCIC compartments. The crosscorrelation y-intercept median value for biocytin and CR signals was +0.42 with a standard deviation of 0.24, whereas that for biocytin and GAD signals was −0.47 with a standard deviation of 0.29. Not surprisingly, the consistently different algebraic signs of these disjoint median sets proved to be statistically different from each other (p < 0.001). A representative crosscorrelation function between biocytin and CR has a positive y-intercept near the median (strong signal matching). Increasing relative shifts of the two signals with respect to each other first produce a trough (strong mismatch) followed by a peak (another strong match). (Fig. 11b). A representative crosscorrelation function between biocytin and GAD-GFP has a negative y-intercept near the median (strong signal mismatching). Increasing relative shifts of the two signals with respect to each other first produce a peak (strong match) followed by a trough (another strong mismatch). (Fig. 11c).
Fig 11.
Quantification of discrete CNIC projection patterns with respect to the LCIC modular-extramodular framework at P12 (a). Significantly different crosscorrelation y-intercept values for biocytin and CR vs. biocytin and GAD confirm projection patterns that overlap extramodular zones and are complementary to LCIC modular fields (p < 0.001). Crosscorrelation of axonal labeling with extramodular waveforms produced positive y-intercepts, whereas that analysis of axonal labeling with modular waveforms produced negative values. The plotted linear regression underscores the disjoint y-intercept values for the extramodular and modular data sets. Representative P12 crosscorrelation functions for contralateral labeling with CR and GAD are depicted in (b) and (c), respectively.
Discussion
In an effort to begin to understand the developmental progression and precise mechanisms that influence ordering of converging LCIC multimodal afferents, the present study aimed to pinpoint a critical period of projection shaping for auditory inputs arising bilaterally from the CNIC. Using anterograde tracing approaches combined with immunocytochemistry for calretinin in GAD67-GFP living slice preparations, the results identify an early postnatal period of shaping for both the uncrossed and crossed projections that yields discrete extramodular LCIC patterns by P12. Quantitative assessments show these patterns sharpen with age over the examined timeframe, exhibiting a strict adherence or overlap with CR-positive domains, that are nonoverlapping or complementary to GAD-defined modular fields. Our findings support the notion that LCIC projection pattern specificity develops coincident with, or immediately after the emergence of its characteristic modular-extramodular framework. The described temporal sequencing and spatial interfacing of its developing connections with its newly constructed compartments suggests inherent cues likely play an instructive role in the multimodal circuit assembly of the nascent LCIC.
Multimodal segregation and development of LCIC afferents
An increasing amount of adult studies showing discontinuous terminal distributions with modular/extramodular appearances suggest modality-specific projection streams that are likely functionally segregated within the LCIC, targeting distinct compartments of its micro-organization (Wiberg and Blomqvist, 1984; Saldaña and Merchán, 1992; Saldaña et al., 1996, Winer et al., 1998; Bajo et al., 2007; Torii et al., 2013; Stebbings et al., 2014; Lesicko et al., 2016). Corticocollicular and intracollicular projections of auditory origin preferentially target LCIC extramodular fields (Torii et al., 2013; Stebbings et al., 2014; Lesicko et al., 2016), whereas ascending (dorsal column nuclei) and descending (corticocollicular) somatosensory inputs preferentially target modular fields (Lesicko et al., 2016). The most recent of these studies illustrated this connectional modularity in adult mice, such that both bottom-up and top-down inputs of somatosensory and auditory origin target LCIC modular and extramodular zones, respectively (Lesicko et al., 2016). While our data in developing mice are directly in line with these adult findings, it is worth mentioning that some contributions to the dense terminal network we report here may include a few fibers previously reported in rat that course through the CNIC destined for deep aspects of the LCIC that arise from the ipsilateral superior paraolivary nucleus (SPON, Saldaña et al., 2009) or auditory cortex (Saldaña et al., 1996). Somewhat sparse retrograde labeling of cells in these areas, taken together with the comparably extensive patterning observed here, suggest that the vast majority of LCIC terminal labeling originated within the CNIC itself.
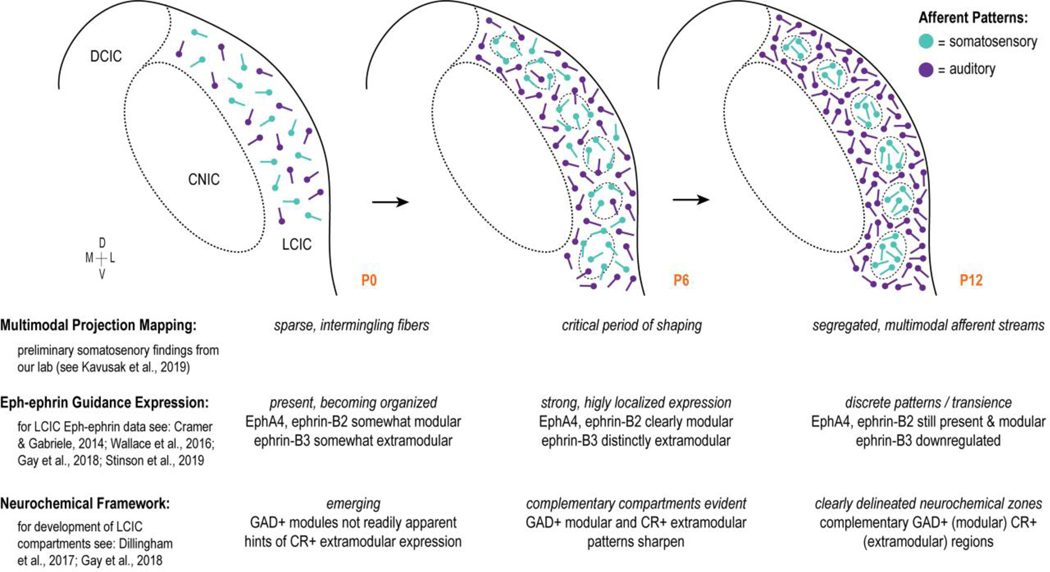
While others have used tract-tracing approaches paired with GAD immunocytochemistry in the adult to highlight projection targeting with respect to modular fields, the present experiments are the first to examine LCIC projection pattern development and subsequent alignment while visualizing both compartments of its emerging modular-extramodular framework (GAD67-GFP mice: modular zones; CR staining: extramodular zones). Ipsilateral and contralateral inputs arising from the CNIC occupy the LCIC by birth, but are sparse and largely unorganized. Significantly more fibers were observed at P6 with comparable fills of the CNIC, suggesting continued ingrowth and elaboration within the target. By this age separation of CNIC inputs from GAD-positive modular fields and preference for surrounding extramodular zones was evident, perhaps due to continued elaboration within appropriate domains coupled with selective refinement within inappropriate compartments. Further studies are needed, however, to determine the specific mechanisms by which individual axons elaborate and are perhaps selectively pruned within the LCIC. By P12, a dense extramodular terminal plexus was consistently seen that matched CR-positive extramodular expression and avoided layer 2 LCIC modules. Based on recent preliminary findings in our laboratory, we predict a similar time course for the development of afferent streams from somatosensory sources, albeit exhibiting complementary modular LCIC projection patterns (Fig. 12; Balsamo and Gabriele 2015; Kavusak et al., 2019). Ongoing experiments simultaneously labeling auditory and somatosensory inputs together with modular-extramodular markers should provide further insights regarding the development and segregation of LCIC multisensory afferents with respect to each other.
Fig 12.
Working model of critical period for developing multimodal LCIC projection maps correlated with emerging LCIC compartmental framework and known Eph-ephrin guidance patterns. Timeline correlating simultaneous events regarding the emergence of the LCIC micro-organization, its connectivity, and the potential influence of Eph-ephrin guidance cues. This summary compares the current findings in light of recent reports from our lab. Sparse multimodal afferents likely intermingle at birth prior to a critical period of shaping from P4 to P8. During this peak period, the neurochemical modular-extramodular framework becomes readily apparent and Eph-ephrin expression is strong and mimics the emerging microarchitecture. By P12, LCIC compartments are well established, as are its segregated multimodal afferent streams. Coincident with mature projection patterns is the downregulation of certain Eph-ephrin members
Correlation of Eph-ephrin guidance expression, emerging LCIC compartments, and its developing projection patterns
Eph-ephrin signaling is widely implicated in a variety of critical developmental events, including cell segregation and boundary formation, as well as the establishment of topographic maps (Cramer, 2005; Klein, 2012; Klein and Kania, 2014). Recent reports from our lab reveal discrete LCIC Eph-ephrin patterns during this early critical period that align with the emerging neurochemical modularity (Gay et al, 2018). In particular, EphA4 and ephrin-B2 are modular in their expression patterns (Gabriele et al., 2011; Cramer and Gabriele, 2014; Wallace et al., 2016; Gay et al., 2018), whereas ephrin-B3 expression appears strikingly complementary, with its expression highly localized to presumptive extramodular zones (Wallace et al., 2016; Stinson et al., 2019).
Given the discrete arrangement of EphA4, ephrin-B2, and ephrin-B3 expression patterns during the period that the modular-extramodular framework emerges, it is plausible they may work in concert to exert influences necessary for the segregation of initially intermingled cell populations into distinct compartments as has been described in other systems (Batlle and Wilkinson, 2012; Klein, 2012; Klein and Kania, 2014). As Eph-ephrin interactions require cell-to-cell contact, they often utilize both adhesive and repulsive mechanisms to accomplish the establishment and maintenance of stable boundaries for segregated cell populations. Much of this control stems from their ability to manipulate actin cytoskeletal dynamics, as well as cadherin- and integrin-mediated cell adhesion. Reciprocal Eph-ephrin expression is well documented in the cell sorting and delineation of sharp rhombomere and somite borders in the hindbrain (Xu et al., 1999; Cooke et al., 2005). LCIC compartments may arise via similar mechanisms, including repulsive interactions between modular and extramodular Eph-ephrin expressing cells, and/or adhesive events between cells of the same compartment. Further studies that determine the specific involvement of Ephs and ephrins and their interplay with other cell adhesion families are needed to better understand the mechanisms that instruct the formation of LCIC functional compartments.
Beyond potential involvement in sorting emerging LCIC cell populations, matching temporal and spatial Eph-ephrin expression patterns with developing projection maps strongly implicate them in playing a role in the ordering of early LCIC circuits. It is well-established that Eph-ephrins influence topographic mapping and pattern formation in a variety of systems, including the visual, auditory, olfactory, and gustatory pathways (St John et al., 2002; Cang et al., 2005; Luo and Flanagan, 2007; Cang and Feldheim, 2013; Cramer and Gabriele, 2014; Treffy et al., 2016). The present results, taken together with previous findings from our laboratory, suggest CNIC inputs target extramodular zones that are ephrin-B3 positive, and avoid modular confines expressing EphA4 and ephrin-B2. It appears that the opposite may prove to be true for developing somatosensory inputs that seemingly localize to modular zones during the same time period. Much additional work is necessary to begin to unravel the likely complex signaling interactions that drive the initial patterning and axonal guidance of discrete LCIC multimodal maps. Future experiments examining Eph-ephrin interactions in vitro (e.g stripe assays), as well as tract-tracing studies in tissue-specific conditional Eph-ephrin knockouts should provide further insights concerning the role these molecules play in establishing segregated multisensory LCIC circuits.
Resemblance with SC lattice and striatal patch-matrix arrangement
A variety of other brain structures exhibit a compartmental fine structure with matching projection patterns that resemble that of the LCIC. In particular, the defined neurochemical framework of the superior colliculus and striatum closely parallel that described here for the LCIC and its distinct connections that likely reflect unique functional compartments.
The SC, like the LCIC, is a multimodal structure that exhibits a neurochemical honeycomb-like lattice. A variety of markers pull out this organization, including AChE, NADPH-d, and CO. These three are colocalized in the intermediate layers, while AChE is complementary to the others in the deep SC (Wallace, 1986a; Wallace, 1986b; Illing, 1996). The multimodal afferent and efferent streams of the SC conform to this lattice-like framework, which serves as a functional substrate for the segregation of such projections (Illing and Graybiel, 1985; Wallace and Fredens, 1989; Mana and Chevalier, 2001). The LCIC shows a similar segregation of multimodal inputs that adhere to its neurochemical framework, which appears to also serve as a substrate for multisensory information streams. Thus, the present study is the first to provide evidence that LCIC projection patterns emerge during an early postnatal critical period and target discrete functional compartments.
Another structure that closely resembles that of the LCIC is the striatum, which also exhibits a complex mosaic arrangement with interfacing afferent and efferent connections. The striatum too is neurochemically-defined, with its well-documented patch (striosome)-matrix compartments (patches positive for: μ opiate receptors, substance P, dopamine 1-receptor, met-enkephalin, calretinin, Nr4al, prodynorphin, GAD-2, and EGR; matrix positive for: AChE, choline acetyltransferase, calbindin, enkephalin, DA2-receptor, and somatostatin; Herkenham and Pert, 1981; Gerfen, 1985; Gerfen, et al., 1985; Gerfen, 1992; Brimblecombe and Cragg, 2017). Furthermore, Eph-ephrin guidance markers also align with emerging striosome-matrix functional zones much like the LCIC (Passante et al., 2008). EphA4 is expressed within the striosomes, while EphA7 and ephrin-A5 are confined to the matrix area within the dorsal striatum (Tai et al., 2013). Striatal afferents and efferents are also defined with respect to neurochemical and Eph-ephrin guidance patterns (Gerfen 1989, Janis et al., 1999; Tai et al., 2013; Tai and Kromer, 2014). Considerably more is known about the ontogeny of the striatum than that of the LCIC and the SC. Striatal neurons are initially intermingled and segregate into the appropriate striosome-matrix arrangement during the late embryonic period (van der Kooy and Fishell, 1987; Fishell et al., 1990). Due to the striking compartmental similarities between the striatum and the LCIC, as well as our current developmental findings, we suspect that LCIC auditory and somatosensory domains might also initially intermingle or exhibit some degree of overlap during early postnatal stages prior to segregating into an adult-like modular-extramodular organization.
Concluding remarks
The presented findings shed light on a critical period for the emergence of LCIC functional compartments and the mapping and alignment of discrete afferent patterns. Ongoing experiments aim to document the shaping of other LCIC modular-extramodular inputs, the development and organization of its diverging efferent streams, as well as the mechanisms responsible for instructing its connectional modularity.
TABLE 1.
Antibody Information
| Antibody name | Structure of immunogen | Manufacturer info. | Concentration used |
|---|---|---|---|
| Anti-calretinin | Recombinant human calretinin containing a 6-his tag at the N-terminal | Swant, CR 7697, RRID: AB_2619710, rabbit, polyclonal | 1:250 |
| Biotinylated horse anti-rabbit IgG | IgG recognizes both heavy and light chains from rabbit | Vector Laboratories, BA-1100, RRID:AB_2336201, horse | 1:600 |
| DyLight 549 streptavidin | Extremely high affinity for biotin, used to detect biotinylated antibodies | Vector Laboratories, SA-5549, RRID:AB_2336408 | 1:200 |
| Alexa Fluor 350 donkey anti-rabbit IgG | IgG recognizes both heavy and light chains from rabbit | Thermo Fisher Scientific, A10039, RRID:AB_2534015, donkey | 1:25 |
Acknowledgements
This work was supported by the National Institutes of Health (DC015353-01A1) and the National Science Foundation (DBI-0619207), and the Madison Trust Award (1002932). The authors also thank Dr. Thomas Gabriele for his signal analysis consultations.
Footnotes
Compliance with ethical standards
Conflict of interest The authors declare that they have no conflict of interest.
Ethical approval All applicable international, national, and/or institutional guidelines for the care and use of animals were followed.
Informed Consent Human subjects were not used in this study
Publisher's Disclaimer: This Author Accepted Manuscript is a PDF file of an unedited peer-reviewed manuscript that has been accepted for publication but has not been copyedited or corrected. The official version of record that is published in the journal is kept up to date and so may therefore differ from this version.
References
- Bajo VM, Nodal FR, Bizley JK, Moore DR, King AJ (2007) The ferret auditory cortex: descending projections to the inferior colliculus. Cereb Cortex 17:475–491. [DOI] [PMC free article] [PubMed] [Google Scholar]
- Balsamo JA, Gabriele ML (2015) Somatosensory inputs to the lateral cortex of the inferior colliculus prior to experience in mouse. Assoc Res Otolaryng Mtg PS-565. [Google Scholar]
- Batlle E, Wilkinson DG (2012) Molecular mechanisms of cell segregation and boundary formation in development and tumorigenesis. Cold Spring Harb Perspect Biol 4(1):a008227. doi: 10.1101/cshperspect7.a008227. [DOI] [PMC free article] [PubMed] [Google Scholar]
- Brimblecombe KR, Cragg SJ (2016). The Striosome and Matrix Compartments of the Striatum: A Path through the Labyrinth from Neurochemistry toward Function. ACS Chem Neurosci 8:235–242. [DOI] [PubMed] [Google Scholar]
- Cang J, Kaneko M, Yamada J, Woods G, Michael SP, Feldheim DA (2005). Ephrin-As guide the formation of functional faps in the visual cortex. Neuron 48:577–589. [DOI] [PMC free article] [PubMed] [Google Scholar]
- Cang J, Feldheim DA (2013) Developmental mechanisms of topographic map formation and alignment. Ann Rev Neurosci 36:51–77. [DOI] [PubMed] [Google Scholar]
- Chernock ML, Larue DT, Winer JA (2004) A periodic network of neurochemical modules in the inferior colliculus. Hear Res 188:12–20. [DOI] [PubMed] [Google Scholar]
- Cooke JE, Kemp HA, Moens CB (2005) EphA4 is required for cell adhesion and rhombomere-boundary formation in the zebrafish. Curr Biol 15(6):536–542. [DOI] [PubMed] [Google Scholar]
- Cramer KS (2005) Eph proteins and the assembly of auditory circuits. Hear Res 206:42–51. [DOI] [PubMed] [Google Scholar]
- Cramer KS, Gabriele ML (2014) Axon guidance in the auditory system: Multiple functions of Eph receptors. Neurosci 277:152–162. [DOI] [PMC free article] [PubMed] [Google Scholar]
- Dillingham CH, Gay SM, Behrooz R, Gabriele ML (2017) Modular-extramodular organization in developing multisensory shell regions of the mouse inferior colliculus. J Comp Neurol 525(17):3742–3756. [DOI] [PMC free article] [PubMed] [Google Scholar]
- Fathke RL, Gabriele ML (2009) Patterning of multiple layered projections to the auditory midbrain prior to experience. Hear Res 249:36–43. [DOI] [PubMed] [Google Scholar]
- Fishell G, Rossant J, van der Kooy D (1990) Neuronal lineages in chimeric mouse forebrain are segregated between compartments and in the rostrocaudal and radial planes. Dev Biol 141:70–83. [DOI] [PubMed] [Google Scholar]
- Gabriele ML, Brunso-Bechtold JK, and Henkel CK (2000) Plasticity in the development of afferent patterns in the inferior colliculus of the rat after unilateral cochlear ablation. J Neuroscience 20(18):6939–6949. [DOI] [PMC free article] [PubMed] [Google Scholar]
- Gabriele ML, Brubaker DQ, Chamberlain KA, Kross KM, Simpson NS, Kavianpour SM (2011) EphA4 and ephrin-B2 expression patterns during inferior colliculus projection shaping prior to experience. Dev Neurobiol 71:182–199. [DOI] [PubMed] [Google Scholar]
- Gay SM, Brett CA, Stinson JPC, Gabriele ML (2018) Alignment of EphA4 and ephrin-B2 expression patterns with developing modularity in the lateral cortex of the inferior colliculus. J Comp Neurol 526(16):2706–2721. [DOI] [PMC free article] [PubMed] [Google Scholar]
- Gerfen CR (1985). The neostriatal mosaic. I. Compartmental organization of projections from the striatum to the substantia nigra in the rat. J Comp Neurol 236:454–476. [DOI] [PubMed] [Google Scholar]
- Gerfen CR (1989). The neostriatal mosaic: Striatal patch-matrix organization is related to cortical lamination. Science 246:385–388. [DOI] [PubMed] [Google Scholar]
- Gerfen CR (1992) The neostriatal mosaic: multiple levels of compartmental organization in the basal ganglia. Annu Rev Neurosci 15:285–320. [DOI] [PubMed] [Google Scholar]
- Gerfen CR, Baimbridge KG, Miller JJ (1985) The neostriatal mosaic: compartmental distribution of calcium-binding protein and parvalbumin in the basal ganglia of the rat and monkey. Proc Natl Acad Sci 82:8780–8784. [DOI] [PMC free article] [PubMed] [Google Scholar]
- Herkenham M, Pert CB (1981). Mosaic distribution of opiate receptors, parafascicular projections and acetylcholinesterase in rat striatum. Nature 291:415–418. [DOI] [PubMed] [Google Scholar]
- Illing RB (1996) The mosaic architecture of the superior colliculus. Prog Brain Res 12:17–34. [DOI] [PubMed] [Google Scholar]
- Illing RB, Graybiel AM (1985) Convergence of afferents from frontal cortex and substantia nigra onto acetylcholinesterase-rich patches of the cat’s superior colliculus. Neurosci 14:455–482. [DOI] [PubMed] [Google Scholar]
- Janis LS, Cassidy RM, Kromer LF (1999) Ephrin-A binding of EphA receptor expression delineate the matrix compartment of the striatum. J Neurosci 19:4962–4971. [DOI] [PMC free article] [PubMed] [Google Scholar]
- Kavusak EK, Stinson JPC, Lamb-Echegaray ID, Gay SM, Gabriele ML (2019) Early targeting of lateral cortex of the inferior colliculus modular fields by descending somatosensory cortical projections. Assoc Res Otolaryngol Mtg PS-336. [Google Scholar]
- Klein R (2012) Eph/ephrin signalling during development. Development 139(22):4105–4109. [DOI] [PubMed] [Google Scholar]
- Klein R, Kania A (2014) Ephrin signalling in the developing nervous system. Curr Opin Neurobiol 27:16–24. [DOI] [PubMed] [Google Scholar]
- Lesicko AM, Hristova TS, Maigler KC, Llano DA (2016) Connectional modularity of top-down and bottom-up multimodal inputs to the lateral cortex of the mouse inferior colliculus. J Neurosci 36:11037–11050. [DOI] [PMC free article] [PubMed] [Google Scholar]
- Luo L, Flanagan JG (2007) Development of continuous and discrete neural maps. Neuron. 56(2):284–300. [DOI] [PubMed] [Google Scholar]
- Mana S, Chevalier G (2001) Honeycomb-like structure of the intermediate layers of the rat superior colliculus: afferent and efferent connections. Neurosci 103:673–693. [DOI] [PubMed] [Google Scholar]
- Passante L, Gaspard N, Degraeve M, Frisén J, Kullander K, De Maertelaer V, Vanderhaeghen P (2008) Temporal regulation of ephrin/Eph signalling is required for the spatial patterning of the mammalian striatum. Development 135(19):3281–3290. [DOI] [PubMed] [Google Scholar]
- Paxinos G, Halliday GM, Koutcherov Y, Wang H, Watson C (2007) Atlas of the developing mouse brain: E17.5, P0 and P6. Academic Press, London. [Google Scholar]
- Saldaña E, Aparicio MA, Fuentes-Santamaría V, Berrebi AS (2009) Connections of the superior paraolivary nucleus of the rat: projections to the inferior colliculus. Neuroscience 163(1):372–387. [DOI] [PMC free article] [PubMed] [Google Scholar]
- Saldaña E, Feliciano M, Mugnaini E (1996) Distribution of descending projections from primary auditory neocortex to inferior colliculus mimics the topography of intracollicular projections. J Comp Neurol 37:15–40. [DOI] [PubMed] [Google Scholar]
- Saldaña E, Merchán MA (1992) Intrinsic and commissural connections of the rat inferior colliculus. J Comp Neurol 319:417–437. [DOI] [PubMed] [Google Scholar]
- St John JA, Pasquale EB, Key B (2002) EphA receptors and ephrin-A ligands exhibit highly regulated spatial and temporal expression patterns in the developing olfactory system. Brain Res Dev Brain Res 138(1):1–14. [DOI] [PubMed] [Google Scholar]
- Stebbings KA, Lesicko AM, Llano DA (2014) The auditory corticocollicular system: Molecular and circuit-level considerations. Hear Res 314:51–59. [DOI] [PMC free article] [PubMed] [Google Scholar]
- Stinson JPC, Lamb-Echegaray ID, Gabriele ML (2019) Extramodular ephrin-B3 expression in the lateral cortex of the inferior colliculus in neonatal mice. Assoc Res Otolaryngol Mtg, PS-334. [Google Scholar]
- Tai AX, Cassidy RM, Kromer LF (2013) EphA7 expression identifies a unique neuronal compartment in the rat striatum. J Comp Neurol 521:2663–2679. [DOI] [PubMed] [Google Scholar]
- Tai AX, Kromer LF (2014) Corticofugal projections from medial primary somatosensory cortex avoid EphA7-expressing neurons in striatum and thalamus. Neurosci 274:409–418. [DOI] [PubMed] [Google Scholar]
- Tamamaki N, Yanagawa Y, Tomioka R, Miyazaki J, Obata K, Kaneko T (2003) Green fluorescent protein expression and colocalization with calretinin, parvalbumin, and somatostatin in the GAD67-GFP knock-in mouse. J Comp Neurol 467:60–79. [DOI] [PubMed] [Google Scholar]
- Torii M, Hackett TA, Rakic P, Levitt P, Polley DB (2013) EphA signaling impacts development of topographic connectivity in auditory corticofugal systems. Cereb Cortex 23:775–785. [DOI] [PMC free article] [PubMed] [Google Scholar]
- Treffy RW, Collins D, Hoshino N, Ton S, Katsevman GA, Oleksiak M, Runge EM, Cho D, Russo M, Spec A, Gomulka J, Henkemeyer M, Rochlin MW (2016). Ephrin-B/EphB signaling is required for normal innervation of lingual gustatory papillae. Dev Neurosci 38:124–138. [DOI] [PMC free article] [PubMed] [Google Scholar]
- Tritsch NX, Yi E, Gale JE, Glowatzki E, Bergles DE (2007) The origin of spontaneous activity in the developing auditory system. Nature 450(7166):50–55. [DOI] [PubMed] [Google Scholar]
- Tritsch NX, Bergles DE (2010) Developmental regulation of spontaneous activity in the Mammalian cochlea. J Neurosci 30(4):1539–1550. [DOI] [PMC free article] [PubMed] [Google Scholar]
- van der Kooy D, Fishell G (1987) Neuronal birthdate underlies the development of striatal compartments. Brain Res 401:155–161. [DOI] [PubMed] [Google Scholar]
- Wallace MM, Harris JA, Brubaker DQ, Klotz CA, Gabriele ML (2016) Graded and discontinuous EphA-ephrinB expression patterns in the developing auditory brainstem. Hear Res 335:64–75. [DOI] [PMC free article] [PubMed] [Google Scholar]
- Wallace MM, Kavianpour SM, Gabriele ML (2013) Ephrin-B2 reverse signaling is required for topography but not pattern formation of lateral superior olivary inputs to the inferior colliculus. J Comp Neurol. 521(7)1585–1597. [DOI] [PMC free article] [PubMed] [Google Scholar]
- Wallace MN (1986a) Spatial relationship of histochemically demonstrable patches in the mouse superior colliculus. Exp Brain Res 62:241–249. [DOI] [PubMed] [Google Scholar]
- Wallace MN (1986b) Spatial relationship of NADPH-diaphorase and acetylcholinesterase lattices in the rat and mouse superior colliculus. Neurosci 19:381–391. [DOI] [PubMed] [Google Scholar]
- Wallace MN, Fredens K (1989) Relationship of afferent inputs to the lattice of high NADPH-diaphorase activity in the mouse superior colliculus. Exp Brain Res 78:435–445. [DOI] [PubMed] [Google Scholar]
- Wiberg M, Blomqvist A (1984) The projection to the mesencephalon from the dorsal column nuclei. An anatomical study in the cat. Brain Res 311:225–244. [DOI] [PubMed] [Google Scholar]
- Winer JA, Larue DT, Diehl JJ, Hefti BJ (1998) Auditory cortical projections to the cat inferior colliculus. J Comp Neurol 400:147–174. [PubMed] [Google Scholar]
- Xu Q, Mellitzer G, Robinson V, Wilkinson DG. (1999) In vivo cell sorting in complementary segmental domains mediated by Eph receptors and ephrins. Nature 399(6733):267–271. [DOI] [PubMed] [Google Scholar]


