Abstract
Purpose
H7N9 is an emerging pathogen with associated morbidity and mortality, and a broader understanding of the chest radiographic characteristics associated with human H7N9 infections is needed. This study was performed to determine the time course of recovery from lymphocytopenia and resolution of pneumonitis of critical H7N9 infection patients.
Materials and methods
We performed chest X-ray and computed tomography (CT) for patients with H7N9 influenza. Lesion patterns, distributions, and changes at follow-up chest X-ray and/or CT were investigated. The time to progression on chest CT image, and the time to resolution of the chest CT findings were assessed.
Results
Lymphocytopenia was a common laboratory test abnormality. The most common CT findings were lobar consolidation with air bronchogram and ground-glass opacities. For 7 recovering patients, the time to resolution of the chest CT findings was 10–90 days. Fibrosis and traction bronchiectasis were the main features on the CT scans of recovering patients. Interestingly, the time to recovery from lymphopenia was highly consistent with time to resolution of the chest CT findings.
Conclusions
We have shown the presence of radiographic abnormalities among H7N9 patients. Monitoring of the variation of lymphocytes for H7N9 patients has important clinical significance, especially for prediction of the resolution of pneumonitis.
Keywords: H7N9, Pneumonia, Computed tomography, Lymphocytopenia
Introduction
Avian influenza is an infectious poultry disease caused by avian influenza A viruses, which are classified as low pathogenicity avian influenza A (LPAI) and high pathogenicity avian influenza A (HPAI) viruses. Cross-species poultry-to-person transmission of this new avian influenza H7N9 virus can result in severe and fatal respiratory diseases, for example acute respiratory distress syndrome (ARDS), among humans. Gao reported the clinical characteristics of affected patients. Fever and cough were the most common symptoms; 98 of 111 patients (88.3 %) had lymphocytopenia and 44 (39.6 %) had thrombocytopenia [1]. Bilateral ground-glass opacities and consolidation were typical radiology findings [2]. In this work we investigated CT image changes and persistence of lymphocytopenia, to determine the correlation with resolution of pneumonitis and recovery from lymphocytopenia.
Materials and methods
Patients
Eleven patients were diagnosed with H7N9 infection from April 1 to April 20, 2013. Of these patients, 10 were male and 1 was female. Their age was in the range of 20–77 years, median of 69 years. Diagnosis of H7N9 infection was by positive test for H7N9 viral RNA. In accordance with guidelines from the influenza A H7N9 clinic program published by the National Health and Family Planning Commission of P.R. China (2nd edition, 2013), we considered patients critically according to the criteria:
pneumonia with two or more complications, for example acute respiratory distress syndrome, heart failure, renal failure, septic shock, encephalopathy, and secondary infections; and
no improvement of at least one of these complications after 3 days of active treatment.
Treatment
All patients were treated by oral administration of oseltamivir. Patients were also given antibiotics on the basis of s from blood and/or sputum tests for bacterial infections. If no specific bacterial pathogens were detected from, empirical treatment was considered. Antibiotics given to patients included moxifloxacin, sulbactam and cefoperazone, levofloxacin, meropenem, piperacillin, imipenem, and cilastatin. Some patients also received glucocorticoid therapy, continuous renal replacement therapy (CRRT), and mechanical ventilation therapy.
Initial assessment of CT abnormality
The initial radiographs were evaluated for the pattern, distribution, and extent of abnormality. Initial chest CT examinations selected to assign CT lesion scores were performed 4–7 days (median 5.5 days) after the onset of the clinical symptoms. To quantify the extent of the disease, a CT score was assigned to each lung and each lobe, on the basis of the size of the infected area. The score ranged from 0 to 5, with score 0 for no infected area, 1 for less than 5 %, 2 for 6–25 %, 3 for 26–50 %, 4 for 51–75 %, and 5 for more than 75 %. This scoring system was an adaptation of a method previously used to describe idiopathic pulmonary fibrosis and severe acute respiratory syndrome (SARS) [3].
Follow-up
Each patient received at least one chest CT examination, and 7 cured patients received follow-up chest CT examinations. The interval between two CT examinations was 7.54 ± 4.82 days (range 2–23 days). For the follow-up cases, the last chest CT examinations were selected to assign CT lesion scores. The time to onset of progress on image and the time to remarkable absorption on CT were assessed.
Correlation of leukocyte count and resolution of the chest CT findings
Among 7 cured patients, the time to onset of lymphocytopenia recovery and the time to CT resolution were analyzed. The Spearman rank test was used to determine correlations between CT absorption and T cell numbers. A p value <0.05 was regarded as statistically significant. Analysis was performed by use of SPSS (Chicago, IL, USA) software version 10.0.
Results
Demographic characteristics and clinical features
Eleven patients with confirmed laboratory diagnoses of influenza were enrolled in this study. The baseline characteristics of the patients are summarized in Table 1. Four patients died during the course of the study.
Table 1.
Basic characteristics of patients with severe H7N9
| Variable | N = 11 |
|---|---|
| Age, median, years | 69 |
| Male/female, n | 10/1 |
| Co-morbidities | |
| Hypertension | 7 |
| Diabetes | 4 |
| COPD | 3 |
| Anomalous pulmonary venous connection | 1 |
| Chronic hepatitis B | 1 |
| Chronic nephritis | 1 |
| Deep vein thrombosis of lower extremity | 1 |
| Hyperuricemia | 1 |
| Thymomas | 1 |
| Patients using oseltamivir, n (%) | 11 (100 %) |
| Patients receiving combined glucocorticoid therapy, n (%) | 11 (100 %) |
| Number of patients using ventilation, n (%) | 9 (81.82 %) |
| Death toll, n (%) | 4 (36.37 %) |
Lymphocytopenia among patients
On admission (Table 2), all had lymphocytopenia (100 %), white cell counts were not changed for 8 patients (72.73 %), 4 patients had thrombocytopenia (36.37 %), and no patients had anemia (Table 2). The time lymphopenia persisted ranged from 10 to 72 days (median 32.5 days, n = 7) among those surviving.
Table 2.
Peripheral blood cell count tests of 11 infected patients
| Laboratory tests | Value |
|---|---|
| White blood cells (109/L) | |
| Median | 5.27 |
| Interquartile range | 3.36–18.13 |
| Subgroup-no. (%) | |
| >10 | 2 |
| <4 | 2 |
| Platelet cells (109/L) | |
| Median | 103 |
| Interquartile range | 69–265 |
| Subgroup-no. (%) | |
| >300 | 0 |
| <100 | 4 |
| Neutrophils (109/L) | |
| Median | |
| Interquartile range | 2.24–16.75 |
| Subgroup-no. (%) | |
| >7.0 | 10 |
| <2.0 | 0 |
| Lymphocytes (109/L) | |
| Median | 0.55 |
| Interquartile range | 0.16–0.85 |
| Subgroup-no. (%) | |
| >4.0 | 0 |
| <1.0 | 10 |
CT image assessment
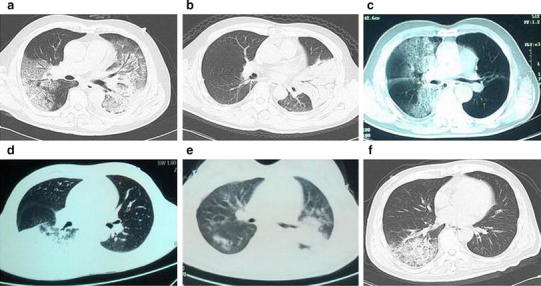
At initial presentation, the lung lesions involved two or more lobes for 6 cases, being bilateral for 5 cases. For most of the patients (10/11), 2 segments were involved. The lung abnormalities consisted of consolidations (8/11), air bronchograms (8/11), and ground-glass opacities (GGO) (6/11) (Fig. 1). The median total CT score was 3. The lower lobes were involved for 8 patients (72.73 %), the upper lobes were involved for 8 cases (72.73 %). The severity of residual radiological abnormalities, measured as CT score per unit segment involved, was 3.8 ± 0.39 for the upper lobes and 4.3 ± 0.30 for the lower lobes, with no significant differences observed (P = 0.32). It is suggested the lung lesions were distributed randomly and there was no lobar dominance.
Fig. 1.

Initial presentation of CT for patients with H7N9 infection. Representative CT images were from six cases. The lung lesions involved two or more lobes in a and e, being bilateral in both. The main lung abnormalities consisted of consolidations and air bronchograms (a–f), and ground-glass opacities (a, c, and e)
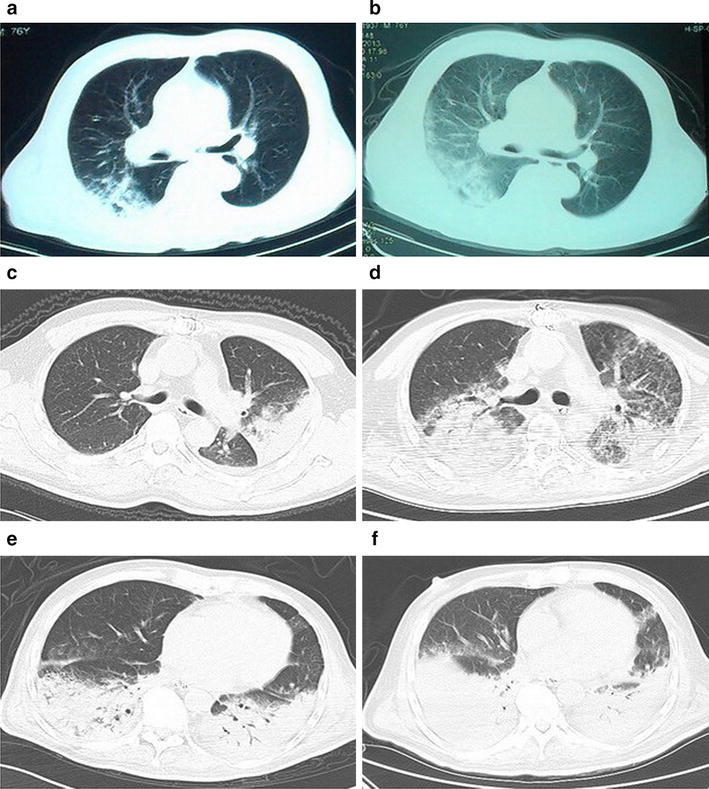
Eight patients developed ARDS between days 1 and 6 (mean, day 3) after disease onset. Rapidly progressive consolidations with air bronchograms were the main imaging findings in follow-up CT of H7N9 pneumonia; these rapidly developed in the contralateral lung (Fig. 2).
Fig. 2.

Representative and progressive CT images of findings of pneumonia among patients with H7N9 infection. a, b CT showed progressive consolidation, with ground-glass opacity in b. c, d CT showed a marked increase in the extent of ground-glass opacity and consolidation, especially, with bilateral involvement in d. e, f CT showed progressive consolidation in the lower lobes of the lung, with bilateral involvement in f
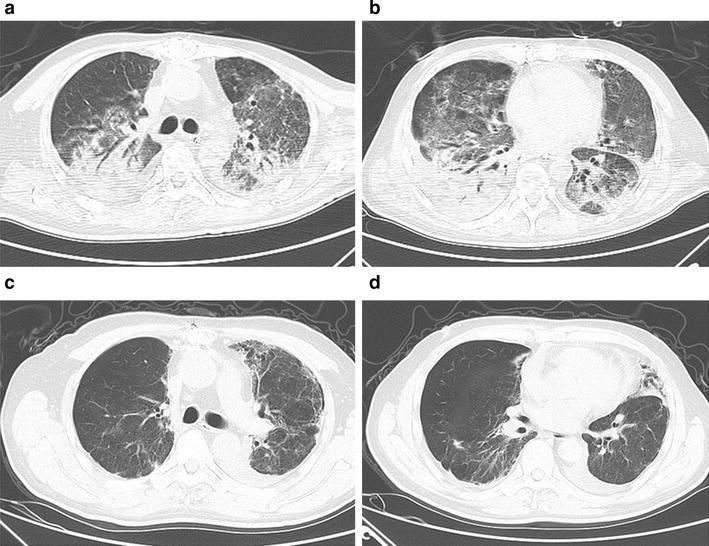
Recovery, as apparent from CT images, was a slow process for patients with severe disease. For 7 recovering patients, the time to onset of resolution of pneumonitis on CT images was 10–90 days. Decreases in the extent of consolidation, air bronchograms, and ground-glass opacities were found (Fig. 3).
Fig. 3.

Fifty-four-year-old man with laboratory-confirmed novel influenza A (H7N9). a, b CT shows bilateral consolidation, air bronchograms, and ground-glass opacities. c, d follow-up CT scan shows obviously improvement of abnormality and occurrence of secondary fibrosis and traction, for example bronchiectasis
At the follow-up examination, all recovering patients had secondary fibrosis and traction bronchiectasis on their last follow-up CT examinations. The longest follow-up period for CT examinations was approximately 32 weeks after onset. At that time the CT images were still showing different extents of secondary fibrosis but no consolidations or ground-glass opacities (Fig. 3).
Lymphopenia and pneumonitis resolution
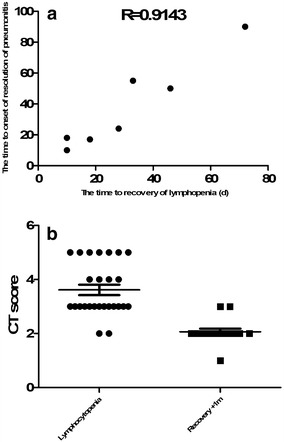
For recovering patients (n = 7), time to recovery from lymphopenia was 10–72 days. There was a direct correlation between time to recovery from lymphopenia and the time to onset of resolution of pneumonitis on CT images (r = 0.9143, P < 0.05, Fig. 4a). Our data also showed that the CT score of lung abnormalities during lymphopenia was significantly higher than that during recovery (P < 0.05, Fig. 4b).
Fig. 4.

a Correlation of total lymphocytes cell counts with CT absorption for H7N9 patients. b CT score for lung abnormalities during lymphopenia and recovery
Discussion
H7N9 influenza is a new emerging infection with high mortality. Both chest radiography and computed tomography have advantages when assessing such patients. Although some reports have included chest CT findings associated with human H7N9 infections, the chest radiographic characteristics of cured cases, and concomitant factors, are still of interest.
First, the most common thoracic CT findings in pandemic H7N9 were lobar consolidation with air bronchogram and GGO. The results obtained in this study indicate that such abnormal image features are common during the early stage of infection but are not special for the novel avian-origin influenza A strain H7N9; these features do not, therefore, to enable definitive differentiation of H7N9 infection from those of other viruses [3, 4].
Second, rapidly progressive GGO, consolidations with air bronchogram are the main imaging findings in follow-up CT scans. Follow-up CT for 11 patients revealed improvement (7 patients) or worsening (4 patients) of the lesions since the initial CT. For 7 recovering patients, the time to resolution of the chest CT findings was 10–90 days. During recovery, follow-up CT images revealed a decreasing frequency of most CT findings but with no particular order. Among 7 recovering severe pneumonia patients, residual deficits in the structure of the respiratory system occurred. Secondary fibrosis and traction, for example bronchiectasis, were the main features of chest CT scan among surviving H7N9 patients; this is a common outcome of ARDS.
Interestingly, lymphopenia is common finding on examination of H7N9 patients. An early study of SARS showed that T lymphocyte numbers and their subpopulations were highly correlated with HRCT score [4, 5]. Animal studies have also found that CD4+ T, CD8+ T, and CD19+ B cells reach peak values within 5–6 days of swine-origin influenza A virus (S-OIV) infection. CD4+ and CD8+ T cells are related to viral immunity and lack of these cells would lead to a delay in viral clearance and increased mortality [6, 7]. In our study, it is hypothesized that lack of lymphocytes could result in disease progression, then recovery from lymphopenia together with pneumonitis resolution. As support, a correlation can be established between the time to recovery from lymphopenia and the time to resolution of the chest CT findings. It is suggest that recovery from lymphopenia is accompanied by restoration of immune function, which in turn contributes to clearance of the virus and improvement of condition.
Our study is limited by small sample size and might, therefore, incur a type II error. Further studies with larger sample sizes are needed to verify and extend our findings. In conclusion, we have shown that significant radiographic abnormalities occur in H7N9 patients; when accompanied by dynamic lymphocyte cell change these could be associated with resolution of pneumonitis during H7N9 recovery. Our results indicate lymphopenia is a feature of H7N9 swine-origin influenza A virus pneumonia and confirm its potential usefulness as a marker for monitoring treatment response; it is also suitable for discriminating between disease and disease-free periods.
Acknowledgments
This work was supported by a project of the Department of Health of Jiangsu Province (H201208) and by the Natural Science Foundation of Jiangsu Province University (13KJB320021).
Compliance with ethical standards
Conflict of interest
None.
Contributor Information
Cheng Chen, Email: 210332029@suda.edu.cn.
Jun Chen, Email: szcj69@sina.com.
Jian-An Huang, Phone: 86-512-67780356, Email: huang_jian_an@163.com.
References
- 1.Gao HN, Lu HZ, Cao B, Du B, Shang H, Gan JH, Lu SH, Yang YD, Fang Q, Shen YZ, Xi XM, Gu Q, Zhou XM, Qu HP, Yan Z, Li FM, Zhao W, Gao ZC, Wang GF, Ruan LX, Wang WH, Ye J, Cao HF, Li XW, Zhang WH, Fang XC, He J, Liang WF, Xie J, Zeng M, Wu XZ, Li J, Xia Q, Jin ZC, Chen Q, Tang C, Zhang ZY, Hou BM, Feng ZX, Sheng JF, Zhong NS, Li LJ. Clinical findings in 111 cases of influenza A (H7N9) virus infection. N Engl J Med. 2013;368:2277–2285. doi: 10.1056/NEJMoa1305584. [DOI] [PubMed] [Google Scholar]
- 2.Wang Q, Zhang Z, Shi Y, Jiang Y. Emerging H7N9 influenza A (novel reassortant avian-origin) pneumonia: radiologic findings. Radiology. 2013;268:882–889. doi: 10.1148/radiol.13130988. [DOI] [PubMed] [Google Scholar]
- 3.Ng CK, Chan JW, Kwan TL, To TS, Chan YH, Ng FY, Mok TY. Six month radiological and physiological outcomes in severe acute respiratory syndrome (SARS) survivors. Thorax. 2004;59:889–891. doi: 10.1136/thx.2004.023762. [DOI] [PMC free article] [PubMed] [Google Scholar]
- 4.Wang CH, Liu CY, Wan YL, Chou CL, Huang KH, Lin HC, Lin SM, Lin TY, Chung KF, Kuo HP. Persistence of lung inflammation and lung cytokines with high-resolution CT abnormalities during recovery from SARS. Respir Res. 2005;11(6):42. doi: 10.1186/1465-9921-6-42. [DOI] [PMC free article] [PubMed] [Google Scholar]
- 5.Chi Y, Zhu Y, Wen T, Cui L, Ge Y, Jiao Y, Wu T, Ge A, Ji H, Xu K, Bao C, Zhu Z, Qi X, Wu B, Shi Z, Tang F, Xing Z, Zhou M. Cytokine and chemokine levels in patients infected with the novel avian influenza A (H7N9) virus in China. J Infect Dis. 2013;208:1962–1967. doi: 10.1093/infdis/jit440. [DOI] [PubMed] [Google Scholar]
- 6.Tse GM, To KF, Chan PK, Lo AW, Ng KC, Wu A, Lee N, Wong HC, Mak SM, Chan KF, Hui DS, Sung JJ, Ng HK. Pulmonary pathological features in coronavirus associated severe acute respiratory syndrome (SARS) J Clin Pathol. 2004;57:260–265. doi: 10.1136/jcp.2003.013276. [DOI] [PMC free article] [PubMed] [Google Scholar]
- 7.Lange E, Kalthoff D, Blohm U, Teifke JP, Breithaupt A, Maresch C, Starick E, Fereidouni S, Hoffmann B, Mettenleiter TC, Beer M, Vahlenkamp TW. Pathogenesis and transmission of the novel swine-origin influenza virus A/H1N1 after experimental infection of pigs. J Gen Virol. 2009;90:2119–2123. doi: 10.1099/vir.0.014480-0. [DOI] [PubMed] [Google Scholar]


