

Abstract
In this study, the relative synonymous codon usage (RSCU) values, effective number of codon (ENC) values, nucleotide contents, and dinucleotide were used to investigate codon usage pattern of each protein-coding gene and genome among 31 Newcastle disease virus (NDV) isolates. The result shows that the overall extent of codon usage bias in NDV is low (mean ENC = 56.15 > 40). The good correlation between the (C + G)12% and (G + C)3% suggests that the mutational pressure, rather than natural selection, is the main factor that determines the codon usage bias and base component in NDV. It is observed that synonymous codon usage pattern in NDV genes is gene function and geography specific, but not host specific. By contrasting synonymous codon usage patterns of different NDV isolates, we suggest that more than one genotype of NDV circulates in waterfowl in USA; and gene length has no significant effect on the variations of synonymous codon usage in these virus genes. CpG under-represented is a characteristic for NDV to fit in its host. These results not only provide an insight into the variation of codon usage pattern among the genomes of NDV, but also may help in understanding the processes governing the evolution of NDV.
Electronic supplementary material
The online version of this article (doi:10.1007/s11262-011-0574-z) contains supplementary material, which is available to authorized users.
Keywords: NDV, Synonymous codon usage, ENC, Dinucleotide, Evolution
Introduction
When molecular sequence data started to be accumulated nearly 20 years ago, it was noted that synonymous codons were not used equally in different genomes, even in different genes of the same genome [1–3]. As an important evolutionary phenomenon, it is well known that synonymous codon usage bias exists in a wide range of biological systems from prokaryotes to eukaryotes [4, 5]. Codon usage analysis has been applied to prokaryote and eukaryote, such as Escherichia coli, Bacillus subtilis, Saccharomyces cerevisiae, Caenorhabditis elegans, and human beings [6–9]. These observed patterns in synonymous codon usage varied among genes within a genome, and among genomes. The codon usage is attributable to the equilibrium between natural selection and mutation pressure [10, 11]. Recent studies of viral codon usage have shown that mutation bias may be a more important factor than natural selection in determining codon usage bias of some viruses, such as Picornaviridae, Pestivirus, plant viruses, and vertebrate DNA viruses [10, 12–14]. Meanwhile, lots of evidences prove that codons using abundant tRNA are selectively favored, especially in highly expressed genes [14, 15]. Recently, it was also suggested that codon usage was related to gene function and used to estimate the extent of bias toward codons that were known to be preferred in highly expressed genes [16, 17]. Analytical method of codon usage including the codon adaptation index (CAI), the G + C content at different position, the relative synonymous codon usage (RSCU) and the effective number of codon (ENC) can reveal much about the molecular evolution or individual genes of the viruses [18–20]. Such information may also help to understand the regulation of viral gene expression.
Newcastle disease virus (NDV), known as avian paramyxovirus-1 (APMV-1), is classified into Avulavirus genus of the Paramyxoviridae family. This family also includes important viruses such as Mumps virus, human parainfluenza virus, Sendai virus, Simian virus 5, and recently emerged Nipah virus and Hendra virus [21]. NDV has a broad host range and is known to infect over 200 bird species [22]. The viral genome, which is an enveloped, non-segmented, negative-stranded RNA virus consisting of approximately 13 kb coding region and 2 kb non-coding region, encodes six major structural proteins: nucleocapsid (NP), phosphoprotein (P), large protein (L), envelope matrix protein (M), hemagglutinin-neuraminidase (HN), fusion (F) proteins, and also a seventh protein (V) that is produced by a frame shift within the P coding region. They are arranged in the order 3′-NP-P-M-F-HN-L-5′ [23–25].
The codon usage pattern about the NH gene of 13 NDV strains at 1949–1989 revealed that the sequence variability appeared to reflect some accumulation of mutations over time [26]. In this study, it was the first report that codon usage indexes, including ENC, RSCU, the preferred codon and dinucleotide were applied to recently isolated NDVs, to obtain more clues to the features of genetic evolution of NDV.
Materials and methods
Sequence data
The information of 31 NDV genomes, including the serial number (SN), length value, the isolated area, the host and GenBank accession numbers of these strains was listed in the Table 1. In addition, to compare the codon usage patterns among different viruses, two influenza A virus H5N2 genomes and eight Duck hepatitis virus (DHV) genomes were taken into account (Table 2). All of the sequences were downloaded from NCBI (http://www.ncbi.nlm.nih.gov/Genbank/) and randomly selected for considering the representative of geographic origins.
Table 1.
NDV genomes used in this study
| S no. | Strain | Lengtha | Isolation | Host | Accession no. |
|---|---|---|---|---|---|
| 1 | Chicken/China/Guangxi9/2003 | 13746 | China | chicken | DQ485230 |
| 2 | Chicken/China/Guangxi11/2003 | 13746 | China | Chicken | DQ485231 |
| 3 | zhJ-3/97 | 13746 | China | Chicken | FJ766529 |
| 4 | XD/Shandong/08 | 13746 | China | Chicken | GQ994433 |
| 5 | QH4 | 13881 | China | chicken | HM125898 |
| 6 | QG/Hebei/07 | 13746 | China | Chicken | QG994434 |
| 7 | JS/07/03/Pi | 13746 | China | pigeon | FJ766531 |
| 8 | P4 | 13746 | China | pigeon | HM063425 |
| 9 | ZJ1 | 13746 | China | Waterfowl | AF431744 |
| 10 | WDK/JX/7793/2004 | 13746 | China | Waterfowl | FJ751919 |
| 11 | JSD0812 | 13746 | China | Waterfowl | GQ849007 |
| 12 | W4 | 13746 | China | Waterfowl | HM063423 |
| 13 | R8 | 13881 | China | Waterfowl | HM063424 |
| 14 | ND/05/028 | 13746 | China | unclear | GQ338311 |
| 15 | Cockatoo/Indonesia/14698/90 | 13746 | Indonesia | parrot | AY562985 |
| 16 | Chicken/N.Ireland/Ulster/67 | 13881 | Ireland | chicken | AY562991 |
| 17 | NDV-4/chicken/Namakkal/Tamil Nadu/India | 13746 | India | chicken | HM357251 |
| 18 | 2K3/Chennai/Tamil Nadu | 13746 | India | pigeon | FJ986192 |
| 19 | Dove/Italy/2736/00 | 13764 | Italy | pigeon | GQ429293 |
| 20 | BHG/Sweden/94 | 13788 | Sweden | Waterfowl | GQ918280 |
| 21 | LaSota | 13764 | Netherlands | Chicken | AF077761 |
| 22 | NDV/Chicken/Egypt/1/2005 | 13746 | Egypt | chicken | FJ919313 |
| 23 | rAnhinga | 13746 | USA | Chicken | EF065682 |
| 24 | Mallard/US(MN)/MN00-39/2000 | 13881 | USA | Waterfowl | GQ288392 |
| 25 | Northern pintail/US(OH)/87-486/1987 | 13881 | USA | Waterfowl | GQ288378 |
| 26 | Cormorant/US(WI)/18719-03(USGS)/2003 | 13746 | USA | Waterfowl | GQ288385 |
| 27 | Cormorant/US(NV)/19529-04(USGS)/2005 | 13746 | USA | Waterfowl | GQ288386 |
| 28 | Cormorant/US(MN)/92-40140/1992 | 13746 | USA | Waterfowl | GQ288387 |
| 29 | Mallard/US(MN)/00-376/1999 | 13881 | USA | Waterfowl | GQ288389 |
| 30 | Mottled duck/US(TX)/01-130/2001 | 13881 | USA | Waterfowl | GQ288391 |
| 31 | Mixed species/U.S./Largo/71 | 13746 | USA | mixed | AY562990 |
aThe length values were excluding non-coding sequence, and the units was bp
Table 2.
H5N2 and DHV genes used in this study
| Virus | Strain | Description | Accession no. |
|---|---|---|---|
| H5N2 | A/mallard/Sweden/74/2003(H5N2) | HA | CY076929 |
| NA | Cy076531 | ||
| M1 | CY076930 | ||
| M2 | CY076930 | ||
| NP | CY076932 | ||
| PA | CY076934 | ||
| PB1 | CY076936 | ||
| PB2 | CY076935 | ||
| NS1 | CY076933 | ||
| NS2 | CY076933 | ||
| H5N2 | A/American black duck/lllinois/08OS2688 (H5N2) | HA | CY079452 |
| NA | CY079454 | ||
| M1 | CY079453 | ||
| M2 | CY079453 | ||
| NP | CY079455 | ||
| PA | CY079457 | ||
| PB1 | CY079459 | ||
| PB2 | CY079458 | ||
| NS1 | CY079456 | ||
| NS2 | CY079456 | ||
| DHV | DRL-62 | Serotype 1 | DQ219396 |
| DHV | AP-04114 | Serotype new | DQ812093 |
| DHV | 04G | Serotype new | EF067923 |
| DHV | C-GY | Serotype new | EU352805 |
| DHV | C-YCW | Serotype new | GU066824 |
| DHV | C-YCZ | Serotype new | GU066824 |
| DHV | C-LGJ | Serotype 1 | GU066819 |
| DHV | 1v | Serotype new | GU250782 |
Composition analysis of coding region of 31 NDV strains
In order to better understand the synonymous codon usage variation among different NDV isolates, The G + C content at the first and second codon positions [(C + G)12%] and that at the synonymous third position [(C + G)3%] were calculated by the EMBOSS CUSP program, respectively [27, 28]. The values of the G + C content at different positions were used to compare with the values of the other compositional content.
The actual and predicted values of the effective number of codon (ENC)
The ENC is used to measure the degree of departure from the equal use of synonymous codons of coding regions of NDV. The values of the ENC range from 20 to 61. The larger the extent of codon preference in a gene, the smaller the ENC value is. In an extremely biased gene where only one codon is used for each amino acid, this value would be 20; if all codons are used equally, it would be 61; and if the value of the ENC is greater than 40, the codon usage bias was regarded as a low bias [20]. The values of ENC were obtained by EMBOSS CHIPS program [29].
Genes, whose codon choice is constrained only by a mutation bias, will lie on or just below the curve of the predicted values. The predicted values of ENC were calculated as
 |
where s represents the given (G + C)3% value [30].
The calculation of the relative synonymous codon usage (RSCU)
To investigate the pattern of relative synonymous codon usage (RSCU) without the influence of amino acid composition among all samples, the RSCU values of codons in each ORF of NDV, H5N2 and DHV were calculated according to the formula of previous reports [31, 32].
 |
where gij is the observed number of the ith codon for jth amino acid which has n i type of synonymous codons. The codon with RSCU value more than 1.0 has positive codon usage bias, while the value <1.0 has relative negative codon usage bias. When RSCU value is equal to 1.0, it means that this codon is chosen equally and randomly [33, 34].
Relative dinucleotide abundance in NDV
Because dinucleotide biases could affect codon bias, the relative abundance of dinucleotides in the coding regions of NDV genomes was assessed using the method described by Karlin and Burge [10, 35]. A comparison of actual and expected dinucleotide frequencies of the 16 dinucleotides in coding region of the 31 NDV genomes was also undertaken. The odds ratio ρxy = f xy/f y f x, where f x denotes the frequency of the nucleotide X, f y denotes the frequency of the nucleotide Y, f y f x the expected frequency of the dinucleotide XY and f xy the frequency of the dinucleotide XY, etc., for each dinucleotide it was calculated. As a conservative criterion, for ρ xy > 1.23 (or <0.78), the XY pair is considered to be of over-represented (or under-represented) relative abundance compared with a random association of mononucleotides [10].
Statistical analysis
Principal component analysis (PCA) was carried out to analyze the major trend in codon usage pattern in different gene groups and different genomes excluding non-coding regions of NDV. It is a statistical method that performs linear mapping to extract optimal features from an input distribution in the mean squared error sense and can be used by self-organizing neural networks to form unsupervised neural preprocessing modules for classification problems [7]. In order to minimize the effect of amino acid composition on codon usage, each ORF is represented as a 59-dimensional vector. Each dimension corresponds to the RSCU value of one sense codon excluding Met, Trp, and the three stop codons.
Linear regression analysis was used to investigate the correlation between codon usage bias and gene length. Correlation analysis is used to identify the relationship between codon usage bias and synonymous codon usage pattern. This analysis is implemented based on the Pearson’s rank correlation analysis.
All statistical analyses were carried out using the statistical analysis software SPSS Version 17.0.
Results
The characteristics of synonymous codon usage in NDV
As shown in Table 3, the codons ending with U are favored (7 out of 18) and the global codon usage pattern is very similar among all NDV coding regions. The values of ENC among these NDVs are also very similar, and vary from 54.66 to 57.04 with a mean value of 56.15 and S.D. of 0.433 (Table 4), suggesting that the extent of codon preference in NDV genomes is less biased (mean ENC >40) and keeps at a stable level.
Table 3.
Synonymous codon usage in coding region of NDV
| AAa | Codon | RSCUb |
|---|---|---|
| Phe | UUU | 0.906 |
| UUC | 1.095 | |
| Leu | UUA | 1.062 |
| UUG | 0.818 | |
| CUU | 1.02 | |
| CUC | 1.106 | |
| CUA | 0.948 | |
| CUG | 1.046 | |
| Val | GUU | 0.485 |
| GUC | 1.132 | |
| GUA | 1.054 | |
| GUG | 1.107 | |
| Ser | UCU | 1.42 |
| UCC | 0.859 | |
| UCA | 1.334 | |
| UCG | 0.404 | |
| AGU | 0.893 | |
| AGC | 1.09 | |
| Pro | CCU | 1.267 |
| CCC | 0.786 | |
| CCA | 1.249 | |
| CCG | 0.698 | |
| Thr | ACU | 1.221 |
| ACC | 1.005 | |
| ACA | 1.447 | |
| ACG | 0.327 | |
| Gly | GGU | 0.836 |
| GGC | 0.759 | |
| GGA | 1.122 | |
| GGG | 1.284 | |
| Gln | CAA | 1.013 |
| CAG | 0.987 | |
| His | CAU | 1.212 |
| CAC | 0.788 | |
| Asn | AAU | 1.181 |
| AAC | 0.819 | |
| Lys | AAA | 0.892 |
| AAG | 1.108 | |
| Asp | GAU | 1.061 |
| GAC | 0.939 | |
| Glu | GAA | 0.877 |
| GAG | 1.123 | |
| Arg | AGA | 1.834 |
| AGG | 1.802 | |
| CGU | 0.523 | |
| CGC | 0.48 | |
| CGA | 0.604 | |
| CGG | 0.756 | |
| Cys | UGU | 1.075 |
| UGC | 0.925 | |
| Tyr | UAU | 1.075 |
| UAC | 0.925 | |
| Ala | GCU | 0.932 |
| GCC | 0.863 | |
| GCA | 1.721 | |
| GCG | 0.484 | |
| Ile | AUU | 0.918 |
| AUC | 1.143 | |
| AUA | 0.939 |
The preferentially used codons for each amino acid are described in bold
aAA is the abbreviation of amino acid
bRSCU value is the fraction of the relative synonymous codon usage
Table 4.
Identified ENC and composition in the coding region of 31 NDV genomes
| S. no. | A% | G% | U% | C% | A3% | G3% | U3% | C3% | C + G% | (C + G)12% | (C + G)3% | ENC |
|---|---|---|---|---|---|---|---|---|---|---|---|---|
| 1 | 29.42 | 22.70 | 24.00 | 23.89 | 27.63 | 20.32 | 26.61 | 25.44 | 47.94 | 49.03 | 45.76 | 56.00 |
| 2 | 29.44 | 22.63 | 23.99 | 23.93 | 27.72 | 20.19 | 26.43 | 25.66 | 48.04 | 49.14 | 45.85 | 55.60 |
| 3 | 29.22 | 22.70 | 24.47 | 23.26 | 27.44 | 20.17 | 27.28 | 25.11 | 47.6 | 48.76 | 45.28 | 55.89 |
| 4 | 29.24 | 22.80 | 24.40 | 23.55 | 27.39 | 20.28 | 27.36 | 24.97 | 47.95 | 49.30 | 45.25 | 56.38 |
| 5 | 28.53 | 23.56 | 24.10 | 23.80 | 26.25 | 21.73 | 26.30 | 25.72 | 49.19 | 50.06 | 47.45 | 56.76 |
| 6 | 29.39 | 22.59 | 24.03 | 23.98 | 27.66 | 20.14 | 26.67 | 25.54 | 47.94 | 49.07 | 45.68 | 56.48 |
| 7 | 29.50 | 22.57 | 24.31 | 23.62 | 27.88 | 20.02 | 26.91 | 25.19 | 47.42 | 48.53 | 45.21 | 56.50 |
| 8 | 29.37 | 22.70 | 24.41 | 23.53 | 27.69 | 20.22 | 27.08 | 25.01 | 47.57 | 48.75 | 45.22 | 56.40 |
| 9 | 29.43 | 22.65 | 23.90 | 24.02 | 27.57 | 20.23 | 26.65 | 25.54 | 47.98 | 49.08 | 45.78 | 56.82 |
| 10 | 29.19 | 22.81 | 24.57 | 23.43 | 27.68 | 20.26 | 27.11 | 24.94 | 47.65 | 48.87 | 45.21 | 55.63 |
| 11 | 29.47 | 22.67 | 23.75 | 24.11 | 27.80 | 20.12 | 26.40 | 25.68 | 48.19 | 49.39 | 45.80 | 55.71 |
| 12 | 29.46 | 22.66 | 24.29 | 23.58 | 27.48 | 20.48 | 26.87 | 25.16 | 47.61 | 48.60 | 45.64 | 56.74 |
| 13 | 28.65 | 23.47 | 24.00 | 23.88 | 26.71 | 21.20 | 26.04 | 26.04 | 49.06 | 49.97 | 47.24 | 56.92 |
| 14 | 29.41 | 22.66 | 24.37 | 23.57 | 27.67 | 20.40 | 27.13 | 24.8 | 47.42 | 48.53 | 45.20 | 56.26 |
| 15 | 29.36 | 22.56 | 24.29 | 23.29 | 27.89 | 19.88 | 26.78 | 25.45 | 47.61 | 48.75 | 45.33 | 56.36 |
| 16 | 28.51 | 23.43 | 24.21 | 23.86 | 26.32 | 21.37 | 26.56 | 25.76 | 48.79 | 49.63 | 47.12 | 56.26 |
| 17 | 29.09 | 22.90 | 24.56 | 23.46 | 27.00 | 20.55 | 27.54 | 24.92 | 44.65 | 44.24 | 45.47 | 57.04 |
| 18 | 28.86 | 23.30 | 24.41 | 23.43 | 26.82 | 21.24 | 27.34 | 24.59 | 48.03 | 49.13 | 45.83 | 54.66 |
| 19 | 29.58 | 22.51 | 24.51 | 23.41 | 28.14 | 19.84 | 27.35 | 24.67 | 47.36 | 48.79 | 44.51 | 55.88 |
| 20 | 29.11 | 22.99 | 24.59 | 23.31 | 27.36 | 20.59 | 27.34 | 24.71 | 48.19 | 49.64 | 45.29 | 55.81 |
| 21 | 29.18 | 22.81 | 24.69 | 23.32 | 27.44 | 20.28 | 27.49 | 24.80 | 47.75 | 49.09 | 45.07 | 56.70 |
| 22 | 29.16 | 22.84 | 24.52 | 23.49 | 27.26 | 20.39 | 27.17 | 25.18 | 47.9 | 49.07 | 45.57 | 56.28 |
| 23 | 29.63 | 22.33 | 24.28 | 23.76 | 28.57 | 19.15 | 27.42 | 24.86 | 47.37 | 49.05 | 44.02 | 55.96 |
| 24 | 28.77 | 23.16 | 24.51 | 23.56 | 26.84 | 20.69 | 27.56 | 24.92 | 44.92 | 44.58 | 45.60 | 56.45 |
| 25 | 28.89 | 23.13 | 24.46 | 23.51 | 26.75 | 20.86 | 27.37 | 25.02 | 48.41 | 49.68 | 45.88 | 55.70 |
| 26 | 29.79 | 22.11 | 24.58 | 23.51 | 28.65 | 18.99 | 27.76 | 24.60 | 47.09 | 48.84 | 43.59 | 55.96 |
| 27 | 29.88 | 22.10 | 24.58 | 23.51 | 28.59 | 19.10 | 27.59 | 24.72 | 46.43 | 47.74 | 43.82 | 56.09 |
| 28 | 29.66 | 22.31 | 24.34 | 23.68 | 28.42 | 19.31 | 27.33 | 24.94 | 47.41 | 48.99 | 44.25 | 55.88 |
| 29 | 28.82 | 23.13 | 24.57 | 23.49 | 26.92 | 20.73 | 27.54 | 24.82 | 48.2 | 49.53 | 45.54 | 54.66 |
| 30 | 28.94 | 23.17 | 24.56 | 23.43 | 27.15 | 20.63 | 27.93 | 24.30 | 48.34 | 50.05 | 44.93 | 56.12 |
| 31 | 29.23 | 22.81 | 24.44 | 23.56 | 27.56 | 20.42 | 26.91 | 25.10 | 47.75 | 48.86 | 45.53 | 56.80 |
Compositional properties of coding region of all NDV genomes
Both (C + G)% and (C + G)3% have a highly significant correlation with each of A%, U%, C%, G%, A3%, C3%, G3%, and U3%, respectively, indicating that (C + G)% and (C + G)3% may reflect some important characteristics of codon usage pattern of NDV (Table 5). Firstly, (C + G)12% was compared with (C + G)3%, a highly significant correlation was observed (Pearson r = 0.845, P < 0.01). Secondly, the (C + G)12% and (C + G)3% were used to compared with the Axis1b (calculated by PCA) which was the largest trends in codon usage among these genomes. The Axis1b is significantly correlated with the (C + G)12% (Pearson r = 0.518, P < 0.01) and (C + G)3% (Pearson r = 0.675, P < 0.01). Finally, the ENC-plot [ENC plotted against (G + C)3%] was used as a part of general strategy to investigate patterns of synonymous codon usage and all of the spots lie below the expected curve (Fig. 1). These imply that the codon bias can be explained mainly by an uneven base composition, in other words, by mutation pressure rather than natural selection.
Table 5.
Correlation analysis between the (C + G)%, (C + G)3% and A%, G%, U%, C%, A3%, G3%, U3%, C3% in the coding region of 31 NDV genomes
| A% | G% | U% | C% | A3% | G3% | U3% | C3% | ||
|---|---|---|---|---|---|---|---|---|---|
| (C + G)% | r | −0.722** | 0.718** | −0.711** | 0.574** | −0.613** | 0.615** | −0.457** | 0.426* |
| p | <0.001 | <0.001 | <0.001 | 0.001 | <0.001 | <0.001 | 0.01 | <0.05 | |
| (C + G)3% | r | −0.622** | 0.643** | −0.806** | 0.713** | −0.656** | 0.647** | −0.652** | 0.698** |
| p | <0.001 | <0.001 | <0.001 | <0.001 | <0.001 | <0.001 | <0.001 | <0.001 |
**P < 0.01, * 0.01 < P < 0.05
Fig. 1.
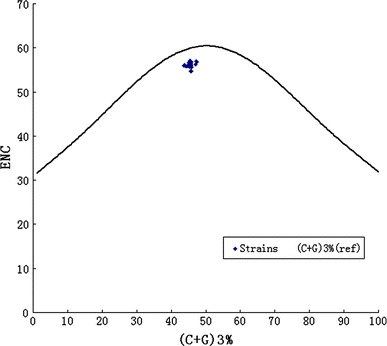
Graphs showing the relationship between the effective number of codons (ENC) and the GC content of the third codon position (GC3). The curve indicates the expected codon usage if GC compositional constraints alone account for codon usage bias
Effect of other potential factors on codon usage
From PCA of each gene groups of all NDV, we could detect one major trend in the first axis (Axis1a) accounting for 20.59% of the total variation, and another major trend in the second axis (Axis2a) for 15.94% of the total variation. A plot of the Axis1a and the Axis2a of all gene groups in NDV was shown in Fig. 2. Obviously, those genes encoding the same protein tend to come together. Moreover, gene group L has a tendency to converge tightly. Gene group P is far from the other gene groups, and gene group M was also divided from the other gene groups. These findings imply that different protein-coding genes may have different codon usage patterns. So, gene function is probably another factor accounting for codon usage variation among these virus genes.
Fig. 2.

A plot of the values of the Axis1a (20.59%) and the Axis2a (15.94%) of each ORF in principle component analysis. Those genes encoding the same protein were the same shapes
From PCA of coding region of different NDV strains, one major trend in the first axis (Axis1b) which can account for 22.96% of the total variation, and another major trend in the second axis (Axis2b) for 13.46% of the total variation was detected. A plot of the Axis1b and the Axis2b of 31 NDV samples was shown in Supplementary Fig. 1. Although this graph is a little complex, it is a sharp geographical demarcation to some extent: all the strains isolated from China tend to cluster together (except strains XD/Shandong/08), and the strains isolated from USA gather at two different places (Supplementary Fig. 1). These may indicate that geographic is another factor on codon usage bias. There is no clear division based on species of the host.
Furthermore, we also performed a linear regression analysis on ENC value and gene length of each NDV samples. However, there was no significant correlation between codon usage and gene length in these virus genes (Pearson P > 0.05).
Qualitative evaluation of codon usage bias in gene groups of NDV
There was a seemingly random variation in RSCU between amino acids and gene groups. There were several synonymous codons with strong discrepancy for codon usage in each gene group. In details, as for gene group NP, AGA for Arg, AUC for Ile, CUC for Leu, AGC for Ser was chosen preferentially; in gene group P, CCC for Ala, CAC for Asp, UGU for Cys, UUU for Phe, UAU for Trp was chosen preferentially; in gene group M, AGG for Arg, AAU for ASN, AAG for Lys, ACC for Thr was chosen preferentially; in gene group HN, GGG for Gly, UUA for Leu, ACA for Thr was chosen preferentially; in gene group F, only UCA for Ser was chosen preferentially; and in gene group L, only CCA for Pro was chosen preferentially (Fig. 3).
Fig. 3.
Comparison the codon preferences among different ORFs of NDV
The codon usage pattern among NDV, H5N2, and DHV
There were considerable differences for codon usage patterns among NDV,influenza A virus H5N2 and DHV. In details, the values of RSCU in some NDV codon such as GGG for Gly, GAG for Glu, AUC and AUU for Ile, GUA and GUC for Val were clearly different from that of the other viruses (Fig. 4).
Fig. 4.

Compare the codon usage pattern among NDV, H5N2, and DHV
The relationship between dinucleotide biases and codon usage in NDV
The frequencies of occurrence for dinucleotides were not randomly distributed and no dinucleotide was present at the expected frequencies. Only the frequency of CpG was significantly low at all codon positions for coding region of 31 NDV genomes (mean ρCG = 0.561, SD of 0.018, ρCG < 0.78) (Table 6). In addition, the RSCU values of the eight codons containing CpG (CCG, GCG, UCG, ACG, CGC, CGG, CGU, and CGA) were analyzed, to reveal the possible effects of CpG under-represented on codon usage bias. All of these eight codons were not preferential codons and suppressed markedly (Table 3).
Table 6.
Relative abundance of the 16 dinucleotides in coding region of 31 NDV
| Dinucleotides | Rangea | Mean ± SDb |
|---|---|---|
| AA | 0.879–0.934 | 0.903 ± 0.009 |
| AG | 1.111–1.187 | 1.15 ± 0.013 |
| AT | 1.046–1.086 | 1.065 ± 0.011 |
| AC | 0.887–0.936 | 0.91 ± 0.008 |
| GA | 1.081–1.125 | 1.097 ± 0.007 |
| GG | 1.026–1.105 | 1.094 ± 0.014 |
| GT | 0.825–0.898 | 0.851 ± 0.015 |
| GC | 0.936–0.99 | 0.957 ± 0.009 |
| CA | 1.187–1.263 | 1.225 ± 0.015 |
| CG | 0.506–0.596 | 0.561 ± 0.018 |
| CT | 1.092–1.167 | 1.13 ± 0.016 |
| CC | 0.986–1.069 | 1.022 ± 0.014 |
| TA | 0.781–0.841 | 0.805 ± 0.011 |
| TG | 1.141–1.197 | 1.175 ± 0.013 |
| TT | 0.886–0.977 | 0.933 ± 0.017 |
| TC | 1.113–1.165 | 1.137 ± 0.014 |
aThe range of coding region of 31 NDV’s relative dinucleotide ratios
bMean values of coding region of 31 NDV’s relative dinucleotide ratios ± SD
Discussion
The synonymous codon usage bias in coding regions of NDV are low (mean ENC = 56.15, higher than 40) in the study. This is in agreement with previous reports about some other RNA viruses, such as BVDV, H5N1 influenza virus and SARS-covs with mean values of 51.43, 50.91, and 48.99, respectively [20, 36]. A low codon usage bias is advantageous to replicate efficiently in vertebrate host cells, with potentially distinct codon preferences.
A general mutational pressure, which affects the whole genome, would certainly account for the majority of the codon usage variation. In this study, the general association between codon usage bias and base composition suggests that mutational pressure, rather than natural selection, is mainly supported by the highly significant correlation between (C + G)12% and (G + C)3% (r = 0.845, P < 0.01), since the effects are present at all codon positions [12, 13].
It is now accepted that higher codon usage bias is advantageous to improve the level of gene expression [30, 37, 38]. Recent study had also demonstrated that protein M of NDV was necessary and sufficient for virus-like particles budding and releasing in vitro [39–41], and the high expression of protein M primarily prolonged their survival and consequently enhanced virus replication [42]. Therefore, the codon usage bias of gene group M is higher than other gene groups in NDV. This is an important mechanism for survival and replication of NDV (Fig. 2; Table 7). A highly significant difference of codon usage pattern between gene group P and other gene groups of NDV also reveals the effect of gene function. Because the gene P is unique in that transcriptional editing of its mRNA results in two nonstructural proteins, V and a potential W, among the six genes encoded in the genome [43–45]. Base on gene function, only HN and F coded the two surface glycoproteins in all gene groups of NDV [46]. From protein function, there is a physical association between virus-specific HN and F proteins (HN-F) at the cell surface [47, 48], and both HN and F proteins are important factors accounting for cell fusion in virus infection [49–51]. All above reveal some association between gene group HN and F.
Table 7.
ENC values of each gene group of NDV
| NP | P | F | M | HN | L | |
|---|---|---|---|---|---|---|
| Mean value of ENC | 54.87 | 58.90 | 57.21 | 52.91 | 57.36 | 55.66 |
| SD | 1.29 | 1.99 | 1.69 | 2.57 | 1.32 | 0.39 |
SD standard deviation
Due to geographic factors, the strains isolated from China tended to cluster together except strain XD/Shandong/08. However, further study revealed that strain XD/Shandong/08 was generated by a recombination event in the genes F, L, and non-coding region between the genes HN and L [52]. Gene recombination event is therefore another factor accounting for codon usage variation among these virus genes. Interestingly, the seven strains isolated from waterfowl in USA gathered at two distinct places; these findings reconfirm that more than one genotype of NDV circulated in waterfowl in USA [53]. It was reported that synonymous codon usage pattern in the genes of severe acute respiratory syndrome Coronavirus was virus specific and phylogenetically conserved, but it was not host specific [20]. But other reports showed that the analysis of codon usage patterns allowed identification of host origin and evolutionary trends in influenza viruses [54]. In this study, No correlation was observed between the codon usage bias and the host. Comparing with other avian viruses (H5N2 and DHV), no remarkable similarity was found in codon usage pattern of NDV. It is likely that the virus has its own characteristic of codon usage patterns.
Our study first revealed that CpG and the eight CpG-containing codons were notably deficient in coding region of NDV genome. The probably explanation for the CpG deficiency is immunologic escape. A high CpG content may be detrimental to small DNA (or RNA) viruses, as unmethylated CpGs are recognized by the host’s innate immune system (Toll-like receptor 9) as a pathogen signature [55]. The CpG deficiency is a characteristic for NDV to fit in its host.
In short, our analysis revealed that codon usage bias in NDV was low and mutational pressure was the main factor that affects codon usage variation in NDV. Other factors, such as base composition, gene function, geography, dinucleotide, and even gene recombination also significantly influence codon usage bias. No correlation has been found between codon usage and viral host. However, due to a lack of sequence data and detailed information about these isolations, a more comprehensive analysis is needed to reveal more information about other responsible factors within NDV.
Electronic supplementary material
Below is the link to the electronic supplementary material.
Supplementary Fig. 1. A plot of the values of the Axis1b (22.96%) and the Axis2a (13.45%) of 31 NDV strains in principle component analysis. Different shapes means the strains isolated from different country, and different color means strains isolated from different host. (BMP 1367 kb)
Acknowledgements
This work was supported in parts by grants from National Science & Technology Key Project (2009ZX08007-006B) and International Science & Technology Cooperation Program of China (No. 2010DFA32640) and Science and Technology Key Project of Gansu Province (No. 0801NKDA034). This study was also supported by National Natural Science foundation of China (No. 30700597 and No. 31072143).
Footnotes
Meng Wang, Yong-sheng Liu contributed equally to this work.
References
- 1.Grantham R, Gautier C, Gouy M, Mercier R, Pave A. Nucl. Acids Res. 1980;8:49–62. doi: 10.1093/nar/8.1.197-c. [DOI] [PMC free article] [PubMed] [Google Scholar]
- 2.Duret L. Curr. Opin. Genet. Dev. 2002;12:640–649. doi: 10.1016/S0959-437X(02)00353-2. [DOI] [PubMed] [Google Scholar]
- 3.Supek F, Vlahovicek K. BMC Bioinform. 2005;6:182. doi: 10.1186/1471-2105-6-182. [DOI] [PMC free article] [PubMed] [Google Scholar]
- 4.Archetti M. J. Mol. Evol. 2004;59:258–266. doi: 10.1007/s00239-004-2620-0. [DOI] [PubMed] [Google Scholar]
- 5.Liu X, Wu C, Chen AY. Arch. Virol. 2010;155:685–693. doi: 10.1007/s00705-010-0631-2. [DOI] [PubMed] [Google Scholar]
- 6.Bulmer M. J. Theor. Biol. 1988;133:67–71. doi: 10.1016/S0022-5193(88)80024-9. [DOI] [PubMed] [Google Scholar]
- 7.Kanaya S, Kinouchi M, Abe T, Yamada Y, Nishi T, Mori H, Ikemura T. Gene. 2001;27:89–99. doi: 10.1016/S0378-1119(01)00673-4. [DOI] [PubMed] [Google Scholar]
- 8.Karlin S, Mrázek J. J. Mol. Biol. 1996;262:459–472. doi: 10.1006/jmbi.1996.0528. [DOI] [PubMed] [Google Scholar]
- 9.Sharp PM, Cowe E, Higgins DG, Shield DC, Wolfe KH, Wright F. Nucl. Acids Res. 1988;16:8207–8211. doi: 10.1093/nar/16.17.8207. [DOI] [PMC free article] [PubMed] [Google Scholar]
- 10.Shackelton LA, Parrish CR, Holmes EC. J. Mol. Evol. 2006;62:551–563. doi: 10.1007/s00239-005-0221-1. [DOI] [PubMed] [Google Scholar]
- 11.Sharp PM, Stenico M, Peden JF, Lloyd AT. Biochem. Soc. Trans. 1993;21:835–841. doi: 10.1042/bst0210835. [DOI] [PubMed] [Google Scholar]
- 12.Zhong J, Li Y, Zhao S, Liu S, Zhang Z. Virus Genes. 2007;35:767–776. doi: 10.1007/s11262-007-0159-z. [DOI] [PMC free article] [PubMed] [Google Scholar]
- 13.Tao P, et al. Virus Genes. 2009;38:104–112. doi: 10.1007/s11262-008-0296-z. [DOI] [PMC free article] [PubMed] [Google Scholar]
- 14.Fu M. Arch. Virol. 2010;155:391–396. doi: 10.1007/s00705-010-0597-0. [DOI] [PubMed] [Google Scholar]
- 15.Moriyama EN, Powell JR. J. Mol. Evol. 1997;45:514–523. doi: 10.1007/PL00006256. [DOI] [PubMed] [Google Scholar]
- 16.Gu W, Zhou T, Ma J, Sun X, Lu Z. Biosystems. 2004;73:89–97. doi: 10.1016/j.biosystems.2003.10.001. [DOI] [PubMed] [Google Scholar]
- 17.Epstein RJ, Lin K, Tan TW. Gene. 2000;245:291–298. doi: 10.1016/S0378-1119(00)00042-1. [DOI] [PubMed] [Google Scholar]
- 18.Carbone A, Zinovyev A, Kepes F. Bioinformatics. 2003;19:2005–2015. doi: 10.1093/bioinformatics/btg272. [DOI] [PubMed] [Google Scholar]
- 19.Jenkins GM, Holmes EC. Virus Res. 2003;92:1–7. doi: 10.1016/S0168-1702(02)00309-X. [DOI] [PubMed] [Google Scholar]
- 20.Gu W, Zhou T, Ma J, Sun X, Lu ZH. Virus Res. 2004;101:155–161. doi: 10.1016/j.virusres.2004.01.006. [DOI] [PMC free article] [PubMed] [Google Scholar]
- 21.Ravindra PV, Tiwari AK, Sharma B, Chauhan RS. Indian J. Med. Res. 2009;130:507–513. [PubMed] [Google Scholar]
- 22.Miller PJ, Kim LM, Ip HS, Afonso CL. Virology. 2009;391:64–72. doi: 10.1016/j.virol.2009.05.033. [DOI] [PubMed] [Google Scholar]
- 23.de Leeuw O, Peeters B. J. Gen. Virol. 1999;80(Pt 1):131–136. doi: 10.1099/0022-1317-80-1-131. [DOI] [PubMed] [Google Scholar]
- 24.Aldous EW, Alexander DJ. Avian. Pathol. 2001;30:117–128. doi: 10.1080/03079450120044515. [DOI] [PubMed] [Google Scholar]
- 25.Morrison TG. Biochim. Biophys. Acta. 2003;1614:73–84. doi: 10.1016/S0005-2736(03)00164-0. [DOI] [PubMed] [Google Scholar]
- 26.Sakaguchi T, Toyoda T, Gotoh B, Inocencio NM, KUma K, Miyata T, Nagai Y. Virology. 1989;169:260–272. doi: 10.1016/0042-6822(89)90151-7. [DOI] [PubMed] [Google Scholar]
- 27.Novembre JA. Mol. Biol. Evol. 2002;19:1390–1394. doi: 10.1093/oxfordjournals.molbev.a004201. [DOI] [PubMed] [Google Scholar]
- 28.Comeron JM, Aguade M. J. Mol. Evol. 1998;47:268–274. doi: 10.1007/PL00006384. [DOI] [PubMed] [Google Scholar]
- 29.Lu H, Zhao WM, Zheng Y, Wang H, Qi M, Yu XP. Acta Biochim. Biophys. Sin. (Shanghai) 2005;37:1–10. doi: 10.1093/abbs/37.1.1. [DOI] [PMC free article] [PubMed] [Google Scholar]
- 30.Wright F. Gene. 1990;87:23–29. doi: 10.1016/0378-1119(90)90491-9. [DOI] [PubMed] [Google Scholar]
- 31.Sharp PM, Li WH. Nucl. Acids Res. 1986;14:7737–7749. doi: 10.1093/nar/14.19.7737. [DOI] [PMC free article] [PubMed] [Google Scholar]
- 32.Zhou JH, Zhang J, Chen HT, Ma LN, Liu YS. Vet. Res. Commun. 2010;34:393–404. doi: 10.1007/s11259-010-9359-4. [DOI] [PubMed] [Google Scholar]
- 33.Sharp PM, Li WH. Nucl. Acids Res. 1987;15:1281–1295. doi: 10.1093/nar/15.3.1281. [DOI] [PMC free article] [PubMed] [Google Scholar]
- 34.Gupta SK, Ghosh TG. Gene. 2001;273:63–70. doi: 10.1016/S0378-1119(01)00576-5. [DOI] [PubMed] [Google Scholar]
- 35.Haider SA, Calnek BW. Avian Dis. 1979;23:715–729. doi: 10.2307/1589748. [DOI] [PubMed] [Google Scholar]
- 36.Wang M, Zhang J, Zhou JH, Chen HT, Ma LN, Ding YZ, Liu YS. Arch. Virol. 2010;156:153–160. doi: 10.1007/s00705-010-0848-0. [DOI] [PMC free article] [PubMed] [Google Scholar]
- 37.Karlin S, Mrazek J. J. Bacteriol. 2000;182:5238–5250. doi: 10.1128/JB.182.18.5238-5250.2000. [DOI] [PMC free article] [PubMed] [Google Scholar]
- 38.Fuglsang A. Biochem. Biophys. Res.Commun. 2004;317:957–964. doi: 10.1016/j.bbrc.2004.03.138. [DOI] [PubMed] [Google Scholar]
- 39.Seal BS, King DJ, Sellers HS. Dev. Comp. Immunol. 2000;24:257–268. doi: 10.1016/S0145-305X(99)00077-4. [DOI] [PubMed] [Google Scholar]
- 40.Takimoto T, Portner A. Virus Res. 2004;106:133–145. doi: 10.1016/j.virusres.2004.08.010. [DOI] [PubMed] [Google Scholar]
- 41.Pantua HD, McGinnes LW, Peeples ME, Morrison TG. J. Virol. 2006;80:11062–11073. doi: 10.1128/JVI.00726-06. [DOI] [PMC free article] [PubMed] [Google Scholar]
- 42.Wang L, Suo X, Chen FY, Zheng SJ. Acta Virol. 2009;53:105–110. doi: 10.4149/av_2009_02_105. [DOI] [PubMed] [Google Scholar]
- 43.Liang JW, Tian FL, Lan ZR, Huang B, Zhuang WZ. Vet. Microbiol. 2010;144:257–263. doi: 10.1016/j.vetmic.2009.12.029. [DOI] [PubMed] [Google Scholar]
- 44.Steward M, Samson AC, Errington W, Emmerson PT. Arch. Virol. 1995;140:1321–1328. doi: 10.1007/BF01322759. [DOI] [PubMed] [Google Scholar]
- 45.Wakamatsu N, King DJ, Seal BS, Samal SK, Brown CC. Virology. 2006;353:333–343. doi: 10.1016/j.virol.2006.06.013. [DOI] [PubMed] [Google Scholar]
- 46.Stone-Hulslander J, Morrison TG. J. Virol. 1997;71:6287–6295. doi: 10.1128/jvi.71.9.6287-6295.1997. [DOI] [PMC free article] [PubMed] [Google Scholar]
- 47.Deng R, Wang ZY, Mahon PJ, Marinello M, Mirza A, Iorio RM. Virology. 1999;253:43–54. doi: 10.1006/viro.1998.9501. [DOI] [PubMed] [Google Scholar]
- 48.Yao Q, Hu X, Compans RW. J. Virol. 1997;71:650–656. doi: 10.1128/jvi.71.1.650-656.1997. [DOI] [PMC free article] [PubMed] [Google Scholar]
- 49.Horvath CM, Paterson RG, Shaughnessy MA, Wood R, Lamb RA. J. Virol. 1992;66:4564–4569. doi: 10.1128/jvi.66.7.4564-4569.1992. [DOI] [PMC free article] [PubMed] [Google Scholar]
- 50.Malvoisin E, Wild TF. J. Gen. Virol. 1993;74(Pt 11):2365–2372. doi: 10.1099/0022-1317-74-11-2365. [DOI] [PubMed] [Google Scholar]
- 51.Takimoto T, Taylor GL, Connaris HC, Crennell SJ, Portner A. J. Virol. 2002;76:13028–13033. doi: 10.1128/JVI.76.24.13028-13033.2002. [DOI] [PMC free article] [PubMed] [Google Scholar]
- 52.Zhang R, Wang X, Su J, Zhao J, Zhang G. Virus Res. 2010;151:45–53. doi: 10.1016/j.virusres.2010.03.015. [DOI] [PubMed] [Google Scholar]
- 53.Jindal N, Chander Y, Chockalingam AK, Abin MD, Reding PT, Goyal SM. Virol. J. 2009;6:191. doi: 10.1186/1743-422X-6-191. [DOI] [PMC free article] [PubMed] [Google Scholar]
- 54.Wong EH, Smith DK, Rabadan R, Peiris M, Poon LL. BMC Evol. Biol. 2010;10:253. doi: 10.1186/1471-2148-10-253. [DOI] [PMC free article] [PubMed] [Google Scholar]
- 55.Krieg AM. Scand. J. Infect. Dis. 2003;35:653–659. doi: 10.1080/00365540310015999. [DOI] [PubMed] [Google Scholar]
Associated Data
This section collects any data citations, data availability statements, or supplementary materials included in this article.
Supplementary Materials
Supplementary Fig. 1. A plot of the values of the Axis1b (22.96%) and the Axis2a (13.45%) of 31 NDV strains in principle component analysis. Different shapes means the strains isolated from different country, and different color means strains isolated from different host. (BMP 1367 kb)