. 2020 Mar 23;9:e50927. doi: 10.7554/eLife.50927

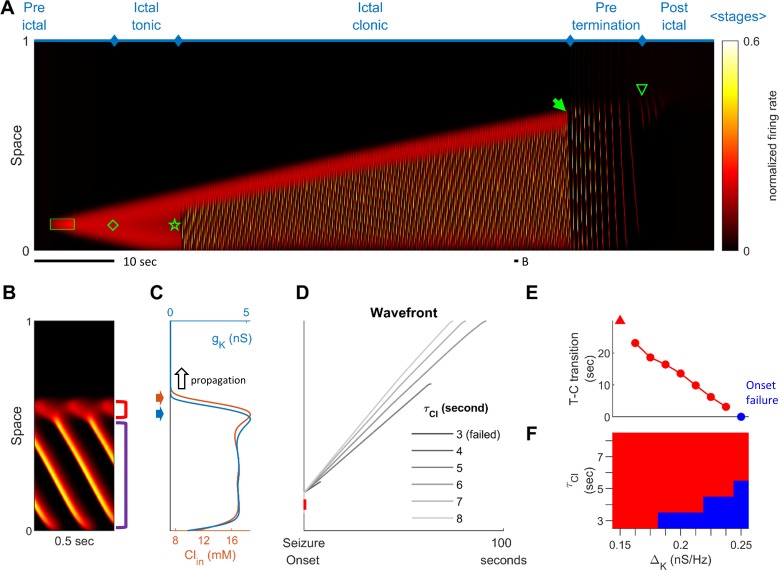
Figure 2. Stages of focal seizure evolution in a 1D rate model.

(A) Spatiotemporal evolution of a model seizure in one-dimensional space (EL=-57.5 mV). Horizontal axis: time; vertical-axis: space. Seizure dynamics is partitioned into the following distinct stages: pre-ictal, ictal-tonic, ictal-clonic, pre-termination, and post-ictal. Green box: seizure-provoking input (Id=200 pA). Green diamond: establishment of external-input-independent tonic-firing area. Green star: tonic-to-clonic transition. Green arrow: annihilation of the ictal wavefront. Green triangle: seizure termination. (B) Temporal zoom-in from Panel A during the ictal-clonic stage. Seizure territory further subdivided. Red square bracket: the ictal wavefront. Purple square bracket: the internal bursting domain. Thus, the top/bottom of the space corresponds to outside/inside of the seizure territory. Note that the fast-moving traveling waves move inwardly. Speed: 1.36 normalized space unit per second. Propagation speed of the ictal wavefront: 0.008 normalized space unit per second, for a traveling wave:wavefront speed ratio of 170. (C) Intracellular chloride concentration and sAHP conductance as a function of spatial position during the ictal-clonic stage, corresponding to the activity depicted in panel B. Note the distinct spatial fields of the two processes near the ictal wavefront. (D) Impaired chloride clearance allows seizure initiation and speeds up seizure propagation. Gray lines: the expansion of border of the seizure territory versus time. End of the lines: seizure termination, either spontaneous (τCl≤5 seconds) or after meeting the neural field boundary (τCl≥6 seconds). (E) Activation of the sAHP conductance leads to the tonic-to-clonic transition. Duration of ictal-tonic stage monotonously decreases as the sAHP conductance increases. Red triangle: persistent tonic stage without transition. (F) The seizure-permitting area in τCl and ΔK parameter space. Blue/red: onset failure/success.

Figure 2.

Figure 2—figure supplement 1. Stages of focal seizure evolution in a 1D spiking model.

Figure 2—figure supplement 1.

(A) Spatiotemporal evolution of a model seizure simulated in a one-dimensional spiking neural network (model parameters: Table 2). Figure convention adopted from Figure 2A. Red shaded area: the seizure-provoking external excitatory input, Id=200 pA. Yellow diamond: establishment of the external input-independent tonic-firing area. Yellow star: tonic-to-clonic transition. Yellow arrow: annihilation of the ictal wavefront. Yellow triangle: seizure termination. The background colors represent the evolution of intracellular chloride concentration and sAHP conductance (see Panel I). (B) Temporal zoom-in during the pre-ictal stage. (C) LFP-like signal readouts, with the colors indicate where the signals are calculated in Panel B. (D) Temporal zoom-in during the ictal clonic-stage. The background color changes from the top to the bottom indicates Clin accumulates first followed by sAHP upregulation. (E) LFP-like signal readouts of Panel D. Y-axis scale adjusted (10X than Panel C). (F) Temporal zoom-in during the pre-termination stage. (G) LFP-like signal readouts of Panel F. The seizure takes several seconds to slow down but still suddenly stops from the EEG perspective. (H) Neuronal firing rates comparison between pre-ictal (before applying the ictogenic stimulus) versus post-ictal periods (5 s, 10-neuron average). Notice the post-ictal suppression and the penumbra rebound excitation. (I) Reference color panel of Clin and gK.

Figure 2—figure supplement 2. Effects of input triggers on model seizure dynamics.

Figure 2—figure supplement 2.

(A) Spatiotemporal diagrams of network activity provoked by exogeneous excitatory stimuli. Green boxes: the spatiotemporal extents of the stimuli. Stimuli intensity: 100 pA. Stimulus durations: 1, 1.5, and 2 seconds from left the right respectively. Left: the network settles back to resting state immediately after the subthreshold stimulus. Middle: several afterdischarges are emitted after a near-threshold stimulus. Right: successful seizure onset. (B) High input currents, long duration, and large size focal inputs are more effective at triggering seizures. Successful seizure onset is defined if the activity of any rate unit is > 0.1 fmax 5 seconds after the end of the external input trigger. Parameter search was done over a logarithm scale grid. Minimal X-axis grid = 1 and Y-axis grid = 1/8. (C) Varying duration, size, and intensity of seizure-provoking inputs does not alter the sequence of seizure stages. The external inputs, Ix,t, are provided to the one-dimensional rate model at the center of the space.

Figure 2—figure supplement 3. Targeted parameter search of seizure territory expansion.

Figure 2—figure supplement 3.

(A) Expansion of seizure territories in space-time diagrams. Model parameters are derived from Table 1, with colors correspond with modifications indicated in the color bars. All seizures are provoked by 200 pA current injection during 2–5 s at location 0 to 0.05. Notice parameters which control inhibition robustness (chloride dynamics, the upper three panels) have more prominent effects on seizure expansion speed. (B) Seizure expansion speed quantified by measuring seizure territory size 10 seconds after the onset stimuli. Each subpanel aligns with the correspondent subpanel in panel A. Upper 3 subpanels: compromised inhibition robustness due to high Clin.eq, small Vd.Cl, and slow τCl is associated with fast seizure propagation. Lower 3 subpanels: strong adaptation currents due to high ΔK, low EK, and fast τK speed up stage transitions of seizure evolution.

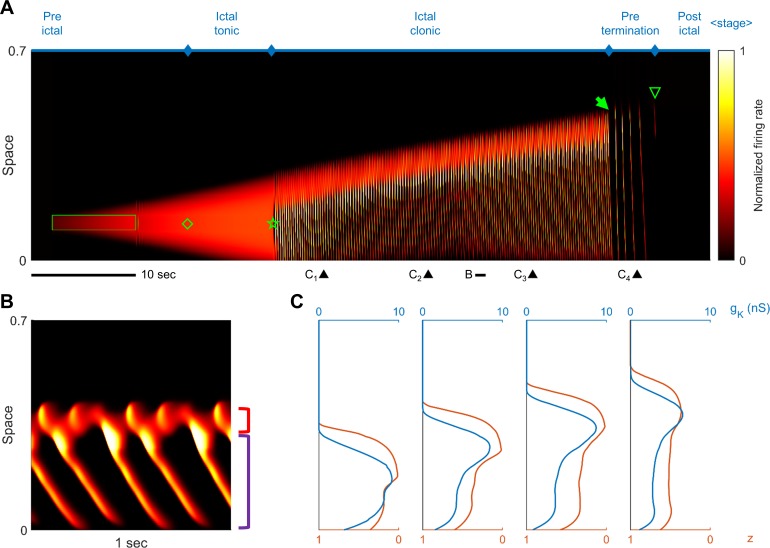
Figure 2—figure supplement 4. Stages of focal seizure evolution in a generalized model of exhaustible inhibition.

Figure 2—figure supplement 4.

(A) Figure conventions adopted from Figure 2A. Parameters are adopted from Table 1 with the following adjustments: ΔK=0.125 nS/Hz; τK=7 seconds; gI.th=15 nS; gE-=125 nS; EL=-60 mV. Green box: deterministic external current input: Id=200 pA. (B) One-second temporal zoom-in of the ictal clonic stage, marked in Panel A. Figure convention adopted from Figure 2B. (C) Snapshots of inhibition effectiveness (z) and sAHP conductance (gK). Timing of the snapshots are marked in Panel A. Notice that inhibition collapses ahead of upregulation of the sAHP conductance.