Abstract
Surface plasmon resonance (SPR) biosensor is a promising technology for its various advantages including the real-time measurement of biomolecular interactions without labeling. A method of hybridizing RNAs on the surface of the streptavidin-coated (SA) sensor chip to study RNA-protein interactions was described in this paper. In our study, it has been shown that the nucleocapsid (N) protein of severe acute respiratory syndrome coronavirus (SARS-CoV) has a high binding affinity for the leader sequence of SARS-CoV genome. Effect of temperature on the RNA-DNA hybridization was also examined. This method can provide the affinity of interactions with high sensitivity. Therefore, it will be useful in screening binding candidates for a given RNA target motif with one chip.
Keywords: RNA-protein interactions, Hybridization, Biacore, Surface plasmon resonance
Introduction
RNA-protein interactions play crucial roles in many fundamental biological processes due to their effects on RNA synthesis, splicing, transport, localization, translation, virus replication, and virus assembly; thus, the disruption of RNA-protein interactions is associated with disease states. Electrophoretic mobility shift assay, UV cross-linking, nucleotide analog interference mapping and filter binding assay have only provided restricted information on RNA-protein interactions. Therefore, a technology, which can provide a real-time kinetic analysis to compare affinities between different targets and can be used for RNA-binding protein screenings, is required [1, 2].
Since the surface plasmon resonance (SPR) was first used as a biosensor in 1983 [3], this technique has emerged as one of the most powerful tools in many important areas including medicine, environmental monitoring, biotechnology, drug and food monitoring [4, 5]. SPR is an optical detection technology to measure the changes in the refractive index near a sensor surface that offers kinetic analysis of biomolecular interactions in real time [4–7]. Molecular binding is monitored by a change in SPR angle, which is reported as resonance units (RU). One RU corresponds approximately to a surface concentration of 1 pg/mm2 for an average protein. However, it should be emphasized that the relationship between RU and pg of the materials varies with the refractive index of the bound molecule, and, thus, nucleic acid is different from protein [6, 7]. If the molecule does not bind to a target on the chip surface, it will give zero RU of response. A limitation of the method is that the sensor surface is not well-suitable to the small molecules analysis (<200 Da). Also, the mass transfer problem should be reduced by optimizing the flow rate and the amount of bound molecules.
In virological studies, SPR is widely used in DNA-protein, RNA-protein and protein-protein interactions [8–10]. However, using SPR, biotinylated RNA oligo nucleotides for RNA-protein interactions measurement need to be synthesized and purified by HPLC. RNAs are easily degraded and can only be synthesized with a restricted length. In addition, comparison of different measurements requires frequent chip replacement, which is an expensive issue.
The “one-chip-for-all” strategy that is capable of detecting different target sequences using the same sensor chip [11] was further improved to detect the affinity of RNA-protein interactions in this study. We used the nucleocapsid (N) protein of severe acute respiratory syndrome coronavirus (SARS-CoV) to actualize this method. N protein, one of the most abundant coronavirus proteins in infected cells, is a typical RNA binding protein [12]. Target RNAs partially complementary to immobilized DNA probes on the sensor chip were obtained by in vitro transcriptions. The protein was injected into the Biacore system to analyze its RNA binding property. RNA probes can be easily exchanged by hybridizations on the DNA coated chip.
Our work can provide key information to understand the molecular mechanism of RNA-protein interactions. This method to analyze RNA-protein interactions could be extended to screen libraries of peptides or proteins with specific RNA-binding activities.
Materials and Methods
Preparation of Nucleic Acid
Oligo DNA molecules were synthesized based on the 5′-leader sequence of SARS-CoV genome including the 5′–72 nucleotides (nt), and inserted into the SacI and HindIII sites of the pBluescript II KS (+) vector. The DNA construct was linearized with XhoI and in vitro transcribed using T7 RNA polymerase to generate a 106-nt RNA. The RNA was purified and quantified using Biotech Ultrospec 3100 (Amersham/Parmacia).
Different DNAs required for the assay were synthesized. Oligo DNA CR complementary to the 5′-leader sequence of SARS-CoV genome from 1nt to 30 nt, biotinylated DNA oligonucleotides complementary to the sequence from HindIII to XhoI on the vector pBluescript II KS (+), and oligo DNA CB including the sequence from HindIII to XhoI on the vector pBluescript II KS (+) were obtained from TaKaRa. Their sequences are shown in Table 1. Oligo dT (Promega) was used as a negative control.
Table 1.
Nucleic acids used for SPR detection
| Oligonucleotide | Sequence |
|---|---|
| Biotinylated DNA probe | 5′-bio-C6-CTCGAGGTCGACGGTATCGATAAGCTT-3′ |
| Transcribed RNA | 5′-GAAUUGGAGCUCauauuagguuuuuaccuac |
| ccaggaaaagcCAACCAACCUCGAUCUCUUGUAG | |
| AUCUGUUCUCUAAACGAACAAGCUUAUCGAUACC | |
| GUCGACC-3′ | |
| Oligo DNA CR | 5′-gcttttcctgggtaggtaaaaacctaatat-3′ |
| Oligo DNA CB | 5′-AAGCTTATCGATACCGTCGACCTCGAG-3′ |
Note: The underlined uppercase bases indicate the tag sequence for the biotinylated DNA-RNA hybridization. The underlined lowercase bases indicate the sequence of SARS-CoV genome 5′-end 30 nucleotides. DNA CR is the sequences complementary to the 5′-leader sequence of SARS-CoV genome from 1 nt to 30 nt. Oligo DNA CB contains the sequence from HindIII to Xhol in the vector pBluescript II KS (+) that is complementary to the Bio-DNA probe
Protein Expression and Electrophoretic Mobility Shift Assay (EMSA)
Total RNA was extracted from cells infected with SARS-CoV strain WHU (GenBank, accession number AY394850). The cDNA was synthesized by reverse transcription using poly (dT) primer. The N gene was PCR amplified from the SARS-CoV cDNA and cloned into the vector pET-30a (Stratagene). His-tagged N protein was expressed and purified as previously described [13, 14]. The protein was quantified and then incubated with the 106-nt RNA in 10 mM Tris–HCl (pH 8.0), 100 mM NaCl for 10 min. The RNA-protein complexes were resolved on 2% agarose gels and then visualized with ethidium bromide.
SPR Analysis of RNA-Protein Interactions
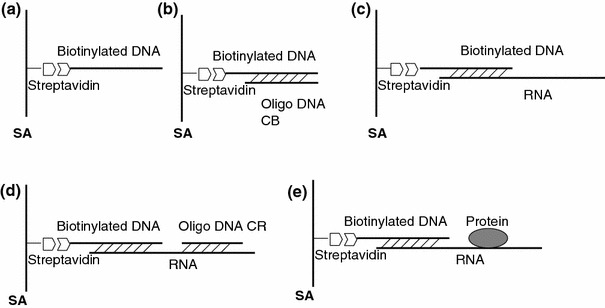
SPR analysis was performed using a Biacore X biosensor with a streptavidin-coated (SA) sensor chip at 37°C. The running buffer, which was also used for the ligand dilution, was HBS-EP (0.01 M HEPES, 0.15 M NaCl, 3 mM EDTA, 0.005% surfactant P20 [pH 7.4]) [15–17]. At first, 70 μl of 50 nM biotinylated DNA was injected at 2 μl/min into one flow cell and led to a probe capture of 828 RU, and then, 80 μl of 150 nM of the same probe provided another capture of 941 RU (Fig. 1a). Secondly, the RNA sample mixed with an equal volume of HBS-EP buffer was hybridized on the surface of the DNA-coated sensor chip at a flow rate of 2 μl/min in the running buffer (Fig. 1c), giving a probe capture of 600 RU. The 3′-end of the RNA complementary to the biotinylated DNA was hybridized to the chip fixed molecules, leaving the rest of RNA sequence as a free target for protein binding. Three different temperatures (25, 30 and 37°C) were used to optimize hybridization conditions of RNAs comparing with DNA CB. We also used a non-complementary RNA probe as a negative control in the same condition to examine whether the RNA hybridization is specific. Binding capabilities of the fixed biotinylated DNA and the RNA could be verified by injections of DNA CB and DNA CR, respectively (Fig. 1b, d). Oligo dT was considered to be a negative control. Thirdly, 75 μl of the 10 nM of N protein was injected at 30 μl/min, followed by the same flow rate of running buffer (Fig. 1e). BSA protein was set as a negative control. Finally, the sensor chip was regenerated by running 5 μl of a buffer containing 20 mM NaOH and 1 M NaCl to remove all hybridized RNAs. The blank cell without biotinylated DNAs was simultaneously used as reference. The response data was analyzed using separated Ka/Kd 1:1 (Langmuir) association and 1:1 (Langmuir) dissociation models with the BIA evaluation program version 4.1. The DNA-coated chip was stored at 4°C.
Fig. 1.

Schematic interpretation of hybridizing RNA and detecting RNA-protein interactions. (a) Single biotinylated DNA is immobilized on SA chip surface. (b) Oligo CB hybridizes to biotinylated DNA. (c) RNA hybridizes to biotinylated DNA. (d) Measurement of the real response of RNA by oligo CR. (e) Kinetic analysis of RNA-protein interaction
Results
Strategy to Hybridize RNAs on the Surface of a Sensor Chip
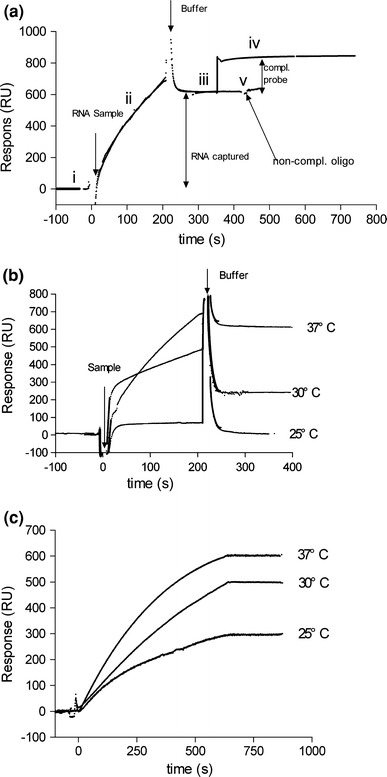
In most nucleic acid protein binding studies, the RNA is the ligand and the protein is the analyte, which is passed over the immobilized RNA [16, 17]. The SA sensor chip carries a dextran matrix of immobilized streptavidin which is used for capturing the biotinylated ligand, especially biotinylated nucleic acid. In our method, biotinylated DNA instead of biotinylated RNA was used to fix on the chip, as DNA is more stable than RNA. The 106-nt ss-RNA containing a sequence domain complementary to the captured DNA probe was immobilized on the sensor chip. An increase in RU indicated the hybridization between RNA and fixed DNA when a transcribed RNA was injected as shown in Fig. 2a-ii. Under the same experimental condition, a non-complementary RNA probe was injected and no hybridization was detected as expected (data not shown). This data indicated that the RNA hybridization was specific.
Fig. 2.

Detection of RNA hybridization and optimization of experimental conditions. (a) Detection of RNA hybridization. RNA was captured on sensor chip surface, then oligo DNA CR that is complementary to part of the RNA was injected to check the actual response of RNA hybridization. (i) Biotinylated DNA covered chip was stabilized with buffer. (ii) RNA sample was hybridized to biotinylated DNA. (iii) RNA was captured and the chip was stabilized with buffer. (iv) Oligo DNA CR complementary to part of the RNA was injected, giving rise to an additional response units increasing. (v) Non-complementary DNA as negative control was injected and no significant change was detected on the sensorgram. (b) Effect of temperature on RNA hybridization. (c) Effect of temperature on oligo DNA CB hybridization
Non-covalently captured ligands usually dissociate partially during the analysis cycle. Therefore, the average dissociation rate of the RNA immobilized on DNA 7.71 × 10⁻⁵ s−1 at 37°C was obtained, which resulted in a loss of less than 5% of the RNA within 5 minutes. The interaction between the RNA and the pre-immobilized biotinylated DNA has a high affinity. Therefore, the majority of the RNA remained on the chip surface during the course of a standard analysis cycle.
High Activity of Hybridized RNAs
The amount of immobilized ligands always indicates a potential binding activity. Nevertheless, the partial loss of ligands may lead to a decrease of real activity. The consistency of RNA-protein binding capacity should be tested before proceeding to next stages to ensure whether the RNA is useful. After the RNA hybridization, the chemically synthesized DNA CR complementary to part of the RNA was injected, giving rise to a 170 RU increase (Fig. 2a-iv). Because DNA CR was 30 nt and the transcribed RNA was 106 nt in length, the additional 170 RU suggested that the captured RNA should be 170 × 106/30 = 601 RU (a 1:1 binding analyte binding stoichiometry). Comparing with the captured RNA RU 630 (Fig. 2a-iii) before the injection of DNA CR, the RNA was about 95% active. When a non-complementary DNA oligo dT was injected, no significant change in response units was detected on the sensorgram (Fig. 2a-v). The result indicated that about 95% of the RNA had a real binding activity; therefore, the responses detected were that as expected.
Effect of Temperature on the RNA-DNA Hybridization
Many factors such as temperature, buffer pH and ionic strength affect immobilization. The buffer conditions used for RNA hybridization were also suitable for RNA-protein binding as determined in previous studies [10, 17]. Three different temperatures 25, 30 and 37°C were evaluated in the RNA-DNA hybridization. The same RNA sample was injected for 200 s, and the system was washed with running buffer. Temperature increase clearly enhanced the RNA-DNA hybridization (Fig. 2b). When the temperature was kept below 25°C, the hybridized RNA was hardly detectable. DNA CB complementary to the pre-immobilized DNA was also injected at three different temperatures (Fig. 1b). The hybridization of DNA CB at 25°C could reach about 50% of the level achieved at 37°C (Fig. 2c). This observation could be explained by the fact that longer single-stranded oligonucleotides can easily generate hairpins at lower temperature. Therefore, incubations at higher temperature may help to unfold the secondary construct especially in RNA molecules.
The Binding Affinity Between N Protein and RNA
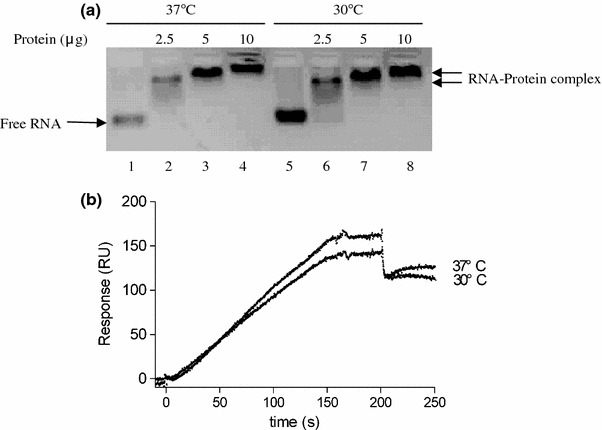
To investigate the RNA binding activity of SARS-CoV N protein, EMSA was conducted with the N protein and the 106-nt RNA. When the concentration of RNA was kept constant, as the amount of the protein was increased, the band intensity of the RNA-protein complex increased (Fig. 3a). At the same time, the position of the RNA-protein complex also moved to that of high molecular weight complexes (Fig. 3a). No significant difference could be detected by gel electrophoresis when the binding was performed at different temperatures of incubations. When ssDNA and dsDNA were incubated with N protein, the binding activity could not be observed even after one hour incubation (data not shown). This data indicated that N protein specifically bound to RNA.
Fig. 3.

Measurement of the binding affinity between RNA and protein. (a) Electrophoretic mobility shift assays of RNA bound by N protein. Lanes 1 and 5 are controls of the individual RNA. Lanes 2–4 have a constant amount of RNA (2 μg) with an increasing amount of protein incubating at 37°C. Lanes 6–8 have a constant quantity of RNA (2 μg) with an increasing amount of protein incubating at 30°C. (b) Effect of the temperate on RNA-protein interaction. 75 μl of 10 nM SARS-CoV N protein was injected at 30 μl/m, followed by a flow of running buffer at two different temperatures
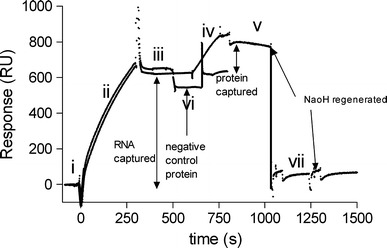
SPR detection relies on the affinity of the interaction between a molecule and the ligand attached to the sensor surface [4–7, 18]. N protein was loaded onto the RNA-hybridized sensor chip to measure the binding affinities of RNA-protein interaction. To examine the binding specificity, BSA protein was used as a negative control, and was injected at the same concentrations used for N protein (Fig. 4-iii). Binding between BSA and RNA was not detected whereas N protein gave a capture of 170 RU (Fig. 4-iv), indicating that the detection of the binding between N protein and RNA was specific. The binding affinity between N protein and the target RNA at 37°C has an average Kd 4.60 ± 0.3 nM (Fig. 3b). The analysis had been repeated for three times showing that the data was representative (Table 2).
Fig. 4.

The whole analysis cycle of the method for detecting interactions of RNA and N protein. (i) Biotinylated DNA covered chip was stabilized with buffer. (ii) RNA sample hybridized to biotinylated DNA. (iii) RNAs were captured and chip was stabilized with buffer. (iv) SARS-CoV N protein was injected, giving an additional response units increasing. (v) After the injection of N protein, running buffer was changed for dissociation measurement. (vi) BSA protein was injected and no significant change was detected on the sensorgram. (vii) The chip was regenerated by 20 mM NaOH in 1 M NaCl for twice
Table 2.
Kinetic values for complexes of SARS-CoV N protein with the 106-nt RNA at 37°C
| Analysis times | ka (1/ms) | kd (1/s) | Ka (1/M) | Kd (nM) |
|---|---|---|---|---|
| 1 | 8.6 × 10⁴ | 3.71 × 10⁻⁴ | 2.32 × 10⁸ | 4.31 |
| 2 | 8.69 × 10⁴ | 4 × 10⁻⁴ | 2.71 × 10⁸ | 4.61 |
| 3 | 9.37 × 10⁴ | 4.66 × 10⁻⁴ | 2.01 × 10⁸ | 4.89 |
Note: The association rate constant was 8.89 ± 0.5 × 10⁴ 1/ms, the dissociation rate contant was 4.12 ± 0.6 × 10⁻⁴ 1/s, the average Kd was 4.60 ± 0.3 nM
Discussion
The data presented show that the described method can be successfully used to analyze RNA-protein interactions with SPR system. The RNA can be hybridized onto the chip via DNA. We have shown that the binding temperature was essential to optimize RNA hybridizations (Fig. 2b). The data indicated that binding conditions were appropriate for RNA-DNA hybridizations and the binding was specific. In practice, the maximum response observed (the effective binding capacity) was affected by the activity of the ligand. Theoretically, the capture of 600 RU of 106-nt RNA only needs 600 × 33/106 = 187 RU of biotinylated DNA because biotinylated DNA was 33 nt in length. However, when we immobilized 200 RU of biotinylated DNA, the activity of captured RNAs was very low and was quickly lost in a few days. Since the maximum attainable binding capacity to capture a ligand is always lower than that of a direct immobilized ligand and the RNA should be captured at the beginning of each analysis cycle, we suggest to immobilize the maximum amount of biotinylated DNA probes. The total captured RNA can be controlled by changing the volume of the injection. Considering that RNAs are easily degraded in common conditions, we have selected a higher temperature in order to ensure a rapid RNA hybridization. Although occasional background noise signals might be increased when the temperature is higher than 30°C, this noise can be minimized by improving the injection technique and by using highly purified analytes.
Nelson et al. obtained a Kd of 14 nM of the binding affinity for MHV N protein with RNA [13] and Chen et al. determined that the binding affinity for IBV N protein to the IBV leader was 2.82 nM [17]. We calculated that the average binding affinity between SARS-CoV N protein and the target RNA was 4.60 nM at 37°C .These differences may be a reflection of the intrinsic property of different coronavirus N proteins and RNAs or of the different kinetic measurement and condition used. The binding sensorgrams at different temperatures are shown in Fig. 3b. Some degree of difference in the bound protein amount observed by increasing the temperature showed that this approach is more sensitive than the EMSA.
To analyze the binding affinity of N protein with RNA, we used a Langmuir binding model with a stoichiometry of 1:1 to analyze the association rate constant and the dissociation rate constant, giving the λ = 0.79. The data was sufficient to explain the binding affinity between RNA and N protein. Comparing with previous researches, results of the current study suggested that the proposed method using SPR was successful and optimal conditions had been selected in real time.
In most capturing approaches, regeneration of the chip surface involves removals of ligand and analyte from the captured molecule together. It is important that the RNA should remain stably attached to the surface and the analyzed binding capacity does not decrease. To capture different RNAs, the stability over the duration of one measurement cycle is sufficient. Since after more than 400 regenerations of the chip during half a year, the capability of capturing RNA on the chip was still maintained higher than 80%, thus, there is no need to change chips for different RNAs.
Recently, high throughput biosensor has been implemented as a useful tool in diagnostics and therapeutics. The method described here is specific, sensitive and reproducible. Therefore, it will meet the demand in the growing proteomics research for detecting and measuring affinities of nucleic acid-protein interactions, and it can be used in selecting the most suitable interaction partner for a given RNA target.
Acknowledgments
We thank Dr Bifeng Yuan and Prof Zheng Tan for their technical advices and help. We thank Prof Luis Enjuanes for his careful review of the manuscript. This study was supported by China National Science Foundation (#30570394), National Basic Research Program of China (#2006CB504300) and the MOE”111” project #B06018. Guo’s lab is supported by the Luojia Professorship Program of Wuhan University.
References
- 1.Budihas S. R., Gorshkova I., Gaidamakov S., Wamiru A., Bona M. K., Parniak M. A., Crouch R. J., McMahon J. B., Beutler J. A., Le Grice S. F. Selective inhibition of HIV-1 reverse transcriptase-associated ribonuclease H activity by hydroxylated tropolones. Nucleic Acids Research. 2005;33:1249–1256. doi: 10.1093/nar/gki268. [DOI] [PMC free article] [PubMed] [Google Scholar]
- 2.Misono T. S., Kumar P. K. Selection of RNA aptamers against human influenza virus hemagglutinin using surface plasmon resonance. Analytical Biochemistry. 2005;342:312–317. doi: 10.1016/j.ab.2005.04.013. [DOI] [PubMed] [Google Scholar]
- 3.Liedberg B., Nylander C., Lundström I. Surface plasmon resonance for gas detection and biosensing. Sensors and Actuators. 1983;4:299–304. doi: 10.1016/0250-6874(83)85036-7. [DOI] [Google Scholar]
- 4.Myszka D. G. Kinetic analysis of macromolecular interactions using surface plasmon resonance biosensors. Current Opinion in Biotechnology. 1997;8:50–57. doi: 10.1016/S0958-1669(97)80157-7. [DOI] [PubMed] [Google Scholar]
- 5.Homola J., Yee S. S., Gauglitz G. Surface plasmon resonance sensors: review. Sensors and Actuators B-Chemical. 1999;54:3–15. doi: 10.1016/S0925-4005(98)00321-9. [DOI] [Google Scholar]
- 6.Fivash M., Towler E. M., Fisher R. J. BIAcore for macromolecular interaction. Current Opinion in Biotechnology. 1998;9:97–101. doi: 10.1016/S0958-1669(98)80091-8. [DOI] [PubMed] [Google Scholar]
- 7.Nguyen B., Tanious F. A., Wilson W. D. Biosensor-surface plasmon resonance: quantitative analysis of small molecule–nucleic acid interactions. Methods. 2007;42:150–161. doi: 10.1016/j.ymeth.2006.09.009. [DOI] [PubMed] [Google Scholar]
- 8.Yuk J. S., Ha K. S. Proteomic applications of surface plasmon resonance biosensors: analysis of protein arrays. Experimental and Molecular Medicine. 2005;37:1–10. doi: 10.1038/emm.2005.1. [DOI] [PubMed] [Google Scholar]
- 9.Brockman J. M., Frutos A. G., Corn R. M. A multistep chemical modification procedure to create DNA arrays on gold surfaces for the study of protein-DNA interactions with surface plasmon resonance imaging. Journal of the American Chemical Society. 1999;121:8044–8051. doi: 10.1021/ja991608e. [DOI] [Google Scholar]
- 10.Hwang J., Nishikawa S. Novel approach to analyzing RNA aptamer-protein interactions: toward further applications of aptamers. Journal of Biomolecular Screening. 2006;11:599–605. doi: 10.1177/1087057106288491. [DOI] [PubMed] [Google Scholar]
- 11.Yuan B. F., Hao Y. H., Tan Z. Universal sensing strategy for the detection of nucleic acid targets by optical biosensor based on surface plasmon resonance. Clinical Chemistry. 2004;50:1057–1060. doi: 10.1373/clinchem.2003.030783. [DOI] [PubMed] [Google Scholar]
- 12.Laude H., Masters P. S. The coronavirus nucleocapsid protein. In: Siddell S. G., editor. The coronaviridae. New York: Plenum Press; 1995. pp. 141–163. [Google Scholar]
- 13.Nelson G. W, Stohlman S. A., Tahara S. M. High affinity interaction between nucleocapsid protein and leader intergenic sequence of mouse hepatitis virus RNA. Journal of General Virology. 2000;81:181–188. doi: 10.1099/0022-1317-81-1-181. [DOI] [PubMed] [Google Scholar]
- 14.Ren A. X., Xie Y. H., Kong Y. Y., Yang G. Z., Zhang Y. Z., Wang Y., Wu X. F. Expression, purification and sublocalization of SARS-CoV nucleocapsid protein in insect cells. Acta Biochimica et Biophysica Sinica. 2004;36:754–758. doi: 10.1093/abbs/36.11.754. [DOI] [PMC free article] [PubMed] [Google Scholar]
- 15.Blaesing F., Weigel C., Welzeck M., Messer W. Analysis of the DNA-binding domain of Escherichia coli DnaA protein. Molecular Microbiology. 2000;36:557–569. doi: 10.1046/j.1365-2958.2000.01881.x. [DOI] [PubMed] [Google Scholar]
- 16.Katsamba P. S., Park S., Laird-Offringa I. A. Kinetic studies of RNA-protein interactions using surface plasmon resonance. Methods. 2002;26:95–104. doi: 10.1016/S1046-2023(02)00012-9. [DOI] [PubMed] [Google Scholar]
- 17.Chen H., Gill A., Dove B. K., Emmett S. R., Kemp C. F., Ritchie M. A., Dee M., Hiscox J. A. Mass spectroscopic characterization of the coronavirus infectious bronchitis virus nucleoprotein and elucidation of the role of phosphorylation in RNA binding by using surface plasmon resonance. Journal of Virology. 2005;79:1164–1179. doi: 10.1128/JVI.79.2.1164-1179.2005. [DOI] [PMC free article] [PubMed] [Google Scholar]
- 18.Rogers K. R. Principles of affinity-based biosensors. Molecular Biotechnology. 2000;14:109–29. doi: 10.1385/MB:14:2:109. [DOI] [PubMed] [Google Scholar]


