

SUMMARY
Muscle regeneration relies on the regulation of muscle stem cells (MuSCs) through paracrine signaling interactions. We analyzed muscle regeneration in mice using single-cell RNA sequencing (scRNA-seq) and generated over 34,000 single-cell transcriptomes spanning four time-points. We identified 15 distinct cell types including heterogenous populations of muscle stem and progenitor cells. We resolved a hierarchical map of these myogenic cells by trajectory inference and observed stage-specific regulatory programs within this continuum. Through ligand-receptor interaction analysis, we identified over 100 candidate regeneration-associated paracrine communication pairs between MuSCs and non-myogenic cells. We show that myogenic stem/progenitor cells exhibit heterogeneous expression of multiple Syndecan proteins in cycling myogenic cells, suggesting that Syndecans may coordinate myogenic fate regulation. We performed ligand stimulation in vitro and confirmed that three paracrine factors (FGF2, TGFβ1, and RSPO3) regulate myogenic cell proliferation in a Syndecan-dependent manner. Our study provides a scRNA-seq reference resource to investigate cell communication interactions in muscle regeneration.
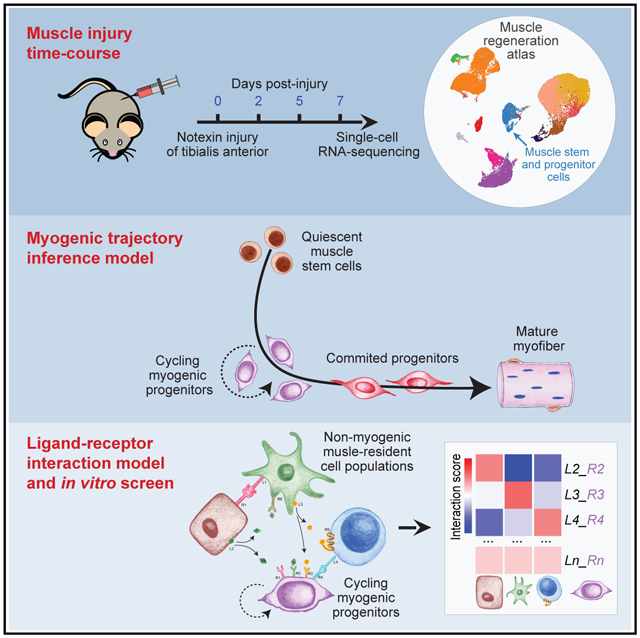
Graphical Abstract
In Brief
De Micheli et al. present an annotated, time-resolved single-cell transcriptomic atlas of muscle regeneration in adult mice. They observe a hierarchy of muscle stem and progenitor cells that exhibit stage-specific expression programs and show that Syndecan proteins regulate muscle progenitor cell fates by interaction with newly discovered paracrine communication factors.
INTRODUCTION
Muscle stem cells (MuSCs), also known as satellite cells, are essential for skeletal muscle homeostasis and regeneration throughout lifespan (Blau et al., 2015; Wang and Rudnicki, 2011). MuSCs are found at the periphery of muscle myofibers and are sheltered inside a niche microenvironment where they are maintained in a quiescent state. In response to injury, MuSCs activate, self-renew, and differentiate into progenitors capable of myofiber repair. This regenerative process is orchestrated by a network of interactions with a variety of cell types including immune cells, endothelial cells, and fibro/adipogenic progenitors (FAPs) (Wosczyna and Rando, 2018). For example, FAPs secrete fibronectin, insulin-like growth factor-1, and other matrix proteins and growth factors to coordinate muscle tissue repair through the regulation of myogenic cell fates and the clearance of cellular debris (Heredia et al., 2013; Joe et al., 2010; Lukjanenko et al., 2016).
A continuum of myogenic stem and progenitor cell populations is present in regenerating muscle (Motohashi and Asakura, 2014; Tierney and Sacco, 2016). MuSCs are quiescent Pax7-expressing cells in homeostasis which, following injury, enter the cell cycle and exhibit an activated myogenic expression program marked by expression of Myf5 (Wang and Rudnicki, 2011). Following cell division, their progeny either self-renew to replenish the Pax7+ MuSC pool or differentiate into MyoD+ myogenic progenitors (myoblasts), which later commit to fusion-competent Myogenin+ myocytes. This concept of the myogenic cell lineage was largely derived from lineage tracing and prospective isolation studies using myogenic regulatory factors and cell cycle stages to define cell states (Biressi and Rando, 2010). Myogenic stem/progenitor cell populations, enriched to high purity through surface antigen profiles and/or transgenic reporters, nonetheless exhibit substantial molecular and functional heterogeneity throughout adulthood (Chakkalakal et al., 2014; Cornelison and Wold, 1997; Cosgrove et al., 2014; Kuang et al., 2007; Porpiglia et al., 2017; Rocheteau et al., 2012; Sacco et al., 2008; Sousa-Victor et al., 2014; Tierney et al., 2018). These findings suggest that myogenic stem/progenitor cell lineage may be interpreted as a hierarchical continuum of cell states. However, it remains to be resolved how global profiles in cell cycle mediators, regulatory factors, and surface markers define this myogenic continuum.
Recent advances in single-cell analyses and algorithms provide potent new strategies to infer cell differentiation trajectories (Hwang et al., 2018; Wagner et al., 2016). Here, we generated a single-cell transcriptomic atlas of mouse muscle regeneration to describe the myogenic continuum and multicellular communication networks involved in muscle repair. We used droplet-based single-cell RNA sequencing (scRNA-seq) to collect a multi-cell–type transcriptomic reference time-course, spanning four time-points and over 34,000 single-cell transcriptomes, of the regenerating muscle tissue in mice. We analyzed this atlas to identify the compositional and gene-expression dynamics of the cellular constituents of muscle repair. Using trajectory inference, we organized more than 3,200 individual myogenic cell transcriptomes in a pseudotime continuum to reveal their hierarchical organization and identify regulatory factor and surface marker expression profiles unique to distinct myogenic subpopulations. Finally, we used a ligand-receptor synchronous co-expression model to identify cell communication interactions between non-myogenic and myogenic cell subpopulations to identify stage-specific communication interactions involved in muscle repair
RESULTS
A Single-Cell RNA-Sequencing Atlas of Mouse Muscle Regeneration
Skeletal muscle regeneration in response to local tissue damage depends on the coordinated interactions of multiple myogenic and non-myogenic cell types over a time-course of weeks (Wosczyna and Rando, 2018). To gather a comprehensive view of this process, we generated a transcriptomic atlas of adult mouse hindlimb muscle regeneration using droplet-based single-cell 3′ RNA-sequencing (scRNA-seq) on the 103 Chromium platform. We collected tibialis anterior (TA) muscles of healthy adult (4–7 months) C57BL6 mice at 0 (no injury), 2, 5, and 7 days following injection of the myotoxin notexin to induce myofiber damage (n = 2–3 mice per time-point). We dissected and then enzymatically digested the TA muscles into single-cell suspensions, filtered to remove cellular debris and, in some samples, applied red blood cell (RBC) lysis before performing scRNA-seq (Figure 1A).
Figure 1. Assembly and Curation of a scRNA-Seq Atlas of Mouse Muscle Regeneration.
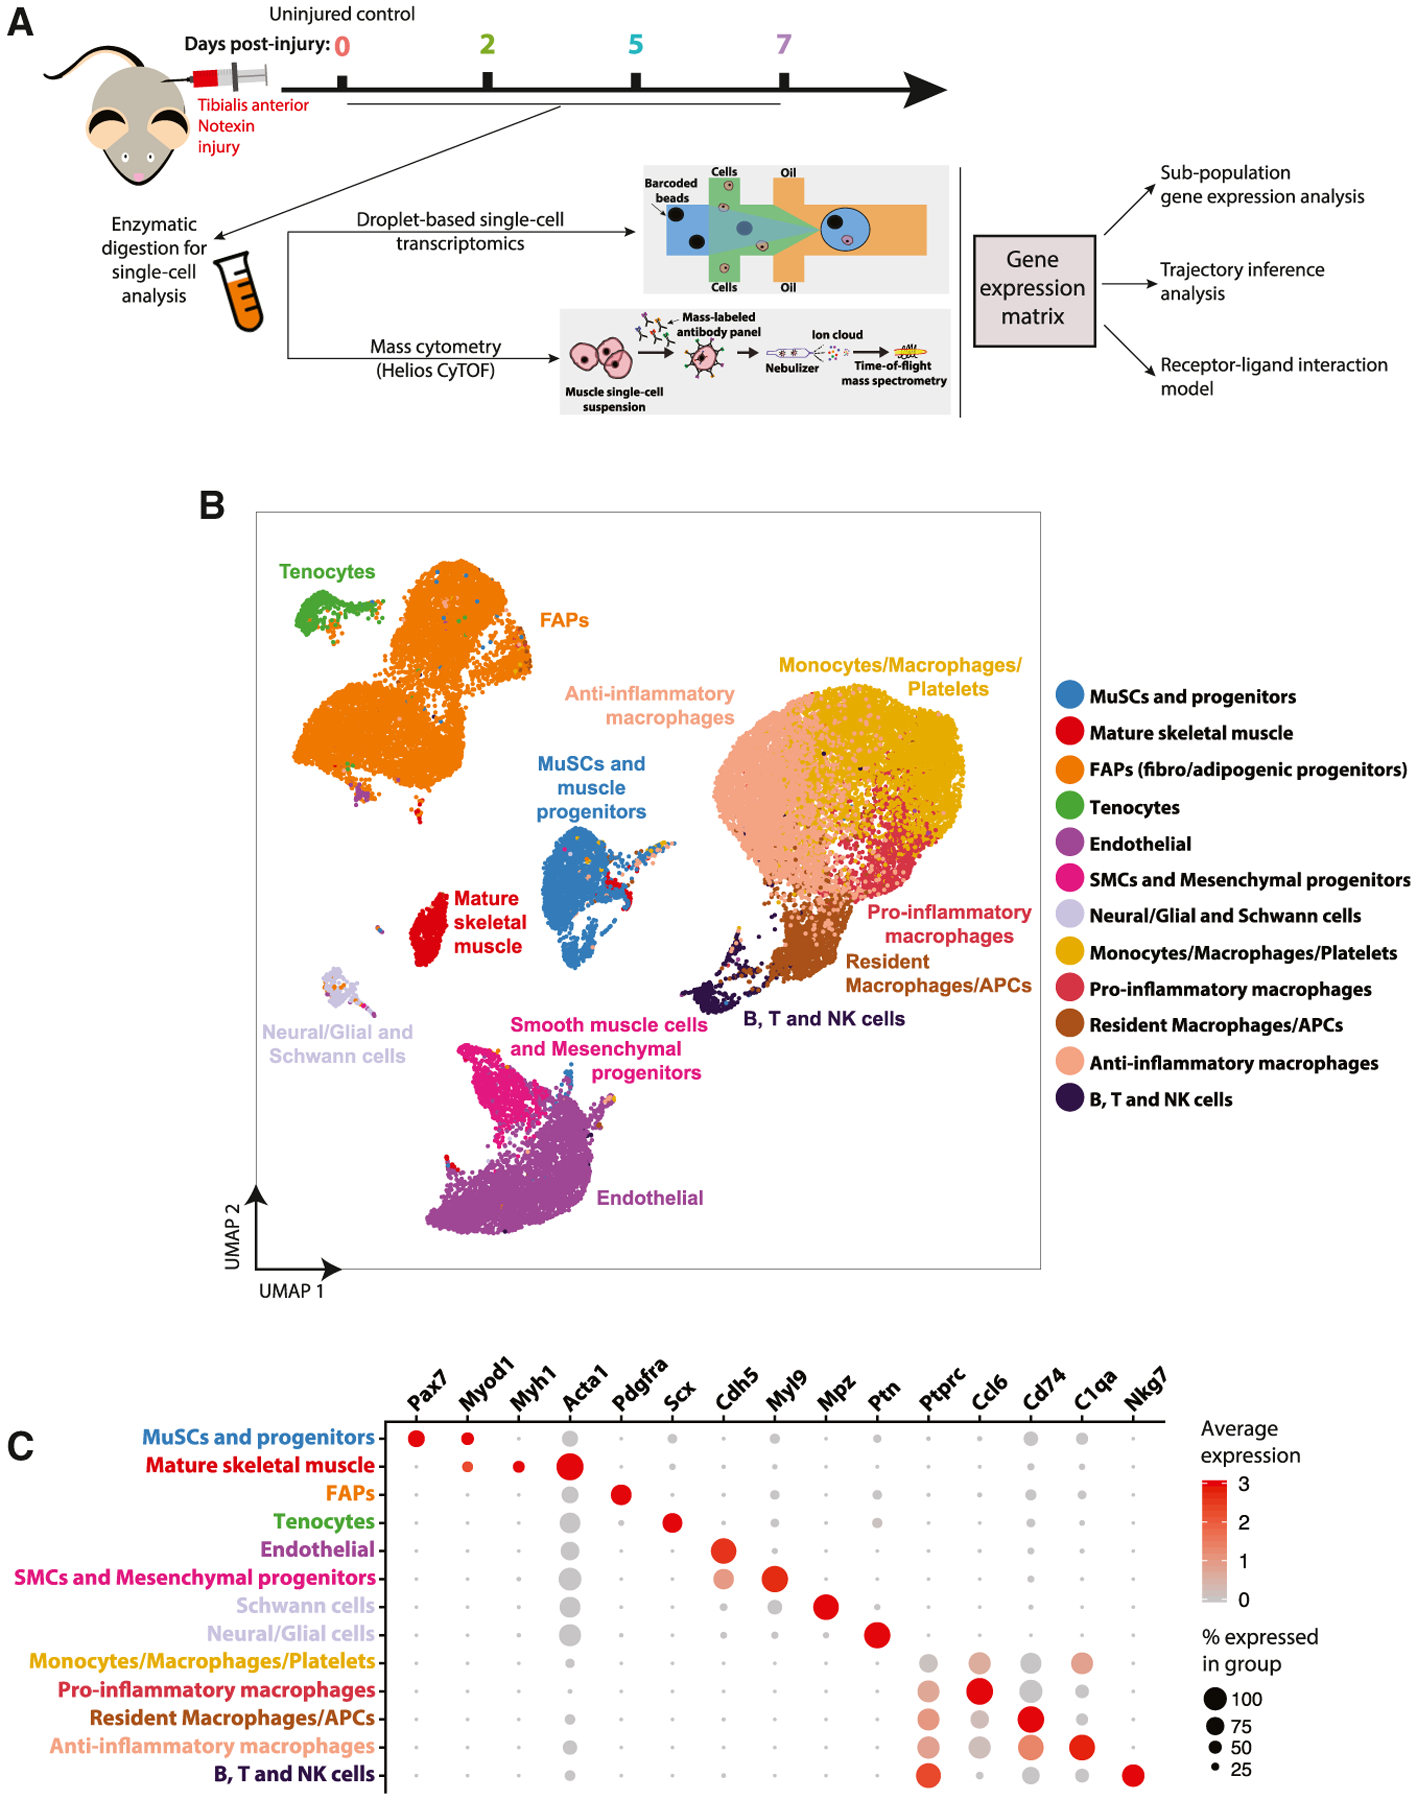
(A) Experimental design overview. Cell suspensions were collected from digested tibialis anterior (TA) muscles of adult mice at various time points (0 [no injury], 2, 5, and 7 days) following notexin injury (n = 2–3) and subjected to scRNA-seq and mass cytometry (CyTOF), followed by downstream analyses.
(B) Complete 34,438 cell transcriptomic atlas assembled from all sample time-points. Data are presented as a UMAP projection to visualize variation in single-cell transcriptomes. Unsupervised SNN clustering resolved at least 12 distinct types of cells (color-coded in legend). More resolved cell type clusters, distinguishing neural/glial from Schwann cells and immature B from cytotoxic T cells, were evident when analyzing time-points individually (see Figure 2A).
(C) Identification of cell types from SNN clusters based on cluster-average expression of canonical genes. Dot size represents the percentage of cells with a non-zero expression level and color-scale represents the average expression level across all cells within cluster.
See also Figures S1–S4.
We used the Seurat package for scRNA-seq data filtering and processing (see STAR Methods). We removed cells with fewer than 200 genes detected, fewer than 1000 UMIs, or with more than 20% of UMIs mapped to mitochondrial genes (Figures S1A–S1C). Applying these filters eliminated erythroblasts to levels similar to those observed in samples where RBC lysis was performed, suggesting that the RBC step could be omitted (Figure S1E). We also found that the use of Calcein–based fluorescence-activated cell sorting (FACS) to enrich for viable cells altered the cellular composition. Specifically, cell sorting based on Calcein positivity decreased the incidence of myogenic cells (MuSCs/progenitors and mature myonuclei) and anti-inflammatory macrophage populations (Figure S2). This could be due to biases introduced by viability selection, perhaps owing to reduced metabolism of Calcein by quiescent cells. Based on this observation, we omitted FACS viability sorting in the collection of these scRNA-seq datasets.
After filtering, the scRNA-seq datasets each contained, on average, 3,444 ± 1,286 cells. We compared time-point replicate datasets generated from different mice (n = 2–3) to evaluate batch effects and mouse-to-mouse variability. We observed only minor differences, most notably a small variation in the incidence of macrophage population in day 7 post-injury samples (Figure S1D), suggesting that these datasets contained minimal batch effects. Thus, for subsequent analyses, we combined time-point biological replicates, without batch correction, to improve cell sample size and statistical power. Initially, the samples were assembled into a unified transcriptomic atlas containing 34,438 cells, expressing a total of 19,584 detectable genes (Figures 1B and S1A). We next annotated the cell types present in this muscle regeneration atlas. We employed uniform manifold approximation and projection (UMAP) to visualize the individual transcriptomes of all cells in the unified dataset (Figure 1B) (Becht et al., 2018). Independently, we performed unsupervised shared nearest neighbor (SNN) clustering, which partitioned cells into 12 groups based on their transcriptomic programs after optimizing the SNN resolution parameter by silhouette analysis (Figures 1B, S1F, and S1G). We observed more refined groups, potentially revealing additional subtypes and cell states, when SNN clustering was applied to samples collected at individual time-points (see Figure 2). In examining the full atlas, we interpreted the clusters as broadly defining 12 different cell populations. To identify these populations, we examined the normalized expression level and frequency of canonical cell type genes and named them based on their exclusivity in these expression patterns (Figure 1C). To discriminate more ambiguous populations, especially in the immune sub-population, we performed differential gene expression analysis between cells within the cluster and all other cells in the atlas (Figures S3 and S4).
Figure 2. Cell Composition and Gene-Expression Dynamics of Muscle Regeneration.
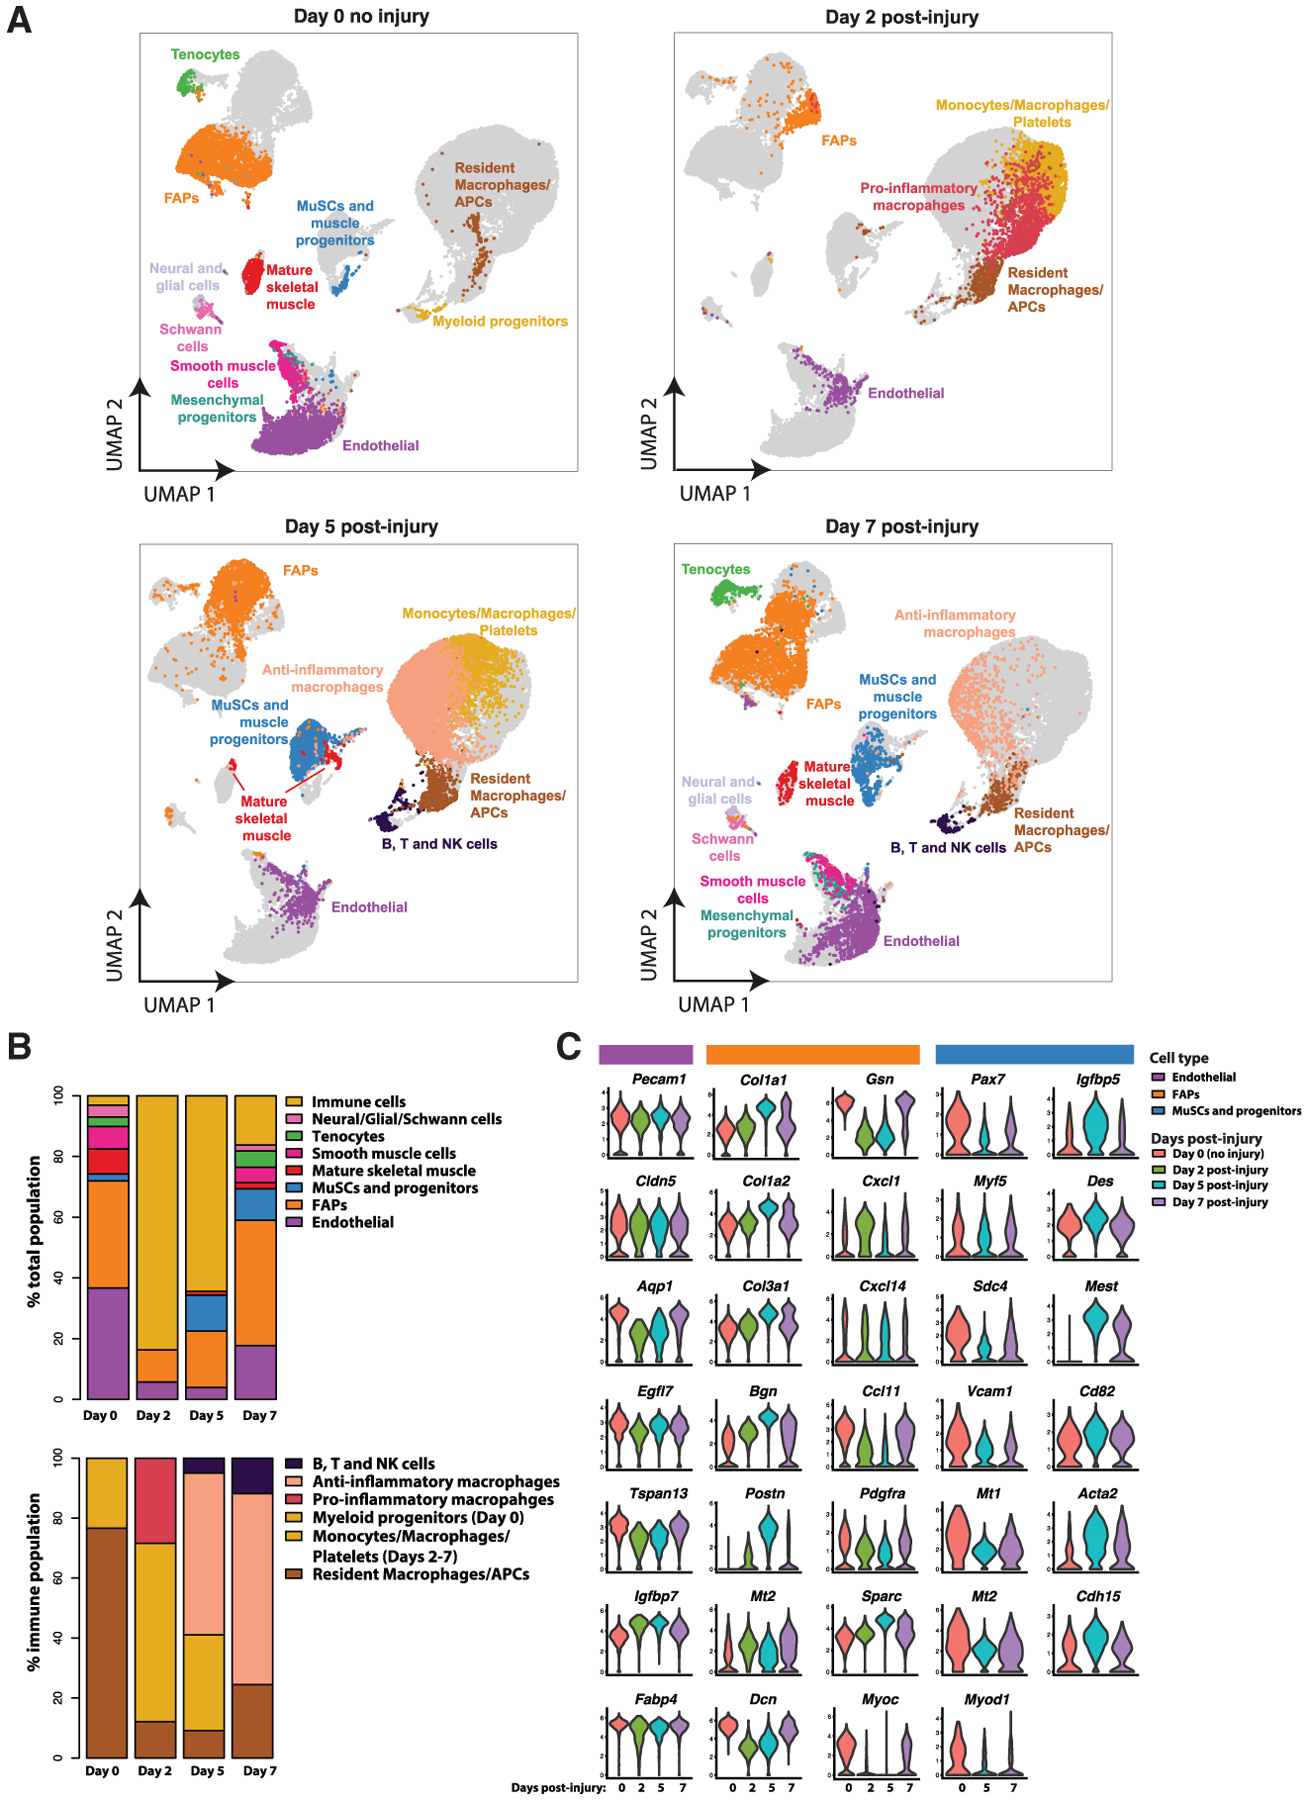
(A) UMAP atlases of muscle single-cell transcriptomes split by time-points post-injury containing, respectively, 7,025, 5,524, 14,240, and 7,646 cells for days 0, 2, 5, and 7 post-notexin injury. Fifteen total cell types were identified using SNN clustering applied to each time-point. Cells from other time-points are in gray.
(B) Compositional dynamics of cell types throughout the regeneration time course. Immune cells are grouped together (top) or separated (bottom).
(C) Violin plots presenting the heterogeneous gene-expression changes for a selection of differentially expressed genes within the endothelial, FAP, and MuSC and myogenic progenitors’ populations at each time-point. MuSCs and myogenic progenitor cells were too rare at day 2 to analyze.
See also Figures S3 and S4.
We observed a population of myogenic progenitors, containing MuSCs and myoblasts, which expressed the myogenic transcription factors Pax7 and Myod1 (Wang and Rudnicki, 2011). We detected a population of mature myocytes and/or myofibers, which expressed Myh1 (myosin heavy chain 1) and Acta1 (skeletal muscle alpha actin 1), both proteins involved in the contractile function of terminally differentiated skeletal muscle cells (Lyons et al., 1990). The limited incidence of this population is likely due to the size-filtering-out of multinucleated myofibers during the cell isolation protocol. Acta1 is also expressed, but at a lower level and frequency, in other cell types, which is not surprising given that it is a common component of the cytoskeleton and plays a role in cell migration. Multiple non-myogenic cell populations, including FAPs, tenocytes, smooth muscle cells (SMCs), mesenchymal progenitors, endothelial cells, neuro-muscular cells, and at least five different immune cell populations were annotated as described in Figure S4. This annotated scRNA-seq dataset provides a reference atlas to examine the cell populations and gene-expression dynamics during muscle regeneration.
Cell-Type and Gene-Expression Dynamics of Muscle Regeneration at Single-Cell Resolution
Next, we analyzed the transcriptomic atlas to assess how these populations are dynamically altered in incidence and gene expression following muscle injury. Overall, we discerned between 5 and 12 distinct cell populations via SNN clustering at each time-point for a total of 15 unique populations (Figure 2, A and B). Uninjured muscles (day 0) were largely composed of endothelial cells, FAPs, and mature myocytes/myonuclei, with other cell populations detected infrequently. After injury, we observed a transient increase in multiple immune cell types and a concomitant decline in non-immune populations. By day 5, the immune cell population diversified while the myogenic populations recovered. By day 7, most cell populations approached their day 0 frequencies and gene-expression states (Figures 2C and S4B), revealing a return toward homeostasis.
Pecam1-expressing endothelial cells were the most abundant cell population at day 0 (38%) and exhibited only minor changes in detection frequency and gene-expression heterogeneity throughout the time-course (Christov et al., 2007). In contrast, Pdgfra-expressing FAPs exhibited compositional and expression variability. FAPs were a substantial cell fraction of uninjured muscles (31%) and expressed the ECM genes Col3a1, Dcn, and Gsn in homeostasis (Figures 2A, 2C, 3, and S3). At day 2 post-injury, FAPs also expressed Ccl7, Cxcl5, and Cxcl1, chemokines that attract monocytes and neutrophils. FAPs have elevated expression of Col1a1, Col1a2, and Mt and diminished expression of Gsn and Dcn, suggesting an “activated” or “remodeling” state (Figures 3A and 3B). At day 5, FAPs have further elevated expression of Col1a1 and Col1a2 and also express Postn, Bgn, and Sparc. At day 7, the FAP expression profile resembles the uninjured samples, albeit with more heterogeneity, indicating a resolution to homeostasis.
Figure 3. Single-Cell Dynamics of Fibro/Adipogenic Progenitors (FAPs) during Muscle Regeneration.
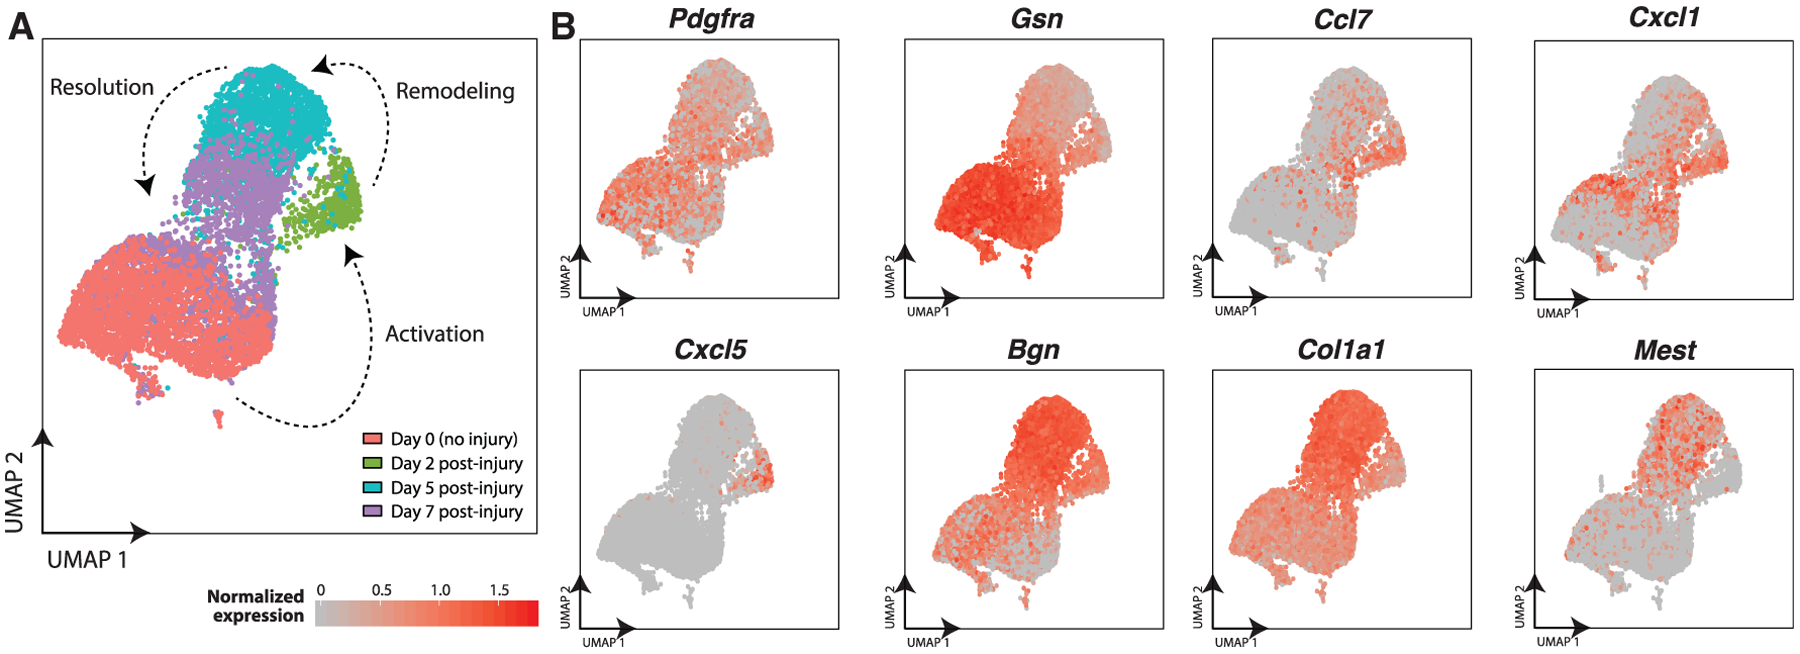
(A) UMAP atlas of FAP single-cell transcriptomes. Subset of full UMAP in Figure 1 focusing on FAP cluster. Cells colored by sample day.
(B) Single-cell expression levels for select FAP gene markers.
See also Figure S3.
Likewise, the immune cell populations within this atlas exhibit notable dynamics. At day 0, we detect that immune cell populations comprise 5% of the uninjured muscle, and can be subdivided into a more defined group of Cd79+ Ly6d+ immature myeloblasts, Cd3+ T cells, and a group of resident macrophages and APCs expressing Lyz2, Cd74, and Ccl6 (Figures S3 and S4). At day 2, the inflammatory response initiates, as reflected by a dramatic increase in the frequency (84%) of immune cells detected (Figure 2A). This early-response immune compartment can be divided into three populations. First, we observed APCs characterized by expression of MHC class II proteins such as Cd74 and the H2 family. Within this group we distinguish small populations of Cd7+ mature T cells, Klrd1+ NK cells, and Cd209a+ dendritic cells. Second, we identified pro-inflammatory macrophages (including activated M1-like macrophages) that express Ccl9 (a chemokine that attracts Cd11b+ Ccr1+ dendritic cells), Ccr2 (a chemokine involved in monocyte chemotaxis), and Ly6c2. Third, we observed a less defined group of cells that express a wide variety of markers including Cd68+ monocytes and Pf4+ platelets (Figure S4). At day 5 post-injury, immune cells remain prevalent (64%) (Figure 2A). We observed, however, a shift in the macrophage population from a pro-inflammatory to an anti-inflammatory phenotype. We found that these macrophages express C1q complement genes as well as Apoe, characteristic of the M2-like anti-inflammatory phenotype (Baitsch et al., 2011; Ho et al., 2016). We detect some Aif1+ macrophages and/or dendritic cells that have been reported to modulate muscle repair (Kuschel et al., 2000). We found elevated frequencies of APCs, Lsp1+ Ccr7+ B cells, Ccl5+ Xcl1+ T cells, and Nkg7+ Klrd1+ NK cells (Figure S4). At day 7, immune cells were more infrequent (17%) and started to resemble their day 0 cell type composition, with some M2-like macrophages, T-lymphocyte, and NK-cells remaining.
The myogenic cell populations exhibited a temporal profile that was inverted in abundance relative to the immune cells and transcriptionally heterogeneous. At day 0, we detected a small population (2%) of MuSCs and progenitor cells expressing Pax7, Sdc4, Vcam1, and Myod1, and also detected Acta1+ Myl1+ mature myocytes and/or myofiber nuclei (9%). At day 2, we did not detect any MuSCs or progenitors, though they are reported to be in an activated state following notexin injury. This surprising finding is likely due to the relative rarity of myogenic cells compared to immune cells, providing a sampling challenge at this time-point. At day 5, we observed a large increase in the relative abundance of the MuSC/progenitor population (12%). This population heterogeneously expressed lower levels of Pax7, Vcam1, and Sdc4, higher levels of Myod1, Des, Mest, and the cell cycle inhibitor Cdkn1c, suggesting they include cells in varied activation and/or cycling states (Figure 2C). This population also expressed Igfbp5, known to regulate myogenic differentiation (Ren et al., 2008). At day 7, the myogenic cell population remained in a heterogeneously activated and differentiated state with some recovery of Pax7+ MuSC population (Figure 2C).
Lastly, some cell populations were almost exclusively found at days 0 and 7. We observed a small (3%) population of tenocytes that express the canonical marker Scx (scleraxis) as well as Tnmd (tenomodulin), Fmod (fibromodulin), and Thbs4 (thrombospondin) (Giordani et al., 2019; Tan et al., 2020) (Figure S3). We also observed two closely related populations of mesenchymal progenitors and smooth muscle cells, which were distinguished based on their expression of Myh11 and Acta2. In a similar manner, Schwann cells (enriched for Mpz, Mbp, Fxyd3, and Prx) were distinguished from other related neural and glial cells (enriched for Ptn, Postn, Cadm1, Lyz2, and Col20a1) (Figure S3).
Single-Cell Trajectory Inference Organizes a Myogenic Cell Continuum Involved in Muscle Regeneration
The consensus model of adult muscle regeneration states that a subset of MuSCs leaves quiescence after tissue damage and enters an activated cycling state to generate progeny through a combination of asymmetric and symmetric division events (Wang and Rudnicki, 2011). These myogenic progenies adopt multiple fate trajectories, including return to Pax7+ quiescent MuSCs, differentiation into proliferative Pax7− Myf5+ Myod1+ myoblast progenitors, or commitment into Myog+ fusion-competent myocytes. We asked whether unbiased analyses could reconstruct this consensus model and provide new insights into the continuum of myogenic cell-states.
First, we explored the cellular heterogeneity within the cumulative myogenic cell population by selecting the MuSCs, progenitors, and mature myocytes from the unified transcriptomic atlas. Unbiased SNN clustering revealed five subpopulations of myogenic cells (Figure S5A). These subpopulations clarify the myogenic heterogeneity in two ways: across post-injury time-points, and within the stage of differentiation (Figure S5B). Cluster 5 is comprised of mature muscle cells (terminally differentiated myocytes) expressing elevated levels of Acta1 and Myh1 from all time-points, whereas clusters 1–4 represent a heterogeneous population of MuSCs and their progeny (Figure S5C). Cluster 1 contains cells from both days 0 and 7 post-injury and is largely enriched for Pax7, Sdc4, Vcam1, and Cd34 transcripts, therefore likely representing quiescent MuSCs. Clusters 2, 3, and 4 contain cells from days 5 and 7 post-injury and that heterogeneously express the myogenic activation and commitment markers Myf5, Myod1, and Myog and have reduced expression of MuSC markers, suggesting these each contain a mixture of activated MuSC and myoblasts. Notably, clusters 2–4 likely represent a varied but sequential transition toward myogenic commitment, which is exemplified by stepwise elevation in Myog expression. Therefore, we conclude that cluster 4 is comprised of committed myoblasts whereas clusters 2 and 3 primarily contain activated MuSCs. These clusters describe an organized partitioning of the myogenic cell population.
Next, given that SNN clustering lacks hierarchical structure, we sought to organize these subpopulations using a trajectory inference model to delineate their interrelatedness. We applied Monocle reverse graph embedding (Qiu et al., 2017) to the cumulative myogenic cell population within the atlas to infer a hierarchical trajectory (Figure 4A). The Monocle analysis focused on differentially expressed genes across these five myogenic clusters and aligned cells into a one-dimensional “pseudotime” axis. The pseudotime trajectory presented an organized, branched progression of cells from quiescent MuSCs to cycling and committed progenitors to mature muscle cells, which can be seen by labeling individual cells using the cell population annotations from the unified atlas in Figure 1B. Both the beginning and ending branches within the trajectory are composed of cells from days 0 and 7 post-injury, indicating they consist of Pax7hi quiescent MuSCs and Acta1hi terminally differentiated myocytes, respectively, which are both absent at intermediate time-points (Figure 4A). A subset of cells diverts at the central node into a third branch comprised of days 5 and 7 post-injury cells enriched for Cdk1 and Cdc20, indicating that they are actively cycling myoblasts. Near the central node, we observed days 5 and 7 post-injury cells that expressed myoblast and myocyte markers such as Myog and Myod1 (data not shown). We interpret this branch structure as a bidirectional trajectory in which activated and cycling progenitors (predominantly from day 5 post-injury) can bifurcate either toward further commitment into terminal myocytes needed for myofiber repair or toward a return to quiescence.
Figure 4. Inferring a Muscle Stem/Progenitor Cell Hierarchy using Monocle Pseudotime Model.

(A) All cells within the muscle stem/progenitor and mature skeletal muscle myonuclei clusters (3,276 total cells) from days 0, 5, and 7 post-injury (top left) were selected and re-analyzed by SNN/UMAP (bottom left) and Monocle reverse graph embedding (right). Graph embedding results are presented with cells color-coded by day and labeled by SNN cluster identities.
(B–D) A refined analysis of muscle stem and progenitor subpopulations, after removal of mature myocytes, by Monocle. These non-mature muscle cells were subjected to reverse graph embedding and trajectory inference using Monocle’s differential expression analysis to identify cell groups (“branches”).
(B) The top-75 differentially expressed genes in the three branches (Qu, quiescent MuSCs; Cy, cycling progenitors; Co, committed progenitors), organized by branch and then ordered within each branch by pseudotime value (see Figures S5D and S5E).
(C) Monocle feature plots showing three branch groups (Qu, Cy, Co) connected by a learned manifold (black lines). Same colors are used to associate individual cells with branch groups in (C, top left) and (D). The abundance of Pax7, Myog, and Cdk1 transcripts are plotted for individual cells using a Z score normalized color-scale.
(D) Pseudotime ordered single-cell expression trajectories for genes enriched in the quiescence (Qu) cluster (Pax7, Btg2), in the cycling (Cy) cluster (Cdk1, Cdc20), and in the commitment (Co) cluster (Myog, Cdkn1c). Overlaid lines correspond to inferred cell trajectories associated with ending in the cycling (hatched) and commitment (solid) clusters.
See also Figure S5.
Last, we analyzed the trajectory of the myogenic stem/progenitor cell population by removing mature muscle cells (Figures 4B–4D and S5D–S5E). This refined trajectory model identified three branches of immature myogenic cells within the transcriptomic atlas, distinguished by their quiescent (Qu), cycling (Cy), and non-cycling committed (Co) signatures. The Qu branch is enriched for Btg2 and Id3 expression, whereas the Cy branch is enriched for G2-state mitotic genes Cdk1, Cdc20, and Ccnb2, and the Co branch is enriched for the cell cycle inhibitory genes Cdkn1c and Myog. When visualized with respect to the pseudotime progression axis, these genes help distinguish between cells likely to project into “cycling” and “committed” cell fates (Figures 4B–4D). In conclusion, Monocle analysis of myogenic single-cell transcriptomes during tissue regeneration confirms the generally accepted model of adult myogenesis and provides a continuum of intermediate myogenic populations based on cell cycle and commitment gene-expression patterns. The clustering and trajectory model together suggest that Sdc4, Id3, and Btg2 are transcriptional markers that aid in decomposing MuSC heterogeneity and may regulate distinct MuSC states.
Diversification of Syndecan Receptor Expression in Myogenic Stem and Progenitors Provides Stage-Specific Heterotypic Cell Communication Channels
Cell communication signals, acting through secreted ligands binding to receptors on muscle stem and progenitor cells, govern a multitude of cell-fate regulation mechanisms critical for muscle homeostasis and regeneration (Yin et al., 2013). To explore the dynamic cell communication network governing muscle repair, we generated a model that scores for interactions between receptors expressed by non-mature myogenic cells and ligands expressed by other cell types. We reasoned that this model could identify ligand-receptor co-expression pairs that provide “insulated” heterotypic cell-cell interactions potentially influencing cell-fate outcomes in myogenic cells but no other cell types in muscle. First, we considered possible ligand-receptor pairs from a database containing 2,009 mouse intercellular interaction signals (Skelly et al., 2018). Second, we identified receptor genes from this list that are differentially expressed in the MuSC and progenitor cell populations relative to all other cells within the transcriptomic atlas at any time-point. Third, we calculated interaction scores by multiplying the average transcript expression value of each differentially expressed receptor gene in the myogenic stem/progenitor cell populations by the expression value of each cognate ligand gene (averaged over all cells within each other annotated cell population). We note this model does not consider spatial proximity between cell types, whether proteins are expressed, or whether the putative interaction pairs are documented specifically within myogenic cells.
Our model identifies 63 and 158 ligand-receptor pairs for the uninjured and injured (days 5 and 7 post-injury, combined) muscles, respectively, and 87 of these pairs were unique to injured samples (Figures S6A and S6B). We only select interactions where the receptor is differentially expressed in the MuSC and progenitor population. Moreover, for each pair, we consider the interaction significant when the score is greater than the 50th percentile when compared to all cell types. We represent significant interactions by a pairwise chord plot (Figure 5A). In uninjured muscles, the majority of these pairs involve myogenic cell expression of receptor genes Fgfr1, Fgfr4, Sdc4, Tgfbr3, Cd63, or Cd82, consistent with findings that MuSCs express diverse members of the fibroblast growth factor receptor (FGFR), Syndecan (Sdc), TGF-β, and tetraspanin families (Pawlikowski et al., 2017). Notably, Fgfr1 and Fgfr4 interactions are mediated by a diverse set of 15 FGF ligand genes expressed across multiple cell types (mature skeletal myocytes, FAPs, tenocytes, and neural/glial/Schwann cells), suggesting broad redundancy in FGFR signaling interactions in uninjured muscles (Figures S6A and S6B). This possible ligand-receptor promiscuity is also exemplified by the pairs involving Sdc4, the only Sdc gene differentially expressed by myogenic cells within uninjured muscles, which may involve multiple Sdc-interaction ligands derived from a variety of cell types including Ccl5 (myeloid progenitors), Thbs1 and Tnc (tenocytes), Fgf2, Tfpi, Mdk, and Rspo3 (FAPs), Tgm2 and Cxcl12 (SMCs), and Adam12 (neural/glial cells), and Fgf6 (mature myocytes). In the injured muscle we observed a diversification in the potential ligand-receptor interaction landscape, highlighted by inclusion of additional myogenic cell receptor genes (Sdc1, Sdc2, Notch1, Notch3, and Cd151) within the model-identified interaction pairs. Notably, these model suggestions arise from a database curated with prior findings in other cell types (e.g., RSPO3-Sdc4; Ohkawara et al., 2011) and, as such, can only provide a refined list of possible signaling interactions in mouse myogenic cells.
Figure 5. Ligand-Receptor Model Reveals Diversification of Communication Signals Linked to Heterogeneously Expressed Syndecan Family Receptors during Muscle Regeneration.
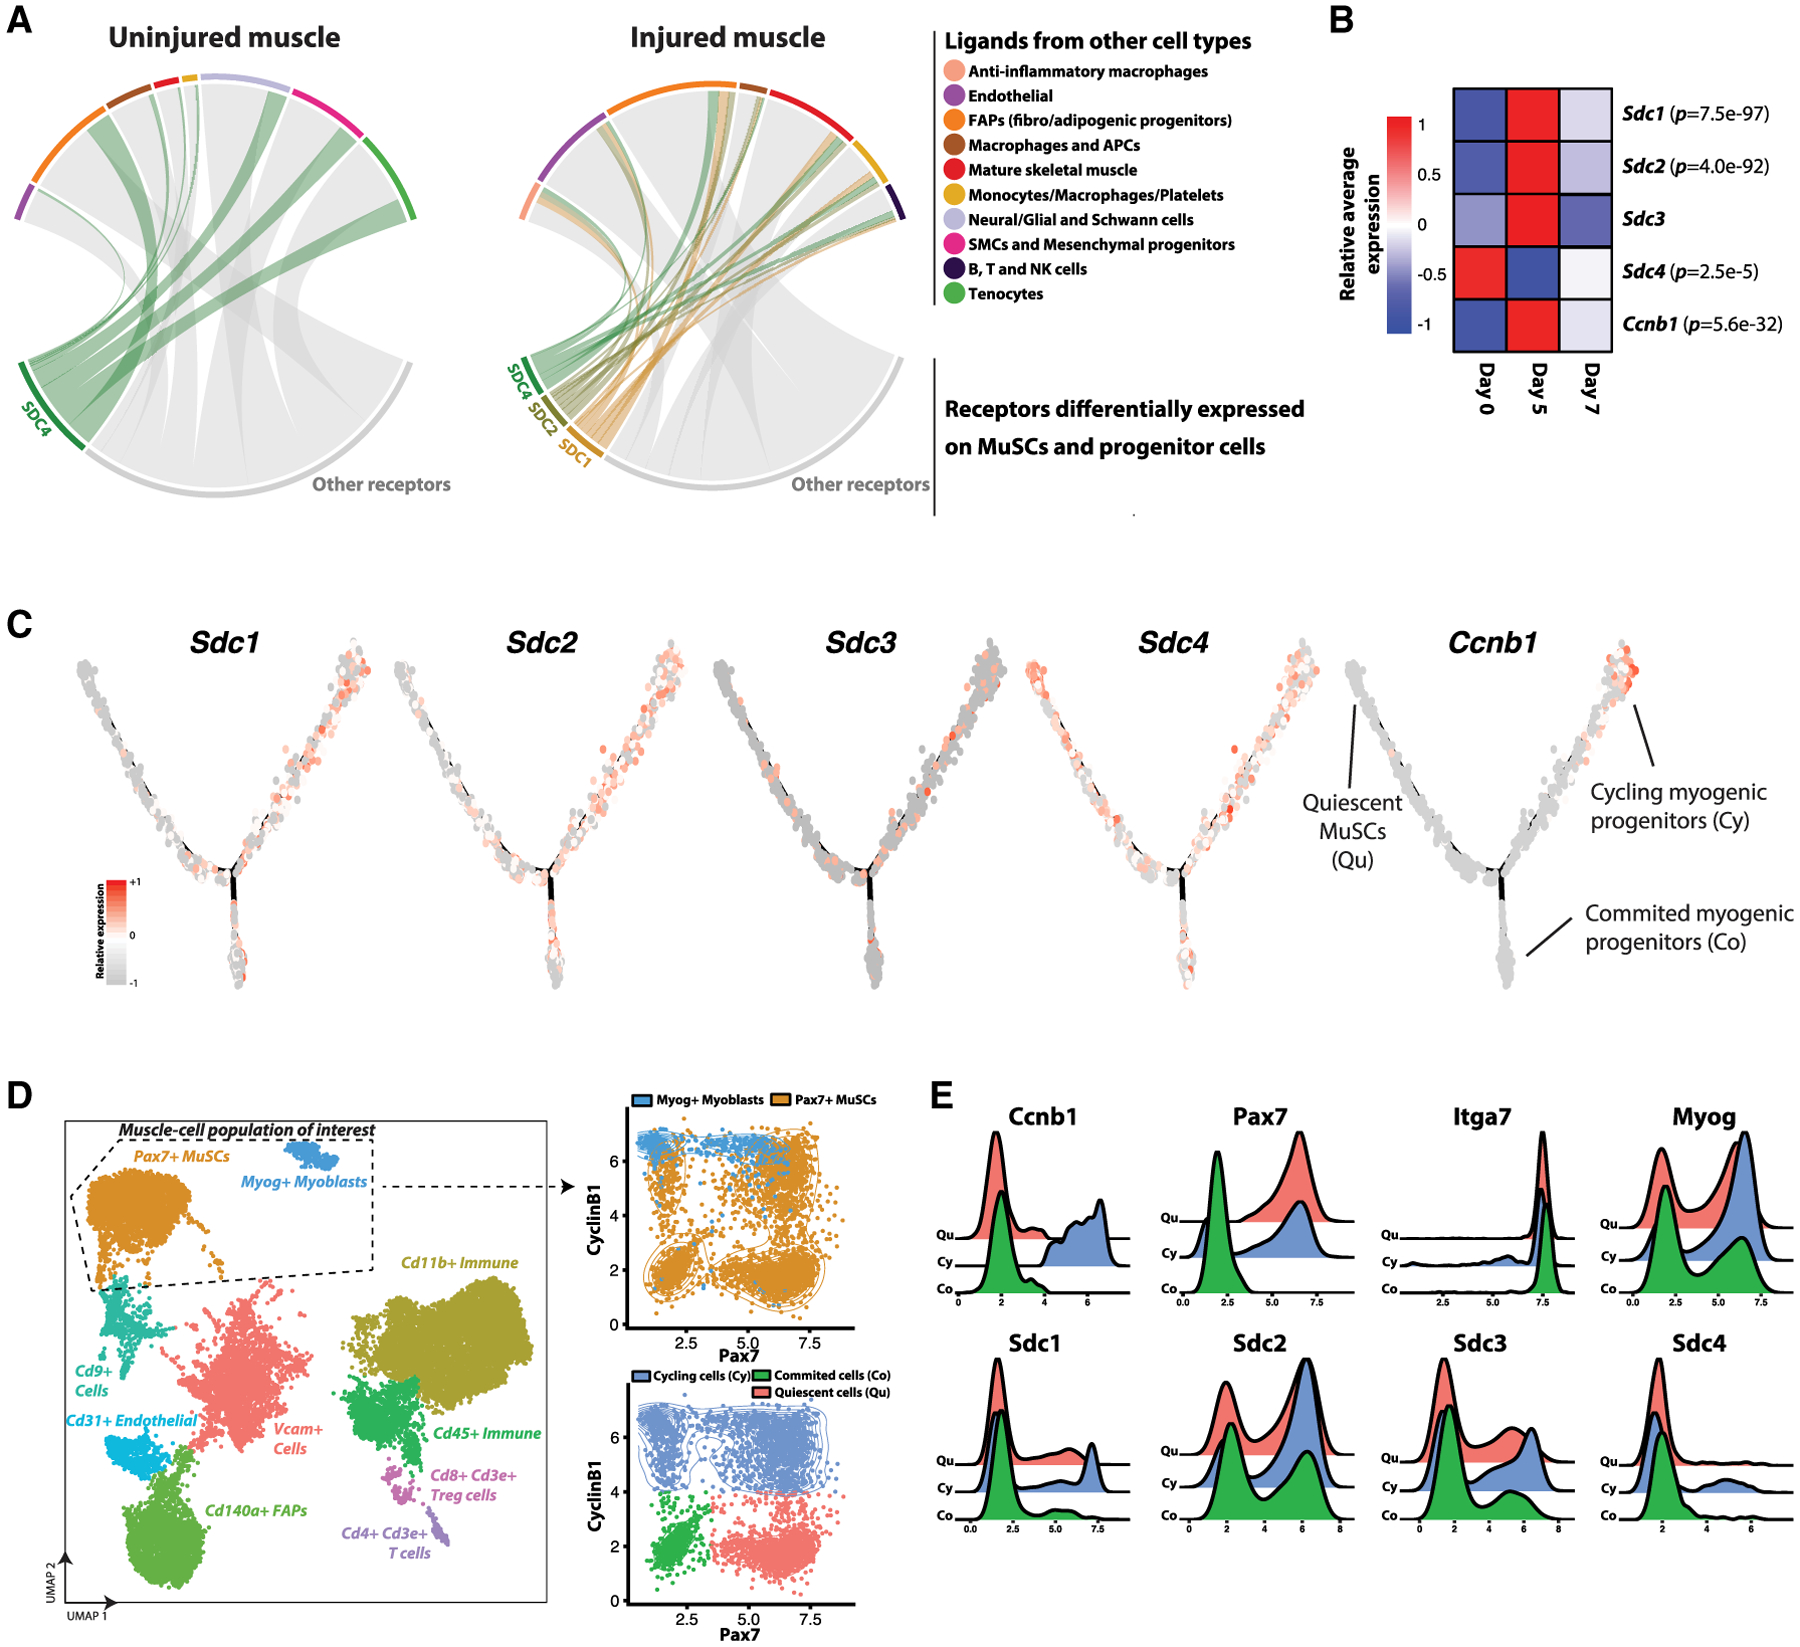
(A) Chord plot summarizing the significant pairwise interactions between receptor genes that are differentially expressed in the MuSC and progenitor cell population and ligand genes expressed by other cell types within the transcriptomic atlas. (Left) Uninjured (day 0) samples. (Right) Injured (days 5 and 7 post-injury) samples. Differentially expressed receptor genes outside of the Syndecan family are in gray. For a given ligand-receptor pair, we only represent interactions whose score (Figures S6A and S6B) is greater than the 50th percentile across all cell types.
(B) Sdc1/2/3/4 and Ccnb1 (Cyclin-B1) transcript averages across all non-mature myogenic cells within the transcriptomic atlas, split by days post-injury. p values listed if differentially expressed across time-points when modeled using a negative binomial distribution.
(C) Ccnb1 and Sdc1/2/3/4 gene-expression levels within the myogenic cells organized into the Monocle trajectory (see Figure 4C).
(D) (Left) CyTOF atlas, consisting of 19,028 cells collected from regenerating (day 5 post-injury) muscles and stained with a panel of 35 antibodies (see Table S1) including Syndecan-1/2/3/4 and Cyclin-B1. UMAP and unsupervised SNN clustering identified 11 populations including a population of Pax7+ MuSCs (orange) and Myog+ myogenic progenitors (blue). These two myogenic clusters were grouped for further analysis. (Right) Cyclin-B1 versus Pax7 scatterplots. (Top) Coded using CyTOF SNN cluster identifiers. (Bottom) Coded by subpopulation gates: Cyclin-B1− Pax7+ quiescent cells (Qu; pink), Cyclin-B1+ cycling progenitors (Cy; blue), and Cyclin-B1− Pax7− committed myocytes (Co; green).
(E) Expression histograms for Syndecan-1/2/3/4 and other myogenic markers for the three subpopulations identified in (D).
See also Figure S6.
Given the observed frequent and diverse involvement of Sdc receptor genes in these co-expressed ligand-receptor scores and their documented role in MuSC regulation (Cornelison et al., 2004; Pisconti et al., 2012) we asked whether Sdc genes exhibit stage-specific expression patterns within the myogenic compartment of the transcriptomic atlas. We performed differential gene expression testing on the non-mature myogenic cell populations within the transcriptomic atlas between the days 0, 5, and 7 samples, and found that Sdc1 and Sdc2 were elevated at day 5 post-injury (along with the cycling MuSC gene Ccnb1), and Sdc4 was elevated in the uninjured muscle (Figure 5B). Further, Sdc1 and Sdc2 have enhanced expression in the Ccnb1hi Cy branch of the Monocle trajectory (Figure 5C).
We validated Sdc protein expression variation at different stages of the myogenic hierarchy through an independent analysis based on multiparameter mass cytometry (CyTOF). We immunostained a single-cell suspension from digested muscles at 5 days post-notexin injury using a panel of 35 antibodies (includingSdc1–4) to label myogenic and other cell types. After gating for live cells and removing debris (Figure S6C), the CyTOF data were analyzed using a similar bioinformatic pipeline as used for scRNA-seq datasets. Unsupervised SNN clustering revealed 11 subpopulations of cells including endothelial cells, FAPs, macrophages, lymphocytes, mesenchymal progenitors, an unresolved group of Cd9+ cells, and two myogenic populations (Figure 5D). One myogenic population consisted of Pax7+ MuSCs whereas the other consisted of Myog+ myoblasts and myocytes. These myogenic populations were merged, and subpopulations were gated based on their cycling and Pax7 expression status into quiescent cells (Cyclin-B1− Pax7+), cycling progenitors (Cyclin-B1+), and committed myocytes (Cyclin-B1− Pax7−) (Figure 5E). We observed that these three subpopulations uniformly express the myogenic surface marker Itga7 (Integrin-α7) but have heterogeneous expression of Sdcs. In particular, subfractions of cells highly expressing Sdc-1/2/3/4 were all enriched in the cycling progenitors compared to other myogenic subpopulations. These observations provide confirmation of Sdc protein expression heterogeneity, matching the Sdc transcript heterogeneity observed in the hierarchically organized muscle cell atlas. Further, the transient induction of Sdcs in cycling (Cyclin-B1+) muscle progenitors may allow for diversified signaling responses to heterotypically secreted ligands in regenerating, but not uninjured, muscles.
Ligand-Receptor Interaction Model Identifies Paracrine Communication Factors Influencing MuSC Proliferation In vitro with Differential Dependence on Syndecans
To examine the role of the ligand-receptor interaction pairs on MuSC function, we performed in vitro recombinant protein treatment tests on cultured MuSCs and focused on Sdc interactions given their prevalence in the transcriptomic dataset (Figure 5A). First, we inspected a rank-ordered list of interaction scores involving Sdc genes and selected ligands to test based on the highest score values and the availability of commercial recombinant proteins (Figures 6A and 6B). We chose eight secreted proteins, including FGF2, TGFβ1, and CXCL12/SDF1, which have well-documented influences on muscle stem/progenitor cell fate outcomes and six others (PF4/CXCL4, CCL5, THBS1, MDK, and RSPO3) that have not been reported to play a role in MuSC function. We also chose three extracellular matrix proteins (Fibronectin [Fn], Tenascin-C [TnC], and Laminin [Lam]), which were involved in multiple Sdc interaction pairs. Some of these exhibit cell-type-specific gene-expression patterns, exemplified by Rspo3, which is almost exclusively transcribed by FAPs; however, most are expressed by multiple muscle cell types (Figure 6C). We performed an in vitro ligand treatment screen on MuSCs isolated from young-adult Luciferase transgenic mice by FACS sorting. In this screen, we tested seven ligand candidates in the context of each extracellular matrix (ECM) protein (pre-coated onto tissue culture plastic) and with or without FGF2 co-treatment (Figures 6D and 6E). We observed MuSC proliferation enhancement or suppression by specific ligand treatments in a context-dependent manner. Notably, TGFβ1 increased cell number whereas RSPO3 and PF4 decreased cell number across many co-treatment conditions.
Figure 6. Syndecan Family Proteins Differentially Mediate Paracrine Ligand-Induced Muscle Stem/Progenitor Cell Proliferation.
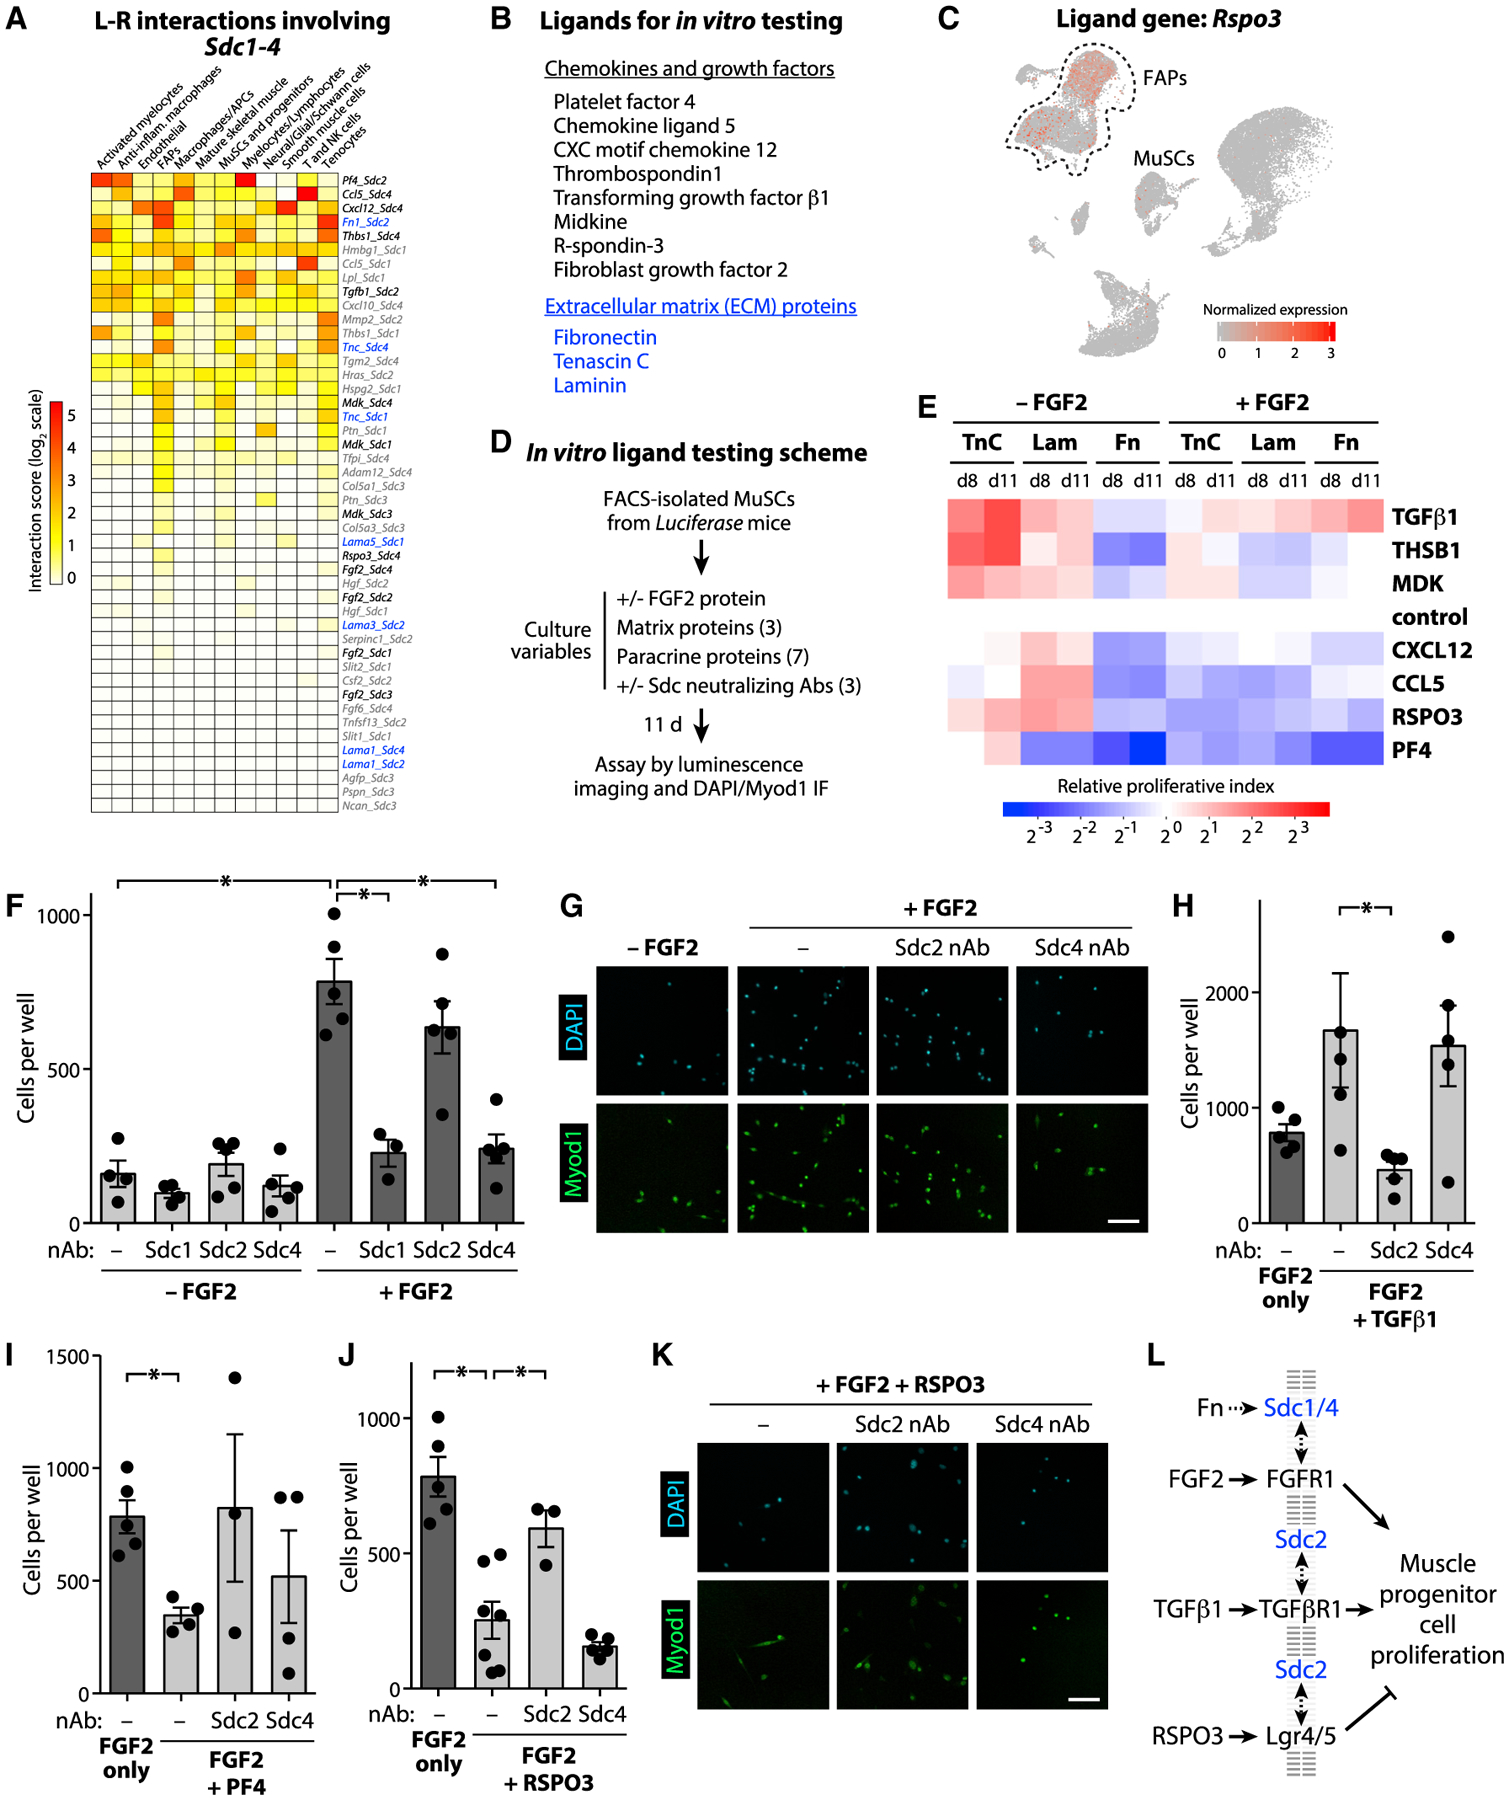
(A) Transcriptomic interaction scores for any ligand-receptor pairs involving Sdc family genes. Interaction scores were calculated by averaging across all cells within the same annotated cell-type collectively among the days 0, 5, and 7 samples. Scores were summed across all cell-types and then rank-ordered in the heatmap.
(B) Ligand-receptor candidate pairs selected for subsequent analysis are indicated in black (for soluble factors) or blue (for ECM factors).
(C) UMAP feature plot of the full atlas showing the normalized expression level of ligand gene Rspo3.
(D) Scheme for in vitro testing candidate ligands. MuSCs were isolated from 3-month–old Luciferase transgenic mice by (PI/CD45/CD11b/CD31/Sca1)− CD34+ Integrin-α7+ sorting.
(E) Initial screen of candidate ligands. Proliferative index of Luciferase-expressing MuSCs in culture on either Tenascin C-, Laminin-, or Fibronectin-coated tissue culture plastic, with or without FGF2, and treated with 7 different candidate ligands. Data presented as mean of n=4–8 replicates and normalized by time-point (day 8 or 11) and treatment condition to the non-ligand controls.
(F–K) Proliferation of MuSC in culture on Fibronectin-coated plastic, treated with or without FGF2 (F–K), TGFβ1 (H), PF4 (I), and/or RSPO3 (J), and neutralizing antibodies (nAbs) to Syndecan-1, −2, or −4. Cell count data in (F), (H), (I), and (J) are presented as mean ± SEM of n=3–6 replicates. Asterisk (*) indicates comparisons with p value < 0.05 by unpaired t test. (G and K) Representative immunofluorescence (IF) images of myogenic cell proliferation assayed by nuclei counts (DAPI) and anti-Myod1 staining at 11 days. Scale bars: 100 μm.
(L) Summary of ligand-induced myogenic cell proliferation findings.
These trends were most consistent on Fn substrates with FGF2 mitogen co-treatment, so we used these conditions to examine the dependence of Sdc activity by applying neutralizing antibodies to Sdc1, Sdc2, or Sdc4 (Figures 6F–6K). We observed no changes of MuSC survival and proliferation due to Sdc-neutralizing antibodies in the absence of FGF, but we found that both Sdc1 and Sdc4 neutralizing antibody treatments reduced FGF2-stimulated MuSC proliferation (Figures 6F and 6G). For the other ligands, we performed only Sdc2 and Sdc4 neutralization tests given that the ligand-receptor interaction model identified a meaningful interactions between these factors (TGFβ1, RSPO3, and PF4) and Sdc2 or Sdc4, but not Sdc1 (Figures 6H–6K). In the context of Fn/FGF2 cultures, we observed that myogenic progenitor cell proliferation was further enhanced by TGFβ1 and suppressed by RSPO3. Neutralizing antibody perturbations showed that both effects were dependent on Sdc2 but not Sdc4. Across all treatments, cells were observed to exhibit nearly uniform Myod1-positivity at day 11 of culture (Figures 6G–6K). These findings suggest that Sdc-mediated interactions influence myogenic progenitor (myoblast) proliferation rates rather than cell differentiation outcomes. Additionally, Sdc co-receptors exhibit diverse, context-dependent roles in myogenic progenitor proliferation such that specific ligand-receptor complexes may differentially engage with Sdc1/4 or Sdc2 to potentiate their effects (Figure 6L).
DISCUSSION
Combined with the development of increasingly complex computational methods, scRNA-seq has emerged as a powerful tool to profile the transcriptome of thousands of individual cells in one experiment (Stuart and Satija, 2019). ScRNA-seq analysis permits an unbiased survey of cellular complexity and heterogeneity with substantial experimental scope. Here, we leverage these recent developments to build a comprehensive temporal atlas of muscle tissue repair with over 34,000 single-cell transcriptomes, adding to the growing repository of single-cell skeletal muscle datasets.
To date, a handful of muscle-focused scRNA-seq projects have been reported. The first study was performed on FACS-sorted Pax7-tdTomato+ MuSCs using the Fluidigm C1 system (Cho and Doles, 2017). Though limited to 21 single MuSCs, it provided a transcriptomic overview of MuSC heterogeneity, and displayed enriched levels of Sdc4 transcripts. The study also highlighted some technical limitations, low recovery of Pax7 transcripts, which motivated the need to generate greater numbers of single-cell transcriptomes to allow more robust statistical analyses. Recently, Giordani et al. (2019) presented a transcriptomic atlas of 12,441 muscle-resident cells. Their study identified 10 distinct types of cells, including a population of Integrin-α7+ Vcam1− smooth muscle and mesenchymal cells that enhance MuSC engraftment when co-transplanted in mice. Their findings illustrated the potential of high-throughput single-cell analysis to reveal poorly described populations and to generate new hypotheses. Whereas the Giordani et al. (2019) study focused on homeostatic mouse muscle tissue, another recent scRNA-seq study focused on regenerating muscle. Dell’Orso et al. (2019) presented a transcriptomic atlas of about 3,500 FACS-sorted MuSCs and progenitor cells from homeostatic and notexin-injured muscles. They identified two subpopulations of MuSCs with distinct yet overlapping gene-expression profiles corresponding to a quiescent and activated state. In addition, they aligned, in pseudotime, injured and uninjured MuSCs and primary myoblasts to reveal 7 classes of genes, including of mitochondrial and glycolytic origin, from which they inferred dynamics in metabolic reprogramming activity. Though it is the first report to describe the dynamics of MuSCs activation and differentiation by scRNA-seq, their analysis was limited to FACS-sorted cells and a single time-point post-injury (60 h), which might omit the cellular and temporal complexity of muscle regeneration. Finally, using a CyTOF dataset composed of 23 markers, Porpiglia et al. (2017) built a trajectory model using the X-shift algorithm of myogenic differentiation post-injury. They identified two new surface markers, CD9 and CD104, that were used to describe two subpopulations of muscle progenitors, demonstrating how trajectory models from single-cell data can be used to discover new combinations of surface markers for the prospective isolation of MuSCs and their progeny.
Here, we present a unified and annotated single-cell transcriptomic reference atlas of muscle regeneration in adult mice. Our scRNA-seq and CyTOF analyses confirm prior consensus regarding the cell populations involved in the temporal response to muscle injury, and provide a deeper annotation of additional cell types, subpopulations, and states with more resolved dynamics, compared to prior scRNA-seq studies. We present a comprehensive scRNA-seq dataset compendium describing a total of 34,438 cells (15 different cell types via SNN clustering) including 3,276 from MuSCs and mature muscle cells (Figures 1 and 2). The complexity of this transcriptomic atlas powered development of a hierarchical continuum model of myogenic cell populations and ligand-receptor cell communication analysis (Figures 4 and 5). We also presented a CyTOF dataset composed of 35 markers to provide an orthogonal validation of myogenic subpopulations and their surface receptor expression variability. Trajectory analysis allowed us to parse the myogenic differentiation lineage post-injury in four distinct groups: quiescent MuSCs, cycling progenitors, committed progenitors, and mature skeletal muscle, with distinct gene-expression signatures (Figure 4). Here we resolved that Id3 and Btg2 are both enriched in quiescent MuSCs with their expression decreases following injury-induced MuSC activation and differentiation. Id3 is a DNA binding protein that has been found to be a direct target of Pax7 (Kumar et al., 2009). Id3 is robustly expressed in quiescent MuSCs and blocks differentiation either by directly blocking the activity of pro-myogenic transcription factors such as Myf5, MyoD or by maintaining high levels of Hes1 (Kumar et al., 2009). The role of Btg2 has not yet been previously described in myogenic cells. In hematopoietic and neural lineages, Btg2 promotes differentiation by inhibiting both Id3 and cyclin D1 to restrict cell cycle progression (Yuniati et al., 2019). Though we did not identify the mechanism of Btg2 regulation of myogenic differentiation, these data suggest Btg2 and Id3 are distinct transcriptional markers of quiescent MuSCs.
We developed a cell communication model that allowed us to map interactions between MuSC receptors and ligands expressed by other cell types during muscle repair, which highlighted the complex role of Sdc receptors in coordinating muscle progenitor heterogeneity. Sdcs are transmembrane heparan sulfate proteoglycans that have been characterized as regulators of muscle development, homeostasis, and regeneration (Pisconti et al., 2012). Previous studies have found that Sdc1 is uniquely expressed in developing muscle, while the other muscle Sdcs (Sdc2, Sdc3, and Sdc4) are expressed in MuSCs with differing post-injury expression dynamics specific to each receptor (Pisconti et al., 2012). Sdc3 plays a role in maintaining MuSC quiescence, as Sdc3−/− muscles exhibit a loss in MuSC number and have a homeostasis defect (Pisconti et al., 2010, 2016). Sdc4, in contrast, seems to play a role in MuSCs activation through regulating FGF and hepatocyte growth factor (HGF) signaling (Cornelison et al., 2004). Both our scRNA-seq and CyTOF data suggest that these four Sdcs are expressed heterogeneously, and in a stage-specific manner, at both the transcript and protein level within quiescent, cycling, and committed myogenic stem/progenitor cells (Figure 5). Sdc1, though previously thought not to be expressed in postnatal muscle, was detected both at the transcription and protein level, by scRNA-seq and CyTOF respectively, in activated cycling muscle progenitors and committed cells but not in MuSCs. Moreover, Sdc2 was expressed in some quiescent MuSCs and activated progenitors, Sdc3 expression was restricted to cycling MuSCs and progenitors, and Sdc4 was expressed in quiescent MuSCs and cycling progenitors alike. Together, these Sdcs were involved in a notable fraction of the heterotypic cell communication interactome, suggesting that temporal heterogeneity in Sdc expression may enable myogenic stage-specific fate regulation to a shared set of Sdc-binding ligands.
The mechanistic role of Sdcs in regulating MuSC signal transduction remains poorly understood. Sdc3 cooperates with Notch to promote MuSC cycling and self-renewal (Pisconti et al., 2010). Sdc4 serves as a co-receptor with Fzd7 to promote Wnt7a-induced MuSC symmetric expansion (Bentzinger et al., 2013). These reports suggest that Sdcs may serve as co-receptor proteins that interplay with numerous ligand-receptor systems involved in myogenic cell fate regulatory pathways. We confirmed the role of Sdcs in mediating ligand-stimulated myogenic cell fates through neutralizing antibody perturbation studies in MuSC cultures treated with ligands suggested by the heterotypic communication model (Figure 6). Sdc1 and Sdc4 were both necessary for FGF2/Fn-induced MuSC/myoblast proliferation (Figures 6F and 6G). Sdc2 (but not Sdc4) was necessary for both TGFβ1-augmented and RSPO3-suppressed MuSC proliferation (Figures 6H–6K). These findings demonstrated the utility of a cell-communication-factor–based analysis of muscle regeneration in identifying new heterotypic ligand-receptor interactions involved in MuSC fate regulation. Further, these observations argue that Sdcs serve as diverse co-receptor proteins to potentiate ligand-receptor-stimulated muscle stem/progenitor cell fates and individual Sdc family members may mediate both quiescence and self-renewal/proliferation signaling (Figure 6L).
Though clustering and visualization approaches presented here and by others can be used to identify new cell types and biomarkers, we urge caution on how cell types are defined from these data. First, single-cell data are not immune to technical imperfections such as doublets or sequencing reads that misalign (Stuart and Satija, 2019). Second, single-cell data are sensitive to sample preparation methods, especially from the solid tissue sources. For example, we observed significant variability in the inclusion of tenocytes based on muscle-tendon resection precision (data not shown). We also found other biases introduced in the scRNA-seq composition introduced by FACS sorting, which favored metabolically active immune cells. Furthermore, since scRNA-seq is based on RNA detection, some quiescent cell types such as MuSCs are challenging to unambiguously detect and will benefit from in vivo transcript recovery advances (Machado et al., 2017; van Velthoven et al., 2017). Even with these limitations, our scRNA-seq analysis provides a perspective on myogenic cell types, reconstructed without reliance on prior knowledge, as existing within an ordered continuum of cell-cycle and differentiation states that pass through a critical commitment restriction point. This annotated temporal scRNA-seq atlas of muscle regeneration may provide a reference resource to examine the role of cellular diversity and communication in aging, disease, and across species.
STAR★METHODS
LEAD CONTACT AND MATERIALS AVAILABILITY
Requests for resources and reagents should be directed to and will be fulfilled by the Lead Contact, Ben Cosgrove (bdc68@cornell.edu). This study did not generate any unique reagents.
EXPERIMENTAL MODEL AND SUBJECT DETAILS
Mouse models
The Cornell University Institutional Animal Care and Use Committee (IACUC) approved all animal protocols and experiments were performed in compliance with its institutional guidelines. Adult C57BL/6J mice were obtained from Jackson Laboratories (#000664, Bar Harbor, ME) and were used at 3–7 months of age. All studies used a mix of male and female mice.
METHOD DETAILS
Mouse injuries and single-cell isolation
To induce muscle injury, one or both tibialis anterior muscles of adult (3–7 months of age) C57BL/6J mice received a single 10 μL intramuscular injection of notexin (10 μg/ml; Latoxan, France). For scRNA-seq and CyTOF analyses, one tibialis anterior muscle per mouse was collected to generate single-cell suspensions at either 0, 2, 5, or 7 days post-notexin injury. For cell culture studies, both quadriceps, tibialis anterior, and gastrocnemius muscles were collected without prior injury. Muscles were digested with 2.5 mg/ml Collagenase D (Roche, Basel, Switzerland) and 0.04 U/ml Dispase II (Roche, Basel, Switzerland) followed by manual dissociation, and filtration to generate a single-cell suspension. For some samples, red blood cell lysis was performed after filtration.
MuSC isolation by FACS
For some scRNA-seq samples (see Figure S2), we enriched the single-cell suspension for Calcein-AM+ propidium iodide− (PI) viable cells using a BD FACS Aria III instrument (BD Biosciences, San Jose, CA). The single-cell suspensions were stained with Calcein-AM (1 μg per 100,000 cells) and PI before sorting. Live cells were sorted selecting for Calcein-AM+ and debris were removed using a standard FSC/SSC gating strategy. For cell culture studies, MuSCs were prospectively isolated from single-cell suspensions following magnetic depletion, as previously described (Cosgrove et al., 2014; Sacco et al., 2008). We isolated MuSCs using a (PI/CD45/CD11b/CD31/Sca1)− CD34+ Integrin-α7+ cell sorting gate. See Key Resources Table for specific antibody clones and fluorophores.
KEY RESOURCES TABLE
| REAGENT or RESOURCE | SOURCE | IDENTIFIER |
|---|---|---|
| Antibodies | ||
| Anti-Mouse CD8a (53–6.7) | Fluidigm | Cat# 3153012B |
| Anti-Mouse CD9 (KMC8) | Fluidigm | Cat# 3158009B |
| Anti-Mouse CD11b (M1/70) | Fluidigm | Cat# 3143015B |
| Anti-Mouse CD3e (145–2C11) | Fluidigm | Cat# 3152004B |
| Anti-Mouse CD4 (RM4–5) | Fluidigm | Cat# 3145002B |
| Anti-Mouse CD45.2 (104) | Fluidigm | Cat# 3147004B |
| Anti-Mouse CD206/MMR (C068C2) | Fluidigm | Cat# 3169021B |
| Anti-Mouse CD80 (16–10A1) | Fluidigm | Cat# 3171008B |
| Anti-Mouse CD31/PECAM-1 (390) | Fluidigm | Cat# 3165013B |
| Anti-Mouse CD140a (APA5) | Fluidigm | Cat# 3148018B |
| Anti-Mouse CD140b (APB5) | Fluidigm | Cat# 3151017B |
| Anti-CyclinB1 (GNS-1) | Fluidigm | Cat# 3164010A |
| Cell-ID IdU | Fluidigm | Cat# 201127 |
| Anti-Mouse CD15 (mc-480) | Lederer Lab, Harvard Medical School | http://ledererlab.bwh.harvard.edu/cytof-core/ |
| Anti-Mouse CD29 (HMB1–1) | Lederer Lab, Harvard Medical School | http://ledererlab.bwh.harvard.edu/cytof-core/ |
| Anti-Mouse CD34 (MEC14.7) | Lederer Lab, Harvard Medical School | http://ledererlab.bwh.harvard.edu/cytof-core/ |
| Anti-Mouse CD106/VCAM-1 (429) | Lederer Lab, Harvard Medical School | http://ledererlab.bwh.harvard.edu/cytof-core/ |
| Anti-Mouse Integrin-α7 | R&D Systems | Cat# MAB3518; RRID: AB_2128441 |
| Anti-Human/Mouse/Rat/Chicken Pax7 | R&D Systems | Cat# MAB1675; RRID: AB_2159833 |
| Anti-Human/Mouse Myogenin | R&D Systems | Cat# MAB6686; RRID: AB_10890775 |
| Anti-Human/Mouse Myosin Heavy Chain Antibody | R&D Systems | Cat# MAB4470; RRID: AB_1293549 |
| Anti-Mouse VE-Cadherin | R&D Systems | Cat# MAB1002; RRID: AB_2077788 |
| Anti-Mouse Laminin-α1 | R&D Systems | Cat# MAB4656; RRID: AB_2265518 |
| Anti-Mouse Sca-1/Ly6 | R&D Systems | Cat# AF1226; RRID: AB_354679 |
| Anti-Mouse C1q R1/CD93 | R&D Systems | Cat# MAB1696; RRID: AB_2076062 |
| Anti-Human/Mouse CX3CR1 | R&D Systems | Cat# AF5825; RRID: AB_2292441 |
| Anti-Mouse Syndecan-1/CD138 | R&D Systems | Cat# MAB2966; RRID: AB_495058 |
| Anti-Mouse Syndecan-2/CD362 | R&D Systems | Cat# AF6585; RRID: AB_10973471 |
| Anti-Human/Mouse MyoD (5.8A) | Novus Biologicals | Cat# NB100–56511; RRID: AB_838603 |
| Anti-Human/Mouse/Rat CD82 | Thermo Fisher Scientific | Cat# PA5–20356; RRID: AB_11155621 |
| Anti-Mouse COL1A1 (3G3) | Santa Cruz Biotechnology | Cat# sc-293182; RRID: AB_2797597 |
| Anti-Mouse Syndecan-3 Antibody (G-2) | Santa Cruz Biotechnology | Cat# sc-398194; RRID: AB_2732022 |
| Anti-Mouse CD138/Sdc1 (281–2) | BD | Cat# 553712; RRID: AB_394998 |
| Anti-Mouse Syndecan-4 (KY/8.2) | BD | Cat# 550350; RRID: AB_393629 |
| Anti-Mouse Scx (N-term) | Abgent | Cat# AW5469-U100 |
| Anti-Mouse Fibromodulin (3E9D10) | Proteintech | Cat# 60108–1-Ig; RRID: AB_2105538 |
| Anti-Mouse CD45 Biotin (30-F11) | Biolegend | Cat# 103104 |
| Anti-Mouse CD31 Biotin (390) | Biolegend | Cat# 102404 |
| Anti-Mouse CD11b Biotin (M1/70) | Biolegend | Cat# 101204 |
| Anti-Mouse Ly-6A/E (Sca-1) Biotin (D7) | Biolegend | Cat# 108104 |
| Anti-Mouse CD34, eFluor 450 (RAM34) | eBioscience | Cat# 48-0341-82; RRID: AB_2043837 |
| Anti-Integrin-α7 AF647 (R2F2) | AbLab | Cat# 67-0010-05 |
| Chemicals, Peptides, and Recombinant Proteins | ||
| Laminin Mouse Protein, Natural | Thermo Fisher Scientific | Cat# 23017015 |
| FGF-Basic (bFGF or FGF2) | Thermo Fisher Scientific | Cat# PHG0264 |
| Fibronectin | Sigma-Aldrich | Cat# FC010 |
| Tenascin C | R&D Systems | Cat# 3358-TC |
| CXCL12/SDF-1 | R&D Systems | Cat# 460-SD |
| CCL5/RANTES | R&D Systems | Cat# 478-MR/CF |
| THBS1 | R&D Systems | Cat# 7859-TH |
| CXCL4/PF4 | R&D Systems | Cat# 595-P4 |
| TGFβ1 | R&D Systems | Cat# 7666-MB/CF |
| MDK | R&D Systems | Cat# 9760-MD |
| RSPO3 | R&D Systems | Cat# 4120-RS/CF |
| Cell-ID Intercalator-Ir | Fluidigm | Cat# 201192A |
| Cell-ID IdU | Fluidigm | Cat# 201127 |
| Cell-ID Cisplatin | Fluidigm | Cat# 201064 |
| Maxpar Cell Staining Buffer | Fluidigm | Cat# 201068 |
| EQ Four Element Calibration Beads | Fluidigm | Cat# 201078 |
| Streptavidin PE-Cy7 | Biolegend | Cat# 405206 |
| Dispase II (neutral protease, grade II) | Sigma-Aldrich | Cat# 04942078001 |
| Collagenase D, from Clostridium histolyticum | Sigma-Aldrich | Cat# 11088866001 |
| D-luciferin salt | Goldbio | Cat# LUCNA1G |
| Critical Commercial Assays | ||
| Chromium Single Cell 3′ Library & Gel Bead Kit Version v2 or v3 | 10X Genomics | CG00052 (protocol) |
| Maxpar X8 Multimetal Labeling Kit | Fluidigm | Cat# 201300 |
| Deposited Data | ||
| Mouse refence genome NCBI build GRCm38 (mm10) | Genome Reference Consortium | https://www.ncbi.nlm.nih.gov/grc/mouse |
| Mouse ligand-receptor database | Skelly et al., 2018 | https://www.ncbi.nlm.nih.gov/pubmed/29346760 |
| scRNA-seq data | This paper | GEO: GSE143435, GSE143437 |
| Experimental Models: Organisms/Strains | ||
| Mouse: C57BL/6J | Jackson Laboratories | Cat# 000664; RRID: IMSR_JAX:000664 |
| Software and Algorithms | ||
| Cytofkit | Chen et al., 2016 | https://github.com/JinmiaoChenLab/cytofkit |
| Cell Ranger 3.0 | 10X Genomics | https://support.10xgenomics.com/single-cell-gene-expression/software/downloads/latest |
| CyTOF Software 6.7 | Fluidigm | https://www.fluidigm.com/software |
| Cytobank | Cytobank, Inc. | https://www.cytobank.org |
| Seurat 2.3.4 | Butler et al., 2018 | https://github.com/satijalab/seurat |
| Monocle 2.8.0 | Qiu et al., 2017 | https://github.com/cole-trapnell-lab/monocle-release |
| Living Image Software - IVIS Lumina Series | PerkinElmer | 128110 |
| ImageJ 1.8.0 | Schneider et al., 2012 | https://imagej.nih.gov/ij/ |
Muscle stem cell culture and ligand stimulation
All culture experiments were performed in 96-well, black-walled, tissue-culture treated plates pre-coated with Laminin, Fibronectin, or Tenascin-C. FACS-isolated MuSCs were seeded at ~300 cells/well in primary myoblast growth medium (GM) with or without recombinant FGF2. The following day and then every three days afterward, GM with or without FGF2 was changed and supplemented with either recombinant paracrine ligand proteins and/or Syndecan neutralizing antibodies. See Key Resources Table for product information and concentrations.
Luminescence imaging analysis
For luminescence imaging, cells were incubated with fresh DMEM (Dulbecco’s modified Eagle’s medium) containing 150 μg/mL D-luciferin (Goldbio #LUCNA1G) for 10 min at 37°C. Following D-luciferin incubation, bioluminescence was measured using the Xenogen IVIS-200 Imaging system (Perkin Elmer, Waltham, MA). Luminescence was quantified in each culture well to determine the relative abundance of Luciferase-expressing muscle cells using the Living Image Software (Perkin Elmer, Waltham, MA) to perform per-well ROI segmentation. After imaging, DMEM/luciferin was replaced with GM containing ligands and/or neutralizing antibodies.
Immunofluorescence imaging and cell counting
Cultured cells were fixed with formaldehyde and permeabilized with Triton X-100 and then were blocked with 15% donkey serum in 0.01% Triton X-100. Cells were stained with anti-Myod1 (Santa Cruz #sc-377460) and then an AlexaFluor488-conjugated secondary antibody (Thermo Fisher #A32766). DAPI was used for nuclear counter-staining. Fluorescence imaging was performed with a Nikon Eclipse-Ti with an 10x/0.25NA objective and SpectraX light engine source (Lumencor, Beaverton, OR). Nuclei were counted using ImageJ for segmentation with application of the BaSiC plug-in for background removal.
Single-cell RNA-sequencing
After digestion, single-cell suspensions were washed and resuspended in 0.04% BSA in PBS at a concentration of at least 400 cells/μL. Cells were counted manually with a hemocytometer to determine their concentration. Single-cell RNA-sequencing libraries were then prepared using the Chromium Single Cell 3′ reagent kit v2 (10X Genomics, Pleasanton, CA) in accordance with the manufacturer’s protocol. Briefly, the cells were diluted into the Chromium Single Cell A Chip as to yield a recovery of ~6,000 single-cell transcriptomes with < 5% doublet rate. Following the library preparation, the libraries were sequenced in multiplex (n = 2 per sequencing run) on the NextSeq 500 sequencer (Illumina, San Diego, CA) to produce between 200 and 250 million reads per library and on average a minimum of 30,000 reads per single cell.
Analysis of scRNA-seq data
Sequencing reads were processed with the Cell Ranger version 3.0.1 (10X Genomics, Pleasanton, CA) using the mouse reference transcriptome mm10. From the gene expression matrix, the downstream analysis was carried out with R version 3.6.2 (2019–12-12). Quality control, filtering, data clustering and visualization, and the differential expression analysis was carried out using Seurat version 2.3.4 R package (Butler et al., 2018) with some custom modifications to the standard pipeline. Each of the 9 datasets were first analyzed independently before combining datasets from the same time point together for an integrated analysis. For each individual dataset, genes expressed in less that 3 cells as well as cells < 1000 UMIs and < 200 genes were removed from the gene expression matrix. In addition, we removed any single-cell with > 20% UMIs mapped to mitochondrial genes, as well as obvious outliers in number of UMIs (cell doublets). After log-normalizing the data, the expression of each gene was scaled regressing out the number of UMI and the percent mitochondrial gene expressed in each cell. We performed PCA on the gene expression matrix and used the first 15 principal components for clustering and visualization. Unsupervised shared nearest neighbor (SNN) clustering was performed with a resolution of 0.4 and visualization was done using uniform manifold approximation and projection (UMAP) (Becht et al., 2018). We performed a silhouette analysis (R cluster package) on each set of samples from the same injury time-point in a pooled manner to select an optimal SNN resolution parameter (0.4), that balanced the number of expected clusters (given known marker expression) with a maximal average silhouette width (Figures S1F and S1G). Finally, differential expression analysis was achieved using Seurat’s “FindAllMarkers” function using a likelihood ratio test that assumes the data follows a negative binomial distribution and only considering genes with > log2(0.25) fold-change and expressed in at least 25% of cells in the cluster.
To analyze datasets from the same time point, we performed canonical correlation analysis (CCA) between datasets followed by data alignment using nonlinear dynamic time warping. We used the CCA matrix instead of PCA for visualization and clustering, and consequently, the differential expression analysis between clustered cells. The CCA space allows us to highlight shared patterns in gene expression profile between datasets. In addition, we did not observe significant differences in results between working in the CCA or PCA space, thus indicating little batch effect between samples from the same time point. We finally combined the 9 datasets into a uniform UMAP atlas using the CCA scores calculated from all the datasets. However, we retain the labels identified independently at each time point and the data was not re-clustered.
Monocle trajectory analysis
We used the Monocle version 2.8.0 R package (Qiu et al., 2017) to organize cells in pseudotime and infer new trajectories of MuSCs subpopulations post-injury. First, we subsetted the cells labeled as MuSCs and progenitor cells and mature skeletal muscle cells from the Seurat dataset and across all time points and samples. Second, we performed unsupervised SNN clustering in order to identify new subpopulations in the data, from which we then used the Seurat “FindAllClusters” function (as described above) to find differentially expressed genes that characterize the subpopulations. We then selected the top 150 genes based on fold-change expression with a minimum of log2(0.8) and adjusted p value of 0.01. This list genes of differentially expressed genes is then used by Monocle for clustering and ordering cells using the DDRTree method and reverse graph embedding. To identify genes that are differentially expressed across Monocle branches (States), we transferred the labels back to the Seurat dataset and performed differential expression analysis as described above.
Ligand-receptor cell communication model
The model aims at scoring potential ligand-receptor interactions between MuSCs (receptor) and other cell types (ligand). We used the ligand-receptor interaction database from Skelly et al. (2018). To calculate the score for a given ligand-receptor pair, we multiply the average receptor expression in MuSCs with the average ligand expression per other cell type (including MuSCs to consider for autocrine interactions). We only considered receptors that are differentially expressed in MuSCs at any given time-point post-injury.
CyTOF sample preparation and staining
Most of the cell surface markers were obtained from Fluidigm and few others were conjugated in-house using the Maxpar X8 Multimetal Labeling Kit (Fluidigm, South San Francisco, CA) (see Table S1 for complete antibody list). The cells were stained with 50 μL of the antibody cocktail (100 μL of total staining volume) for 30 minutes at RT with intermittent vortexing. Following 2 washes (300 g, 5 mins, RT), the cells were fixed with freshly prepared 1.6% PFA for 10 minutes. Thereafter, the cells were incubated for 30 minutes in 1 mL of the Nuclear Antigen Staining Buffer working solution. Then the cells were washed with 2 mL of Nuclear Antigen Staining Perm at 800g, 5 minutes, RT. 50 μL of nuclear antigen antibody cocktail was added to 50 μL of cell pellet solution and incubated for 45 minutes at RT. Following antibody staining, the cells were also stained with Cell-ID Intercalator-Ir-125 μM diluted to 1:1000 with MaxPar Fix and Perm buffer for 1 hour at RT. In addition, cells were also stained with 10 μL of Cisplatin for viability in 1 mL of pre-warmed serum free medium for 5 minutes at RT. Finally, cells were also stained with IdU (5-Iodo-2-deoxyuridine) to label the S-phase at a concentration of 50 μM for 30 minutes at 37°C.
CyTOF data acquisition and analysis
Cells were washed twice with staining buffer and then with MilliQ (MilliporeSigma, Burlington, MA) water. After the final wash, the cells were adjusted to a concentration of 106 cells/mL with 1:10 EQ beads to MilliQ water solution. Prior to the acquisition with the Helios CyTOF (Fluidigm, South San Francisco, CA), the instrument, was tuned and calibrated using the EQ standard beads. The acquisition speed of the sample was maintained within 400 events/seconds to avoid doublets and ion cloud fusion errors in the data. The output FCS files were normalized using the Fluidigm normalizer algorithm that is embedded within the CyTOF software (Version 6.7.1014). The CyTOF data was first gated using the Cytobank software in order to exclude debris, dead cells and doublets (Kotecha et al., 2010). The resulting FCS file was then converted into a gene expression matrix using the Cytofkit R package using an inverse hyperbolic sine transformation (Chen et al., 2016). The gene expression matrix was then analyzed with a Seurat-based custom pipeline, which allowed for SNN clustering and UMAP visualization.
QUANTIFICATION AND STATISTICAL ANALYSIS
Statistical analyses were performed in R version 3.6.2 (2019-12-12) as described in the Method Details section above. Information on dispersion and precision measures, statistical tests and significance values are found within the Figure legends and/or listed within figure panels themselves. Figure S1A contains information about the biological replicates collected into the main scRNA-seq data atlas. For scRNA-seq, biological sample replicates (n) came from separate mice. For cell culture studies (Figure 6), biological replicates came from separate culture wells and the data presented are representative of two independent experiments, with MuSCs sorted from separate mice.
DATA AND CODE AVAILABILITY
Mouse single-cell RNA-sequencing data are available at the GEO repository under accession numbers GEO: GSE143435 (FACS-sorted samples) and GEO: GSE143437 (non-FACS sorted samples). All code used was from prior reports, as listed in the “Software and Algorithms” section of the Key Resources Table.
Supplementary Material
Highlights.
Single-cell RNA-sequencing identifies cell populations involved in muscle regeneration
Muscle stem/progenitor cells form a hierarchy with stage-specific regulatory programs
Bioinformatic analysis identified paracrine factors influencing muscle stem cells
Syndecan-1/2/4 coordinate paracrine ligand-specific muscle progenitor proliferation
ACKNOWLEDGMENTS
This work was financially supported by the National Institutes of Health under awards R00AG042491 (to B.D.C.), R01AG058630 (to B.D.C.), and 1DP2AI138242 (to I.D.); a US Department of Education Graduate Assistantship in Areas of National Need under Award P200A150273 (to A.J.D.); a Glenn Medical Research Foundation and American Federation for Aging Research Grant for Junior Faculty (to B.D.C.); and a Cornell Engineering Learning Initiatives Undergraduate Research Award (to P.F.). The authors acknowledge technical assistance from Hannah Fong of the Cosgrove group and Peter Schweitzer of Genomics Facility at the Cornell University Biotechnology Resource Center. The authors are also thankful for the constructive discussions with members of the Cosgrove, De Vlaminck, and Elemento research groups, as well as Christopher Mendias, Laura Donlin, and their research groups at the Hospital for Special Surgery.
Footnotes
SUPPLEMENTAL INFORMATION
Supplemental Information can be found online at https://doi.org/10.1016/j.celrep.2020.02.067.
DECLARATION OF INTERESTS
The authors declare no conflicts of interest.
SUPPORTING CITATIONS
The following references appear in the Supplemental Information: Chazaud, 2016; Docheva et al., 2005; Farioli-Vecchioli et al., 2009; Gaylinn et al., 1989; Janssen et al., 2000; Liu et al., 2015; Novak and Koh, 2013; Schweitzer et al., 2001; Tidball, 2017; Uezumi et al., 2011; Zordan et al., 2014.
REFERENCES
- Baitsch D, Bock HH, Engel T, Telgmann R, Müller-Tidow C, Varga G, Bot M, Herz J, Robenek H, von Eckardstein A, and Nofer JR (2011). Apolipoprotein E induces antiinflammatory phenotype in macrophages. Arterioscler. Thromb. Vasc. Biol 31, 1160–1168. [DOI] [PMC free article] [PubMed] [Google Scholar]
- Becht E, McInnes L, Healy J, Dutertre CA, Kwok IWH, Ng LG, Ginhoux F, and Newell EW (2018). Dimensionality reduction for visualizing single-cell data using UMAP. Nat. Biotechnol 37, 34–44(2019). [DOI] [PubMed] [Google Scholar]
- Bentzinger CF, Wang YX, von Maltzahn J, Soleimani VD, Yin H, and Rudnicki MA (2013). Fibronectin regulates Wnt7a signaling and satellite cell expansion. Cell Stem Cell 12, 75–87. [DOI] [PMC free article] [PubMed] [Google Scholar]
- Biressi S, and Rando TA (2010). Heterogeneity in the muscle satellite cell population. Semin. Cell Dev. Biol 21, 845–854. [DOI] [PMC free article] [PubMed] [Google Scholar]
- Blau HM, Cosgrove BD, and Ho AT (2015). The central role of muscle stem cells in regenerative failure with aging. Nat. Med 21, 854–862. [DOI] [PMC free article] [PubMed] [Google Scholar]
- Butler A, Hoffman P, Smibert P, Papalexi E, and Satija R (2018). Integrating single-cell transcriptomic data across different conditions, technologies, and species. Nat. Biotechnol 36, 411–420. [DOI] [PMC free article] [PubMed] [Google Scholar]
- Chakkalakal JV, Christensen J, Xiang W, Tierney MT, Boscolo FS, Sacco A, and Brack AS (2014). Early forming label-retaining muscle stem cells require p27kip1 for maintenance of the primitive state. Development 141, 1649–1659. [DOI] [PMC free article] [PubMed] [Google Scholar]
- Chazaud B (2016). Inflammation during skeletal muscle regeneration and tissue remodeling: application to exercise-induced muscle damage management. Immunol. Cell Biol 94, 140–145. [DOI] [PubMed] [Google Scholar]
- Chen H, Lau MC, Wong MT, Newell EW, Poidinger M, and Chen J (2016). Cytofkit: a Bioconductor package for an integrated mass cytometry data analysis pipeline. PLoS Comput. Biol 12, e1005112. [DOI] [PMC free article] [PubMed] [Google Scholar]
- Cho DS, and Doles JD (2017). Single cell transcriptome analysis of muscle satellite cells reveals widespread transcriptional heterogeneity. Gene 636, 54–63. [DOI] [PMC free article] [PubMed] [Google Scholar]
- Christov C, Chrétien F, Abou-Khalil R, Bassez G, Vallet G, Authier FJ, Bassaglia Y, Shinin V, Tajbakhsh S, Chazaud B, and Gherardi RK (2007). Muscle satellite cells and endothelial cells: close neighbors and privileged partners. Mol. Biol. Cell 18, 1397–1409. [DOI] [PMC free article] [PubMed] [Google Scholar]
- Cornelison DD, and Wold BJ (1997). Single-cell analysis of regulatory gene expression in quiescent and activated mouse skeletal muscle satellite cells. Dev. Biol 191, 270–283. [DOI] [PubMed] [Google Scholar]
- Cornelison DD, Wilcox-Adelman SA, Goetinck PF, Rauvala H, Rapraeger AC, and Olwin BB (2004). Essential and separable roles for Syndecan-3 and Syndecan-4 in skeletal muscle development and regeneration. Genes Dev 18, 2231–2236. [DOI] [PMC free article] [PubMed] [Google Scholar]
- Cosgrove BD, Gilbert PM, Porpiglia E, Mourkioti F, Lee SP, Corbel SY, Llewellyn ME, Delp SL, and Blau HM (2014). Rejuvenation of the muscle stem cell population restores strength to injured aged muscles. Nat. Med 20, 255–264. [DOI] [PMC free article] [PubMed] [Google Scholar]
- Dell’Orso S, Juan AH, Ko KD, Naz F, Perovanovic J, Gutierrez-Cruz G, Feng X, and Sartorelli V (2019). Single cell analysis of adult mouse skeletal muscle stem cells in homeostatic and regenerative conditions. Development 146, dev174177. [DOI] [PMC free article] [PubMed] [Google Scholar]
- Docheva D, Hunziker EB, Fässler R, and Brandau O (2005). Tenomodulin is necessary for tenocyte proliferation and tendon maturation. Mol. Cell. Biol 25, 699–705. [DOI] [PMC free article] [PubMed] [Google Scholar]
- Farioli-Vecchioli S, Saraulli D, Costanzi M, Leonardi L, Cinà I, Micheli L, Nutini M, Longone P, Oh SP, Cestari V, and Tirone F (2009). Impaired terminal differentiation of hippocampal granule neurons and defective contextual memory in PC3/Tis21 knockout mice. PLoS ONE 4, e8339. [DOI] [PMC free article] [PubMed] [Google Scholar]
- Gaylinn BD, Eddinger TJ, Martino PA, Monical PL, Hunt DF, and Murphy RA (1989). Expression of nonmuscle myosin heavy and light chains in smooth muscle. Am. J. Physiol 257, C997–C1004. [DOI] [PubMed] [Google Scholar]
- Giordani L, He GJ, Negroni E, Sakai H, Law JYC, Siu MM, Wan R, Corneau A, Tajbakhsh S, Cheung TH, and Le Grand F (2019). High-dimensional single-cell cartography reveals novel skeletal muscle-resident cell populations. Mol. Cell 74, 609–621 e6. [DOI] [PubMed] [Google Scholar]
- Heredia JE, Mukundan L, Chen FM, Mueller AA, Deo RC, Locksley RM, Rando TA, and Chawla A (2013). Type 2 innate signals stimulate fibro/adipogenic progenitors to facilitate muscle regeneration. Cell 153, 376–388. [DOI] [PMC free article] [PubMed] [Google Scholar]
- Ho MM, Manughian-Peter A, Spivia WR, Taylor A, and Fraser DA (2016). Macrophage molecular signaling and inflammatory responses during ingestion of atherogenic lipoproteins are modulated by complement protein C1q. Atherosclerosis 253, 38–46. [DOI] [PMC free article] [PubMed] [Google Scholar]
- Hwang B, Lee JH, and Bang D (2018). Single-cell RNA sequencing technologies and bioinformatics pipelines. Exp. Mol. Med 50, 96. [DOI] [PMC free article] [PubMed] [Google Scholar]
- Janssen E, Dzeja PP, Oerlemans F, Simonetti AW, Heerschap A, de Haan A, Rush PS, Terjung RR, Wieringa B, and Terzic A (2000). Adeny-late kinase 1 gene deletion disrupts muscle energetic economy despite metabolic rearrangement. EMBO J 19, 6371–6381. [DOI] [PMC free article] [PubMed] [Google Scholar]
- Joe AW, Yi L, Natarajan A, Le Grand F, So L, Wang J, Rudnicki MA, and Rossi FM (2010). Muscle injury activates resident fibro/adipogenic progenitors that facilitate myogenesis. Nat. Cell Biol 12, 153–163. [DOI] [PMC free article] [PubMed] [Google Scholar]
- Kotecha N, Krutzik PO, and Irish JM (2010). Web-based analysis and publication of flow cytometry experiments. Curr. Protoc. Cytom Chapter 10, Unit10 17. [DOI] [PMC free article] [PubMed] [Google Scholar]
- Kuang S, Kuroda K, Le Grand F, and Rudnicki MA (2007). Asymmetric self-renewal and commitment of satellite stem cells in muscle. Cell 129, 999–1010. [DOI] [PMC free article] [PubMed] [Google Scholar]
- Kumar D, Shadrach JL, Wagers AJ, and Lassar AB (2009). Id3 is a direct transcriptional target of Pax7 in quiescent satellite cells. Mol. Biol. Cell 20, 3170–3177. [DOI] [PMC free article] [PubMed] [Google Scholar]
- Kuschel R, Deininger MH, Meyermann R, Bornemann A, Yablonka-Reuveni Z, and Schluesener HJ (2000). Allograft inflammatory factor-1 is expressed by macrophages in injured skeletal muscle and abrogates proliferation and differentiation of satellite cells. J. Neuropathol. Exp. Neurol 59, 323–332. [DOI] [PubMed] [Google Scholar]
- Liu Z, Jin YQ, Chen L, Wang Y, Yang X, Cheng J, Wu W, Qi Z, and Shen Z (2015). Specific marker expression and cell state of Schwann cells during culture in vitro. PLoS ONE 10, e0123278. [DOI] [PMC free article] [PubMed] [Google Scholar]
- Lukjanenko L, Jung MJ, Hegde N, Perruisseau-Carrier C, Migliavacca E, Rozo M, Karaz S, Jacot G, Schmidt M, Li L, et al. (2016). Loss of fibronectin from the aged stem cell niche affects the regenerative capacity of skeletal muscle in mice. Nat. Med 22, 897–905. [DOI] [PMC free article] [PubMed] [Google Scholar]
- Lyons GE, Ontell M, Cox R, Sassoon D, and Buckingham M (1990). The expression of myosin genes in developing skeletal muscle in the mouse embryo. J. Cell Biol 111, 1465–1476. [DOI] [PMC free article] [PubMed] [Google Scholar]
- Machado L, Esteves de Lima J, Fabre O, Proux C, Legendre R, Szegedi A, Varet H, Ingerslev LR, Barrès R, Relaix F, and Mourikis P (2017). In situ fixation redefines quiescence and early activation of skeletal muscle stem cells. Cell Rep 21, 1982–1993. [DOI] [PubMed] [Google Scholar]
- Motohashi N, and Asakura A (2014). Muscle satellite cell heterogeneity and self-renewal. Front. Cell Dev. Biol 2, 1. [DOI] [PMC free article] [PubMed] [Google Scholar]
- Novak ML, and Koh TJ (2013). Macrophage phenotypes during tissue repair. J. Leukoc. Biol 93, 875–881. [DOI] [PMC free article] [PubMed] [Google Scholar]
- Ohkawara B, Glinka A, and Niehrs C (2011). Rspo3 binds Syndecan 4 and induces Wnt/PCP signaling via clathrin-mediated endocytosis to promote morphogenesis. Dev. Cell 20, 303–314. [DOI] [PubMed] [Google Scholar]
- Pawlikowski B, Vogler TO, Gadek K, and Olwin BB (2017). Regulation of skeletal muscle stem cells by fibroblast growth factors. Dev. Dyn 246, 359–367. [DOI] [PubMed] [Google Scholar]
- Pisconti A, Cornelison DD, Olguín HC, Antwine TL, and Olwin BB (2010). Syndecan-3 and Notch cooperate in regulating adult myogenesis. J. Cell Biol 190, 427–441. [DOI] [PMC free article] [PubMed] [Google Scholar]
- Pisconti A, Bernet JD, and Olwin BB (2012). Syndecans in skeletal muscle development, regeneration and homeostasis. Muscles Ligaments Tendons J 2, 1–9. [PMC free article] [PubMed] [Google Scholar]
- Pisconti A, Banks GB, Babaeijandaghi F, Betta ND, Rossi FM, Chamberlain JS, and Olwin BB (2016). Loss of niche-satellite cell interactions in syndecan-3 null mice alters muscle progenitor cell homeostasis improving muscle regeneration. Skelet. Muscle 6, 34. [DOI] [PMC free article] [PubMed] [Google Scholar]
- Porpiglia E, Samusik N, Ho ATV, Cosgrove BD, Mai T, Davis KL, Jager A, Nolan GP, Bendall SC, Fantl WJ, and Blau HM (2017). High-resolution myogenic lineage mapping by single-cell mass cytometry. Nat. Cell Biol 19, 558–567. [DOI] [PMC free article] [PubMed] [Google Scholar]
- Qiu X, Mao Q, Tang Y, Wang L, Chawla R, Pliner HA, and Trapnell C (2017). Reversed graph embedding resolves complex single-cell trajectories. Nat. Methods 14, 979–982. [DOI] [PMC free article] [PubMed] [Google Scholar]
- Ren H, Yin P, and Duan C (2008). IGFBP-5 regulates muscle cell differentiation by binding to IGF-II and switching on the IGF-II auto-regulation loop. J. Cell Biol 182, 979–991. [DOI] [PMC free article] [PubMed] [Google Scholar]
- Rocheteau P, Gayraud-Morel B, Siegl-Cachedenier I, Blasco MA, and Tajbakhsh S (2012). A subpopulation of adult skeletal muscle stem cells retains all template DNA strands after cell division. Cell 148, 112–125. [DOI] [PubMed] [Google Scholar]
- Sacco A, Doyonnas R, Kraft P, Vitorovic S, and Blau HM (2008). Self-renewal and expansion of single transplanted muscle stem cells. Nature 456, 502–506. [DOI] [PMC free article] [PubMed] [Google Scholar]
- Schneider CA, Rasband WS, and Eliceiri KW (2012). NIH Image to ImageJ: 25 years of image analysis. Nature Methods 9, 671–675. [DOI] [PMC free article] [PubMed] [Google Scholar]
- Schweitzer R, Chyung JH, Murtaugh LC, Brent AE, Rosen V, Olson EN, Lassar A, and Tabin CJ (2001). Analysis of the tendon cell fate using Scleraxis, a specific marker for tendons and ligaments. Development 128, 3855–3866. [DOI] [PubMed] [Google Scholar]
- Skelly DA, Squiers GT, McLellan MA, Bolisetty MT, Robson P, Rosenthal NA, and Pinto AR (2018). Single-cell transcriptional profiling reveals cellular diversity and intercommunication in the mouse heart. Cell Rep 22, 600–610. [DOI] [PubMed] [Google Scholar]
- Sousa-Victor P, Gutarra S, García-Prat L, Rodriguez-Ubreva J, Ortet L, Ruiz-Bonilla V, Jardí M, Ballestar E, González S, Serrano AL, et al. (2014). Geriatric muscle stem cells switch reversible quiescence into senescence. Nature 506, 316–321. [DOI] [PubMed] [Google Scholar]
- Stuart T, and Satija R (2019). Integrative single-cell analysis. Nat. Rev. Genet 20, 257–272. [DOI] [PubMed] [Google Scholar]
- Tan G-K, Pryce BA, Stabio A, Brigande JV, Wang C, Xia Z, Tufa SF, Keene DR, and Schweitzer R (2020). Tgfβ signaling is critical for maintenance of the tendon cell fate. Life 9, e52695. [DOI] [PMC free article] [PubMed] [Google Scholar]
- Tidball JG (2017). Regulation of muscle growth and regeneration by the immune system. Nat. Rev. Immunol 17, 165–178. [DOI] [PMC free article] [PubMed] [Google Scholar]
- Tierney MT, and Sacco A (2016). Satellite cell heterogeneity in skeletal muscle homeostasis. Trends Cell Biol 26, 434–444. [DOI] [PMC free article] [PubMed] [Google Scholar]
- Tierney MT, Stec MJ, Rulands S, Simons BD, and Sacco A (2018). Muscle stem cells exhibit distinct clonal dynamics in response to tissue repair and homeostatic aging. Cell Stem Cell 22, 119–127.e3. [DOI] [PMC free article] [PubMed] [Google Scholar]
- Uezumi A, Ito T, Morikawa D, Shimizu N, Yoneda T, Segawa M, Yamaguchi M, Ogawa R, Matev MM, Miyagoe-Suzuki Y, et al. (2011). Fibrosis and adipogenesis originate from a common mesenchymal progenitor in skeletal muscle. J. Cell Sci 124, 3654–3664. [DOI] [PubMed] [Google Scholar]
- van Velthoven CTJ, de Morree A, Egner IM, Brett JO, and Rando TA (2017). Transcriptional profiling of quiescent muscle stem cells in vivo. Cell Rep 21, 1994–2004. [DOI] [PMC free article] [PubMed] [Google Scholar]
- Wagner A, Regev A, and Yosef N (2016). Revealing the vectors of cellular identity with single-cell genomics. Nat. Biotechnol 34, 1145–1160. [DOI] [PMC free article] [PubMed] [Google Scholar]
- Wang YX, and Rudnicki MA (2011). Satellite cells, the engines of muscle repair. Nat. Rev. Mol. Cell Biol 13, 127–133. [DOI] [PubMed] [Google Scholar]
- Wosczyna MN, and Rando TA (2018). A muscle stem cell support group: coordinated cellular responses in muscle regeneration. Dev. Cell 46, 135–143. [DOI] [PMC free article] [PubMed] [Google Scholar]
- Yin H, Price F, and Rudnicki MA (2013). Satellite cells and the muscle stem cell niche. Physiol. Rev 93, 23–67. [DOI] [PMC free article] [PubMed] [Google Scholar]
- Yuniati L, Scheijen B, van der Meer LT, and van Leeuwen FN (2019). Tumor suppressors BTG1 and BTG2: beyond growth control. J. Cell. Physiol 234, 5379–5389. [DOI] [PMC free article] [PubMed] [Google Scholar]
- Zordan P, Rigamonti E, Freudenberg K, Conti V, Azzoni E, Rovere-Querini P, and Brunelli S (2014). Macrophages commit postnatal endothelium-derived progenitors to angiogenesis and restrict endothelial to mesenchymal transition during muscle regeneration. Cell Death Dis 5, e1031. [DOI] [PMC free article] [PubMed] [Google Scholar]
Associated Data
This section collects any data citations, data availability statements, or supplementary materials included in this article.
Supplementary Materials
Data Availability Statement
Mouse single-cell RNA-sequencing data are available at the GEO repository under accession numbers GEO: GSE143435 (FACS-sorted samples) and GEO: GSE143437 (non-FACS sorted samples). All code used was from prior reports, as listed in the “Software and Algorithms” section of the Key Resources Table.