

Abstract
The second open reading frame of avian reovirus S1 gene segment encodes a 17 kDa non-structural protein, named p17. The biological role of p17 is fully unknown so far. Using trypan blue dye exclusion and MTT assay, we demonstrated that the ectopic expression of p17 results in the reduction of viable cell number and cell proliferation rate of Vero, BHK, 293, and HeLa cells. Measurement of LDH activity and DNA fragmentation analysis revealed that p17 expression did not cause cell death or apoptosis. These data indicated that the p17 possessed the growth retardation function. Semi-quantitative RT-PCR and Western blotting revealed that p17-expressing cells induced the expression of CDK inhibitor p21cip1/waf1 in a time- and dose-dependent manner, but the transcripts of CDK inhibitor p15INK4b, p16INK4a, or p27kip were not altered. In the presence of p17, the p53 protein level and p53-driven reporter activity were elevated significantly. Dominant negative p53 alleviated the p21 accumulation, p53 activation, and growth inhibition effect induced by p17. Taken together, these studies revealed a possible intrinsic function of p17 in growth regulation through the activation of p53 and p21cip1/waf1.
Keywords: Avian reovirus, p17, MTT, p53, p21cip1/waf1
Avian reoviruses (ARVs) are ubiquitous among poultry flocks. The infection may be involved in several disease syndromes of which viral arthritis/tenosynovitis in chickens is the most important, particularly in broiler breeds [12]. ARV are members of the Orthoreovirus genus, one of nine genera of the Reoviridae family. They are non-enveloped viruses that replicate in the cytoplasm of infected cells and contain 10 double-stranded RNA genome segments [18]. All ARV encoded proteins, including 10 structural proteins and four non-structural proteins, have been demonstrated [1], although very little is known about the functions of most of these proteins. The genome S1 contains three open reading frames which translated membrane fusion protein p10, p17, and cell attachment protein σC [1]. The p17 is a 146 amino acid protein, which has no known biological function and no sequence similarity to other known proteins. Analyzing the amino acid sequence of p17 revealed no functional domain or motif existed. Recent report demonstrated that p17 accumulates in the nucleoplasm of infected and transfected cells. An interspecies heterokaryon assay further showed that p17 shuttles continuously between the nucleus and the cytoplasm. These investigators suggested that p17 may participate in cellular nuclear processes such as gene transcription, DNA binding [8].
Cell cycle progression is governed by a series of cyclin-dependent kinases (CDKs) whose function is dependent on their phosphorylation status and association with specific cyclins [17], [21]. The cell cycle progression was negatively regulated by tumor suppressor gene, p53, Rb (retinoblastoma) and cdk inhibitors (CDKIs). The kip/cip members of CDKIs, which include p21cip1/waf1, p27kip, and p57kip2, are capable of binding and inhibiting most cyclin/cdk complexes. In contrast, the INK4 family, which includes p15INK4b, p16INK4a, p18INK4c, and p19INK4d, binds and inactivates D-type cyclins [17]. In addition, studies of p15INK4b and p16INK4a have shown they can function as tumor suppressors [3].
The p53 tumor suppressor gene product is composed of 393 amino acids and it structure resembles a transcriptional activator factor. The p53 protein is a key cellular regulator, which mediates several functions such as the cell cycle arrest, apoptosis, DNA repair or senescence [2]. Furthermore, it has been reported that the induction of p53 expression by viral protein correlates with a reduction of cell proliferation. In the case of Epstein–Barr virus, its nuclear antigen 2 inhibits cell growth by modulating p53 activity [14]. In addition, murine coronavirus non-structural p28 inhibited cell growth in several cell lines that correlated with p53 accumulation [6]. p21cip1/waf1 is a key downstream mediator of the growth arrest induced by p53 [9]. p53 can stimulate transcription of the p21cip1/waf1 gene by binding the two p53-response elements located within the p21cip1/waf1 promoter [9]. Besides the inhibition of cyclin–CDK complexes, p21cip1/waf1 has been shown to bind and inhibit proliferating cell nuclear antigen, which is involved in DNA replication and repair [10], [13]. The dual function of p21cip1/waf1 can ensure an efficient block of cell cycle progression [22]. p27kip, p15INK4b, and p16INK4a have all contributed to the formation of hypo-phosphorylation of Rb [7].
To investigate the possible biological role of p17, we ectopically expressed p17 in Vero, BHK, 293, and HeLa cells, and examined the growth properties and related gene expression of these cells. Our data clearly indicated that p17 expression could retard the growth of cells, a dramatic effect was observed when cells were cultured in lower serum condition. p17 can induce the expression of p21cip1/waf1. The stimulation of p21cip1/waf1 transcription was mediated through induction and activation of p53.
Materials and methods
Plasmids and antibodies. To construct the p17 gene of ARV S1133 strain, purified double-stranded RNA genome was used as template to generate cDNA by reverse transcription (RT) and polymerase chain reaction (PCR). The forward and reverse PCR primer sequences used were as follows: 5′-CGTTGGATCCTGGTAAGCACAATGCAATGGCTC CG-3′, 5′-CTTCAAGCTTGGTCAGCCGTTCATAGATCG-3′. The underlined sequence indicates BamHI and HindIII cleavage sites, respectively. In the RT-PCR test, 1 μg of purified dsRNA was denatured in boiling water for 10 min, chilled on ice for 5 min, and then used as a template. RT-PCRs were performed according to procedures provided by Perkin Elmer (Branchburg, NJ, USA). Reverse transcription was carried out at 50 °C for 60 min. PCRs were subjected to 35 cycles consisting of denaturation for 1 min at 94 °C, annealing for 1 min at 55 °C, and extension for 90 s at 72 °C, and one final extension cycle at 72 °C for 7 min. The PCR products were purified, digested with BamHI and HindIII, and then ligated into the corresponding site of pcDNA 3.1(−) mammalian expression vector (Invitrogene, Carlsbad, CA, USA).
The p53 dominant negative mutant expression plasmid was purchased from (Clontech, Palo Alto, CA). p53-luciferase reporter plasmid was purchased from Stratagene (La Jolla, CA). p53 and p21cip1/waf1 mouse monoclonal antibodies were purchased from Upstate Biotechnology (Lake Placid, NY). The actin mouse monoclonal antibody was purchased from Oncogene (Darmstadt, Germany). Anti-rabbit conjugated with FITC antibody was purchased from Stressgen (Victoria, Canada). Rabbit polyclonal antibody against p17 was produced by Genesis Biotech in Taiwan.
Cell culture and transfection. Vero, BHK, 293, and HeLa cells were cultured in minimum essential medium supplemented with Earle’s salt and 10% fetal bovine serum at 37 °C in a 5% CO2 incubator. Cells at 70% confluence were transfected with plasmids using SuperFect transfection reagents (Qiagen, Valencia, CA) according to the manufacturer’s instructions. Following incubation for the indicated time period, cells were harvested for further analysis.
Immunofluorescence staining. 2 × 10³ monolayer cells were grown on coverslips and were transfected with p17 expression plasmid or control vector. For a 48 h incubation, the monolayers were washed twice with PBS and fixed in methanol at −20 °C for 30 min. Then blocking was carried out in 10% FBS in PBS solution at room temperature for 1 h. After washing three times, p17 rabbit polyclonal antibody was diluted 200× in blocking buffer and incubated at room temperature for 1 h. After washing for three more times, the cells were incubated with anti-rabbit-FITC antibody in blocking buffer with 500× dilution. The indication of nucleus localization was according to the propidium iodide (PI) counter staining protocol (Molecular Probe, Carlsbad, CA, USA). FITC was detected by using the 488 nm excitation line and analyzing the emission between 500 and 535 nm. The absorption maximum for PI is 535 nm and the fluorescence emission maximum is 617 nm.
Trypan blue dye staining. 2 × 10⁵ cells were seeded onto a 35 mm tissue culture plate. After transfection with indicated plasmid, cells were washed and additionally incubated for various time periods. Cells were collected by trypsinization and suspended in cultured medium. Viable and non-viable cells were then determined by direct counting using a hemocytometer in the presence of 0.5% trypan blue. The doubling time was calculated by the following formula: T (double time) = time duration × log 2/log (newly harvested cells) − log (number of cells originally plated) [29].
MTT assay. MTT assay was performed with modification of methods described by Carmichael et al. [4]. Cells were plated in 48-well plates at a concentration of 5 × 10³. Transfection was described above. Following incubation with various time periods, and tetrazolium-based compound (MTT) was added into individual wells at a final concentration of 125 μg/ml. Plates were incubated at 37 °C for 4 h. Following incubation, the media were removed completely, 100 μl DMSO was added to dissolve the formazan dye. The purple formazan solution was transferred to 96-well plates and immediately read at 540 nm with a spectrophotometer (Biotek Instruments, Burlington, VT, USA). ID50 was defined as 50% reduction of 540 nm absorbance.
LDH assay. 5 × 10³ cells per well on a 96-well plate were cultured overnight. Transfection with 0.2 μg pcDNA3.1(−) or p17-pcDNA3.1(−) expression plasmid per well. Following incubation for the indicated time periods, cells were harvested for LDH analysis and cytotoxicity was determined according to the manufacturer’s instructions. The kit was purchased from Roche (Nutley, NJ). Briefly, 100 μl test sample mix with 100 μl reaction mixture was incubated for 20 min at 25 °C under light protection. The LDH activity detected in the cultured supernatant cells correlated to the proportion of lysed cells. The absorbance was measured at 490 nm.
DNA fragmentation analysis. Cells transfected with indicated plasmid or infected with ARV S1133 strain were collected, washed with PBS, and lysed with lysis buffer (50 mM Tris–HCl, pH 7.5, 20 mM EDTA, and 1% Nonidet P-40). The supernatant was collected and incubated with RNaseA at a final concentration of 500 μg/ml for 1 h at 37 °C. Subsequently, proteinase K was added to a final concentration of 500 μg/ml. The mixtures were then incubated overnight at 55 °C. The DNA was extracted with phenol/chloroform, precipitated with ethanol, dissolved in TE8.0, and subjected to 1.7% agarose gel electrophoresis.
Semi-quantitative RT-PCR. Total cellular RNA was extracted from cell lines using TRIzol reagent (InVitrogen, Carlsbad, CA) according to the manufacturer’s instructions. Total RNA was reacted with RNase-free DNase (Promega, Madison, WI) to remove genomic DNA. cDNA was synthesized using 5 μg of total RNA as the template and oligo(dT)20 as primers as described in the manufacturer’s protocol of AMV reverse transcriptase (Promega). The cDNA mixtures were subjected to PCR using Taq polymerase (Promega) and oligonucleotide primer pairs specific to the cDNA for p27kip, p15INK4b, p21cip1/waf1, and p16INK4a and actin [19]. So that amount of specific PCR product semi-quantitatively reflected the level of mRNA. The number of PCR cycles was restricted to 28–30, representing the late exponential range for PCR product [27]. The PCR products were analyzed by agarose gel electrophoresis.
Western blot analysis. Cells were lysed with a lysis buffer containing 50 mM Tris, pH 7.4, 150 mM NaCl, 5 mM EDTA, 1% Nonidet P-40, and 2 mM phenylmethylsulfonyl fluoride. Thirty micrograms of total protein from the supernatant was subjected to 10% SDS–PAGE and blotted onto polyvinylidene fluoride membrane. The blots were blocked with 5% non-fat dried milk in Tris-buffered saline and incubated (4 °C overnight shaking) with first antibody. The dilution fold was according to the manufacturer’s instruction. The blots were then incubated with HRP-conjugated secondary antibody (1:2000) at room temperature for 2 h. The labeled bands were detected by chemiluminescence using ECL Western blotting detection reagents and exposure to X-ray film.
Luciferase assay. p53-luc, contained a p53 response element, located upstream of the firefly luciferase reporter gene (Stratagene). pcDNA3.1(−) or p17-pcDNA3.1(−) with p53-luc and pRKbetaGAL were transfected into the designated cells. Forty-eight hours after transfection, cells were harvested. Luciferase and β-galactosidase activities were quantified by the Luciferase Assay System and the β-galactosidase Enzyme Assay System (Promega), respectively. The luciferase activity was normalized to β-galactosidase activity to account for the transfection efficiency.
Results
Detection of the p17 expression
Transfection efficiency in Vero, BHK, 293, and HeLa cells was monitored following the introduction of pEGFP-N3 plasmid, which constitutively expresses green fluorescence protein (GFP). Approximately 60–80% of these two cells observed by fluorescence microscope displayed the GFP signal (data not shown). Having confirmed the routinely high transfection efficiency of utilizing system, 5 μg p17-pcDNA3.1(−) expression plasmid or the control vector pcDNA3.1(−) was transfected into Vero cells. The p17 transcripts are indicated in Fig. 1 A, upper panel. The expression level of p17 was gradually increased in a time-dependent manner. The internal control actin transcripts are shown in Fig. 1A, lower panel. To detect the protein expression within transfected cells, immunofluorescence staining was performed using rabbit polyclonal antibody against p17. The same slide was stained with PI to indicate nucleus localization (lower). Fig. 1B shows that p17 was concentrated within the nucleus, the more accumulated signal appearing within the nuclear structure resembling the nucleolus (middle); this result was consistent with a recent report that p17 was a nuclear protein [6]. No signal of vector transfected cells was detected in this study (data not shown).
Fig. 1.
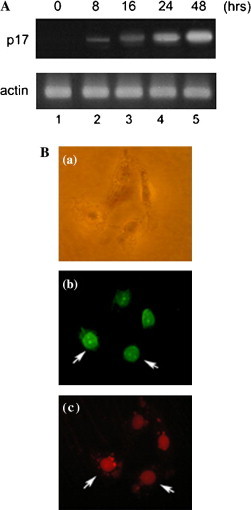
Detection of ARV p17 expression. (A) RT-PCR analysis with p17 (upper panel) or actin (lower panel) specific primers are displayed. Five micrograms of p17-pcDNA3.1(−) was transfected into Vero cells. After incubation of various time periods, total RNA was harvested. The p17 and actin transcripts are indicated. (B) p17 expression within the nucleus. Vero cells transfected with p17-pcDNA3.1(−). After incubation for 48 h, immunofluorescence staining was performed by using rabbit polyclonal antibody against p17 and anti-rabbit-FITC. Addition of 0.3 μg/ml PI as counterstaining to indicate nucleus localization. Phase contrast image shows the morphology of cells (a). Arrows indicate cells expressing p17 (b). Flowing PI staining, arrows indicate nucleus localization (c). The three images were same field. The magnification was 400×.
Expression of p17 results in growth retardation
Trypan blue dye staining and MTT assay were utilized to investigate the effect of p17 on cell growth. Equal amounts of control vector pcDNA3.1(−) or p17-pcDNA3.1(−) were transfected into Vero, BHK, 293, and HeLa cells. These cells were then cultured in MEM containing various concentrations of fetal bovine serum at indicated time period. Next, we compared the viable cell number and cell proliferation rate of p17-expressing cells with those of vector transfected cells. Trypan blue day exclusion assay revealed that the viable cell number was reduced in p17-expressing cells as compared with vector transfected cells. The significant difference was observed at 24 and 48 h incubation. The interesting aspect is that the p17-mediated effect was more clear when cells were cultured in lower serum (1% and 0.1%) condition (Fig. 2 A). The doubling time of each experiment was calculated and is shown (Fig. 2A). The p17 expression increased the doubling time significantly as compared with vector transfected cells. By using an alternative MTT assay to evaluate the cell proliferation rate, the same growth inhibition pattern of p17 was observed (Fig. 2B, upper). To further confirm that this growth inhibition activity of p17 was specific, we transfected sigma C-pcDNA3.1(−) plasmid into cells. The sigma C expression was demonstrated in our previous study [23]. The presence of sigma C did not alter the cell proliferation rate (Fig. 2B, lower). The p17 inhibits cell growth activity that was not dependent on host cell type, since this protein also exhibited a growth retardation activity in BHK, 293, and HeLa cells (data not shown).
Fig. 2.
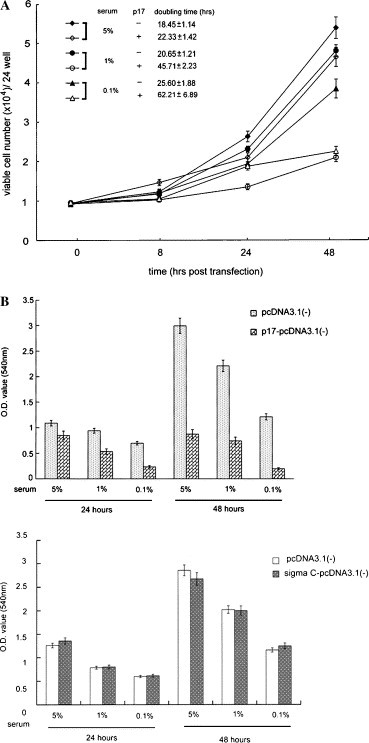
Retardation of cell growth by ARV p17. (A) The growth curve and doubling time of Vero cells transfected with vector pcDNA3.1(−) or with p17-pcDNA3.1(−). The data represent the average of triplicate plates with standard deviation. The cultured condition was shown. The x-axis represents the time period incubation post-transfection. The viable cells were counted with a hemocytometer in the presence of trypan blue and are represented in the y-axis. (B) p17 expression retards cell proliferation by using the MTT assay. Vero cells transfected with pcDNA3.1(−) or p17-pcDNA3.1(−) or sigma C-pcDNA3.1(−). The x-axis indicates cultured time period and condition. The y-axis represents the row OD value. For a 24 and 48 h observation, p17-expressing cells reduced the cell proliferation. More remarkable effect was observed when cells were cultured in lower serum medium (upper). Cell growth rate of cells transfected with control vector or sigma C-pcDNA3.1(−) was comparable (lower).
Neither the cell death nor apoptosis was induced by p17
To realize whether the reduced viable cell number in p17-expressing cells may be due to induction of cell death or apoptosis. The cell death was evaluated by the quantification of plasma membrane damage by measuring the release of the cytoplasmic enzyme activity, lactate dehydrogenase (LDH). The principle of LDH activity determination was a two-step reaction. In the first step, NAD+ is reduced to NADH/H+ by the LDH-catalyzed conversion of lactate to pyruvate. In the second step, the catalyst (diaphorase) transfer H/H+ from NADH/H+ to the tetrazolium salt INT (2-[4-iodophenyl]-3-[4-nitrophenyl]-5-phenyltetrazolium chloride) which is reduced to formazan. The increase of LDH activity in the cell culture supernatant directly correlates to the amount of formazan formed during a limited time period [26]. As shown in Fig. 3 A, for a 24 and 48 h observation, Vero cells without or with various amounts of p17 expression, under 5% serum or 0.1% serum cultured condition, illustrated a comparable LDH activity level. Cells were treated with 2% Triton X-100 as a high control, which provides information about the maximum releasable LDH activity in the cells. Apoptosis is an alternative cell death way without plasma membrane lysis. The DNA fragmentation was a hallmark feature of apoptosis. Vero cells infected with ARV S1133 strains or ectopically expressed ARV sigma C leaded cells undergoing apoptosis [23]. This result indicated that the p17 expression did not cause the DNA ladder phenomena (Fig. 3B, lanes 4 and 5). Apoptosis was also monitored by PI followed by flow cytometric analysis, and no signs of apoptosis were revealed in p17-expressing cells or control cells (data not shown). These experiments were performed in BHK, 293, and HeLa cells, and the same results were obtained (data not shown).
Fig. 3.
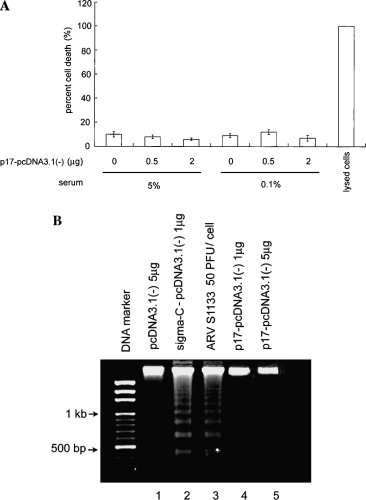
p17 expression did not cause cell death or apoptosis. (A) Vero cells transfected with various amounts of p17-pcDNA3.1(−) and cultured in 5% serum or 0.1% serum for 48 h. Cell death was quantified by LDH release into the medium, which was performed in duplicate on treated plates. Three independent experiments were conducted to calculate cell death and standard deviation. Cells lysed in 2% Triton X-100 represent the normalized release of maximal LDH. (B) DNA fragmentation analysis revealed that 17 expression did not cause DNA laddering. Ectopic expression of ARV apoptosis-inducing protein sigma C and infection with ARV S1133 infection was included here as positive control.
Induction of p21cip1/waf1 expression by p17
To study the mechanism underlying cell growth retardation induced by p17, we tested whether CDK inhibitors, which are important cell cycle checkers, played roles in this process. Increasing expression levels of p17 were monitored by RT-PCR (Fig. 1A, upper). Four CDK inhibitors p15INK4b, p16INK4a, p21cip1/waf1, and p27kip transcripts were measured by semi-quantitative RT-PCR (Fig. 4 A). The expression of CDK inhibitors was quantified relative to the expression of the housekeeping gene, actin (Fig. 4A). While the p15INK4b, p16INK4a, and p27kip mRNAs were synthesized at similar levels in vector transfected (data not shown) or p17-pcDNA3.1(−) transfected Vero cells. The level of p21cip1/waf1 mRNA was revealed as a dose- and time-dependent elevation, which is consistent with the increasing amounts of p17 (Fig. 1, Fig. 4A). When ARV sigma C was ectopically expressed, the p21cip1/waf1 mRNA was not altered (data not shown). The same outcome was obtained when these experiments were performed in BHK, 293, and HeLa cells (data not shown). Western blot analysis also demonstrated that p17 expressing cells synthesized a greater amount of p21cip1/waf1 than vector transfected cells (Fig. 4B). The induction pattern of p21cip1/waf1 mRNA and p21cip1/waf1 protein was consistent.
Fig. 4.
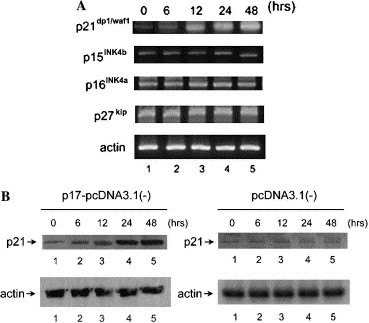
Induction of p21cip1/waf1 by p17. Vero cells transfected with pcDNA3.1(−) or p17-pcDNA3.1(−). Incubation for various time periods as indicated. RNA or total protein was harvested. (A) Semi-quantitative RT-PCR using specific primer pairs to measure the transcripts of CDK inhibitors. Only the p21cip1/waf1 transcript was increased in a time-dependent manner. (B) p21cip1/waf1 protein level was elevated in response to p17 expression but not in control cells.
Activation of p53-dependent pathway by p17
Knowing that p17 could induce p21cip1/waf1 expression, we next asked whether p53 could mediate this effect, since p53 has been shown to mediate p21cip1/waf1 transcription [9]. Western blot analysis revealed that the amount of endogenous p53 was accumulated in a time- and dose-dependent manner in Vero cells expressing p17 (Fig. 5 A) but not in vector transfected cells (data not shown). Furthermore, it is well known that an activated p53 formed tetramer and exerted a specific DNA binding ability to activate downstream genes. We thus analyzed the luciferase reporter activity, which was controlled by a synthetic promoter containing direct repeats of the transcription recognition sequence for p53, in cells with or without p17 expression. Vero cells were transfected with various amounts of p17 expression plasmids together with p53-luciferase reporter DNA. The luciferase activity was expressed as activation folds. Our results clearly revealed that the p53 specific-DNA binding capacity was increased in the presence of p17 in a dose-dependent pattern (Fig. 5B). The timing of the induction of p53 and p21cip1/waf1 is almost consistent, suggesting that the induction of transcriptionally active p53, in response to p17, activates the expression level of p21cip1/waf1.
Fig. 5.
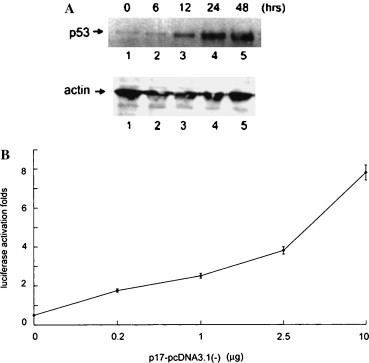
Activation of p53-dependent pathway in a time- and dose-dependent manner by p17. (A) Western blot analysis using anti-p53 (upper panel) or anti-actin (lower panel) antibody of Vero cells transfected with p17-pcDNA3.1(−). (B) Cells cotransfected with 1 μg p53-luc reporter plasmids and various amounts of p17-pcDNA3.1(−). After 48 h incubation, luciferase activity was measured and represented as activation folds relative to cells without p17 expression.
p17 mediated cell growth inhibition, p53-drived reporter activity induction, and p21cip1/waf1 induction were abolished by dominant negative p53
To confirm the p17-induced cell growth retardation through the stimulation of p53 pathway, the p53 dominant negative mutant (G135A, mt135) was utilized to block p53 activity for monitoring the p53-mediated signal transduction pathway [20], [28]. The possible p53-mediated alterations in the viability of the cell were ruled out by trypan blue exclusion (data not shown). When Vero cells expressed dominant negative p53, the p17-induced p53-drived luciferase activity was reduced about 5- to 7-fold (Fig. 6 A), further, the p17-mediated growth retardation phenomenon was significantly released (Fig. 6B). Furthermore, p17-mediated p21cip1/waf1 induction was abolished in the presence of dominant negative p53 (Fig. 6C, lanes 5 and 6). Taking all of these results together, we conclude that p17-mediated effect took place through the activation of p53 and p21cip1/waf1.
Fig. 6.
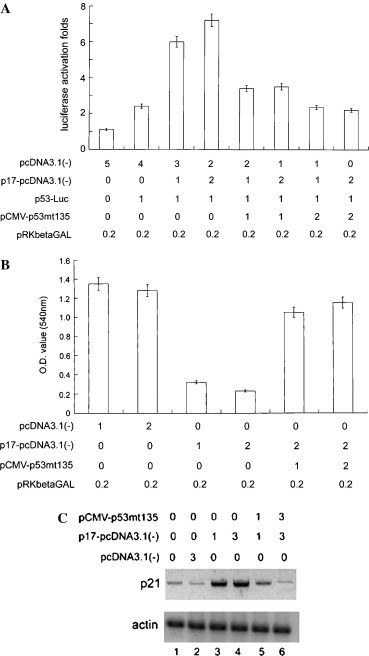
Dominant negative p53 expression releas of the p17-mediated effects. (A) Dominant negative p53 expression blocked the p17-induced p53-drived reporter activity. Luciferase assay of cells transfected with pcDNA3.1(−) or p17-pcDNA3.1(−) and p53-driven luciferase reporter upon dominant negative p53 expression. The amounts of the reporter and effector plasmids (μg) transfected were as indicated. pRKbetaGAL expressed β-galactosidase was included here as transfection efficiency normalization standard. The total amount of DNA mixture of each reaction was identical. Three independent experiments were conducted to calculate the standard deviation. (B) MTT assay revealed that dominant negative p53 expression rescued the growth retardation upon p17 expression. β-Galactosidase activity was measured to normalize transfection efficiency. The data represented here are the average of three independent experiments. (C) Western blot analysis demonstrated that the dominant negative p53 expression reduced the p21cip1/waf1 expression induced by p17 (lanes 3, 4, 5, and 6).
Discussion
Modulation of cell growth is a common feature of infection of animal virus and also contributes to the pathogenesis progress. The current study demonstrated that the p17 expressing Vero, BHK, 293, and HeLa cells grew at a slower rate than control cells. The involved molecular mechanism could, at least partially, be activation of p53 and induction of p21cip1/waf1. To our knowledge, this is the first report to show that ARV p17 is capable of retarding cell growth in cultured transiently transfected cells, a novel biological function of p17. The inhibition of cell growth effect of p17 was more dramatic when cells were cultured in low serum medium. We explained that this result may be due to the complex components (e.g., growth factors, serum protein) of fetal bovine serum, and these factors may modulate cellular signaling and cell cycle check point control. In medium with lower serum concentration, the effect of serum component might be reduced.
A recent report by Costas et al. [8], showed that ARV p17 contained monopartite nuclear localization signal (NLS), and, p17 shuttles continuously between nuclear and cytoplasm. These investigators suggested that p17 might regulate cellular or viral nuclear processes. A potential role of p17 in regulating nuclear processes was reinforced by our recent finding that p17 has transactivation function (our unpublished data). More detailed studies were needed to clarify the precise role of p17.
The mammalian reovirus S1 gene expresses a 14 kDa non-structural protein, named σ1s, which is a homologue of ARV. By analyzing the reassortant mammalian reovirus (MRV), previous results indicated that σ1s is required for MRV-induced G2/M arrest [16]. However, a comparative analysis of the deduced amino acid sequence of p17 and σ1s revealed no significant similarities in their primary sequence and showed an absence of conserved functional motifs [24]. However, we cannot exclude the possibility that the folding structure of p17 and σ1s might be similar.
Many viruses manipulate the host cell cycle regulation in order to further their own replication. Several human and animal viral proteins are known to induce cell cycle arrest in G0/G1 and/ or G2/ M by inducing cyclin-dependent kinase (cdk) inhibitor p21cip1/waf1, as well as p53, e.g., herpes simplex virus ICP0 and ICP27 [11], [15], Epstein–Barr virus Zta protein [5], murine coronavirus non-structural protein p28 [6], and T-cell leukemia virus type-1 Tax protein [25]. Thus, defects in the regulation of cell cycle progress are thought to be common features of viral infection. Such modification of the cell cycle control may provide a better cellular environment for efficient viral replication, at least in part, contributing to virus-associated pathogenesis.
Acknowledgment
This work was supported by a grant from the National Science Council (NSC93-2313-B-320-002).
References
- 1.Bodelon G., Labrada L., Martinez-Costas J., Benavente J. The avian reovirus genome segment S1 is functionally tricistronic gene that express one structural and two nonstructural proteins in infected cells. Virology. 2001;290:181–191. doi: 10.1006/viro.2001.1159. [DOI] [PubMed] [Google Scholar]
- 2.Brown J.P., Pagano M. Mechanisms of p53 degradation. Biochim. Biophys. Acta. 1997;1332:1–6. doi: 10.1016/s0304-419x(96)00048-0. [DOI] [PubMed] [Google Scholar]
- 3.airns P., Mao L., Merlo A., Lee D.J., Schwabb D., Eby Y., Tokino K., Vanderletf P., Blaugrund J.E., Sidransky D. Rates of p16 (MTS1) mutations in primary tumors with 9p loss. Science. 1994;265:415–416. doi: 10.1126/science.8023167. [DOI] [PubMed] [Google Scholar]
- 4.Carmichael J., DeGraff W.G., Gazdar A.F., Minna J.D., Mitchell J.B. Evaluation of a tetrazolium-based semiautomated colorimetric assay: assessment of chemosensitivity testing. Cancer Res. 1987;47:936–942. [PubMed] [Google Scholar]
- 5.Cayrol C., Flemington E.K. The Epstein–Barr virus bZIP transcription factor Zta causes G0/G1 cell cycle arrest through induction of cyclin-dependent kinase inhibitors. EMBO J. 1996;15(11):2748–2759. [PMC free article] [PubMed] [Google Scholar]
- 6.Chen C.J., Sugitama K., Hubo H., Huang C., Makino S. Murine coronavirus nonstructural protein p28 arrests cell cycle in G0/G1 phase. J. Virol. 2004;78:10410–10419. doi: 10.1128/JVI.78.19.10410-10419.2004. [DOI] [PMC free article] [PubMed] [Google Scholar]
- 7.Cho N.H., Kim Y.T., Kim J.W. Alternation of cell cycle in cervical tumor associated with human papillomavirus-cyclin-dependent kinase inhibitors. Yonsei. Med. J. 2002;43:722–728. doi: 10.3349/ymj.2002.43.6.722. [DOI] [PubMed] [Google Scholar]
- 8.Costas C., Martinez-Costas J., Bodelon G., Benavente J. The second open reading frame of the avian reovirus S1 gene encodes a transcription-dependent and CRM1-independent nucleocytoplasmic shuttling protein. J. Virol. 2005;79(4):2141–2150. doi: 10.1128/JVI.79.4.2141-2150.2005. [DOI] [PMC free article] [PubMed] [Google Scholar]
- 9.El-Deiry W.S., Tokino T., Velculescu V.E., Levy D.B., Parsons R., Trent J.M., Lin D., Mercer W.E., Kinzler K., Vogelstein B. WAF1, a potent mediator of p53 tumor suppression. Cell. 1993;75:817–825. doi: 10.1016/0092-8674(93)90500-p. [DOI] [PubMed] [Google Scholar]
- 10.Gulbis J.M., Kelman Z., Hurwitz J., O’Donnell M., Kuriyan J. Structure of the C-terminal region of p21 (WAF1/ CIP1) complexed with human PCNA. Cell. 1996;87:297–306. doi: 10.1016/s0092-8674(00)81347-1. [DOI] [PubMed] [Google Scholar]
- 11.Hobbs W.E., 2nd, DeLuca N.A. Perturbation of cell cycle progression and cellular gene expression as a function of herpes simplex virus ICP0. J. Virol. 1999;73(10):8245–8255. doi: 10.1128/jvi.73.10.8245-8255.1999. [DOI] [PMC free article] [PubMed] [Google Scholar]
- 12.Jones R.C. Avian reovirus infections. Rev. Sci. Tech. 2000;19:614–625. doi: 10.20506/rst.19.2.1237. [DOI] [PubMed] [Google Scholar]
- 13.Li R., Waga S., Hannon G.J., Beach D., Stillman B. Differential effects by the p21 CDK inhibitor on PCNA-dependent DNA replication and repair. Nature. 1994;371:534–537. doi: 10.1038/371534a0. [DOI] [PubMed] [Google Scholar]
- 14.Lin C.S., Kuo H.H., Chen J.Y., Yang C.S., Wang W.B. Epstein–Barr virusnuclear antigen 2 retards cell growth, induces p21WAF1 expression, and modulates p53 activity post-translationally. J. Mol. Biol. 2000;303:7–23. doi: 10.1006/jmbi.2000.4121. [DOI] [PubMed] [Google Scholar]
- 15.Lomonte P., Everett R.D. Herpes simplex virus type 1 immediate-early protein Vmw110 inhibits progression of cells through mitosis and from G(1) into S phase of the cell cycle. J. Virol. 1999;73(11):9456–9467. doi: 10.1128/jvi.73.11.9456-9467.1999. [DOI] [PMC free article] [PubMed] [Google Scholar]
- 16.Poggioli G.J., Keefer C., Connolly J.L., Dermody T.S., Tyler K.L. Reovirus-induced G (2)/M cell cycle arrest requires sigma1s and occurs in the absence of apoptosis. J. Virol. 2000;74(20):9562–9670. doi: 10.1128/jvi.74.20.9562-9570.2000. [DOI] [PMC free article] [PubMed] [Google Scholar]
- 17.Quelle D.E., Zindy F., Ashmun R.A., Sherr C.J. Alternative reading frames of the INK4a tumor suppressor gene encode two unrelated proteins capable of inducing cell cycle arrest. Cell. 1995;83:993–1000. doi: 10.1016/0092-8674(95)90214-7. [DOI] [PubMed] [Google Scholar]
- 18.Robertson M.D., Wilcox G.E. Avian reovirus. Vet. Bull. 1986;56:155–174. [Google Scholar]
- 19.Robson C.N., Gnanapragasam V., Byrne R.L., Collins A.T. Transforming growth factor-β 1 upregulates p15, p21 and p27 and blocks cell cycling in G1 in human prostate epithelium. J. Endocrinol. 1999;160:257–266. doi: 10.1677/joe.0.1600257. [DOI] [PubMed] [Google Scholar]
- 20.Scheffner M., Takahashi T., Huibregtse J.M., Minna J.D., Howley P.M. Interaction of the human papillomavirus type 16 E6 oncoprotein with wild-type and mutant human p53 proteins. J. Virol. 1992;66(8):5100–5105. doi: 10.1128/jvi.66.8.5100-5105.1992. [DOI] [PMC free article] [PubMed] [Google Scholar]
- 21.Sherr C.J. G1 phase progression: cycling on cue. Cell. 1994;79:551–555. doi: 10.1016/0092-8674(94)90540-1. [DOI] [PubMed] [Google Scholar]
- 22.Sherr C.J., Roberts J.M. CDK inhibitors: positive and negative regulators of G1-phase progression. Genes Dev. 1999;13:1501–1512. doi: 10.1101/gad.13.12.1501. [DOI] [PubMed] [Google Scholar]
- 23.Shih W.L., Hsu H.W., Liao M.H., Lee L.H., Liu H.J. Avian reovirus sigmaC protein induces apoptosis in cultured cells. Virology. 2004;321(1):65–74. doi: 10.1016/j.virol.2003.12.004. [DOI] [PubMed] [Google Scholar]
- 24.Shmulevitz M., Yameen Z., Dawe S., Shou J., O’Hara D., Holmes I., Duncan R. Sequential partially overlapping gene arrangement in the tricistronic S1 genome segments of avian reovirus and Nelson Bay reovirus: implications for translation initiation. J. Virol. 2002;76(2):609–618. doi: 10.1128/JVI.76.2.609-618.2002. [DOI] [PMC free article] [PubMed] [Google Scholar]
- 25.Sieburg M., Tripp A., Ma J.W., Feuer G. Human T-cell leukemia virus type 1 (HTLV-1) and HTLV-2 tax oncoproteins modulate cell cycle progression and apoptosis. J. Virol. 2004;78(19):10399–10409. doi: 10.1128/JVI.78.19.10399-10409.2004. [DOI] [PMC free article] [PubMed] [Google Scholar]
- 26.Szekeres J., Pacsa A.S., Pejtsik B. Measurement of lymphocyte cytotoxicity by assessing endogenous alkaline phosphatase activity of the target cells. J. Immunol. Methods. 1981;40(2):151–154. doi: 10.1016/0022-1759(81)90061-2. [DOI] [PubMed] [Google Scholar]
- 27.Yu F.L., Liao M.H., Lee J.W., Shih W.L. Induction of hepatoma cells migration by phosphoglucose isomerase/autocrine motility factor through the upregulation of matrix metalloproteinase-3. Biochem. Biophys. Res. Commun. 2004;30;314(1):76–82. doi: 10.1016/j.bbrc.2003.12.056. [DOI] [PubMed] [Google Scholar]
- 28.Vogelstein B., Kinzler K.W. p53 function and dysfunction. Cell. 1992;70(4):523–526. doi: 10.1016/0092-8674(92)90421-8. [DOI] [PubMed] [Google Scholar]
- 29.Xiao D.S., Wen J.F., Li J.H., Hu Z.L., Zheng H., Fu C.Y. Effect of deleted pancreatic cancer locus 4 gene transfection on biological behaviors of human colorectal carcinoma cells. World J. Gastroenterol. 2005;11(3):348–352. doi: 10.3748/wjg.v11.i3.348. [DOI] [PMC free article] [PubMed] [Google Scholar]