Abstract
Uniform light fluence distribution for patients undergoing photodynamic therapy (PDT) is critical to ensure predictable PDT outcomes. However, current practice when delivering intrapleural PDT uses a point source to deliver light that is monitored by 7 isotropic detectors placed within the pleural cavity to assess its uniformity. We have developed a real-time infrared (IR) tracking camera to follow the movement of the light point source and the surface contour of the treatment area. The calculated light fluence rates were matched with isotropic detectors using a two-correction factor method and an empirical model that includes both direct and scattered light components. Our clinical trial demonstrated that we can successfully implement the IR navigation system in 75% (15/20) of the patients. Data were successfully analyzed in 80% (12/15) patients because detector locations were not available for 3 patients. We conclude that it is feasible to use an IR camera-based system to track the motion of the light source during PDT and demonstrate its use to quantify the uniformity of light distribution, which deviated by a standard deviation of 18% from the prescribed light dose. The navigation system will fail when insufficient percentage of light source positions is obtained (<30%) during PDT.
Keywords: PDT, navigation system, light fluence, dosimetry
Graphical Abstract
Uniform light fluence distribution for patients undergoing photodynamic therapy (PDT) is critical to ensure predictable PDT outcomes. We have developed a real-time infrared (IR) tracking camera to follow the movement of the light point source and to determine the surface contour of the treatment area. We conclude that it is feasible to use an IR camera-based system to track the motion of the light source during PDT and demonstrate its use to quantify the uniformity of light distribution, which deviated by a standard deviation of 18% from the prescribed light dose.
INTRODUCTION
Photodynamic therapy (PDT) is a local treatment suitable for treatment of malignant, localized tumors such as malignant pleural mesothelioma (MPM) (1–6). MPM is an incurable cancer with median survival times in good performance status patients usually cited in the 12- to 18-month range with standard of care chemotherapy (7–9). To treat MPM, PDT is coupled with surgical gross debulking of the tumorous tissues, part of a trend in multi-modal regimes to increase survival rates. In a recent retrospective analysis, patients with MPM experienced a median overall survival of 3 years after the delivery of intraoperative PDT (1).
Light, photosensitizer, and oxygen are the three most important factors for PDT (10). Light dosimetry to ensure homogeneous light distribution over the treatment area is of great importance to treatment efficacy. To improve the uniformity of light fluence delivery, we have studied an IR navigation system to track the movement of the light source during PDT and calculate the light fluence distribution on the treatment area (11, 12). In the clinical protocol, the light uniformity is monitored using 7 detectors that are positioned in distinct locations within the thoracic cavity.
This paper summarizes the results for an IR navigation system used in a Phase I study of HPPH-mediated pleural PDT at University of Pennsylvania.
MATERIALS AND METHODS
Patient diagnosis and pleural PDT.
This clinical trial, entitled “A phase I trial of photodynamic therapy with HPPH in patients with pleural malignancy,” was initially reviewed and approved by the Institutional Review Board (IRB) of the University of Pennsylvania in December 2009. Informed consent was obtained from all subjects. The photosensitizing drug, HPPH®, was administered either 24 or 48 hours before irradiation at a dosage of ~ 0.1 mg/kg (4 mg/m2) using either 661 nm or 665 nm laser light at a light dose of 20 – 45 J/cm2. HPPH (2-[1-hexyloxyethyl]-2-devinyl pyropheophorbide-a (HPPH)) is a second generation photosensitizer, a chlorin-based compound derived from the pheophorbide-a of Spirrulina alga. Thirty-nine patients were enrolled in the phase I clinical protocol, however, only 29 of the patients successfully underwent PDT treatment. We implemented the IR navigation system in a subgroup of the Phase I trial from patient 10 to 34, all of these patients had a drug-light interval of 24 hours (see Table 1). Notice that missing case numbers in Table 1 did not have PDT treatment at all for one reason or another. Diode lasers (B&W Tek, Newark, DE) provided 8W of continuous wavelength (CW) either 661 nm or 665 nm wavelength light for PDT. For patients up to and including 19, 661 nm laser was used, for patients afterward, 665 nm laser was used. A light fluence between 20 and 45 J/cm2 as defined by the specific dose cohort was delivered to the entire pleural surface, which was measured by isotropic detectors (Medlight SA, Switzerland) in 7 locations within the pleural cavity: apex, posterior chest wall (PCW), anterior chest wall (ACW), posterior sulcus (PS), anterior sulcus (AS), posterior mediastinum (PM), and pericardium (Peri). Patients after #21 also had measurements from an additional detector monitoring point: diaphragm (Diaph).
Table 1.
Statistics of IR navigation system applied to the subgroup of patients (20) of the Phase I HPPH-pPDT clinical trial between 10 and 34. Patients with missing Case # between 10 and 34 did not have PDT even though they were enrolled into the phase I protocol. The first column is the patient ID, the second column is the results of percentage of good data (i.e., more than 3 of the reflective markers of the wand were not blocked by obstacles by the IR camera during PDT treatment) throughout the entire course of PDT treatment, the third column indicates whether a reference marker mounted on table was used or not, the forth column shows whether the detector positions were obtained or not.
| Case No. | Percent of good data (%) | Effective data | Reference | Detector |
|---|---|---|---|---|
| 10 | 7.6 | × | × | × |
| 12 | 27.0 | × | × | × |
| 13 | 46.3 | √ | × | √ |
| 15 | 13.0 | × | √ | × |
| 16 | 63.3 | √ | × | √ |
| 18 | 72.2 | √ | √ | × |
| 20 | 58.5 | √ | √ | √ |
| 21 | 41.7 | √ | × | × |
| 22 | 77.0 | √ | √ | √ |
| 23 | 11.2 | × | × | × |
| 24 | 41.5 | √ | √ | √ |
| 25 | 49.7 | √ | √ | √ |
| 26 | 49.2 | √ | √ | √ |
| 27 | 61.0 | √ | √ | √ |
| 28 | 42.3 | √ | √ | √ |
| 30 | 30.3 | √ | √ | √ |
| 31 | 46.7 | √ | √ | × |
| 32 | - | × | × | × |
| 33 | 44.4 | √ | √ | √ |
| 34 | 45.8 | √ | √ | √ |
Infrared (IR) navigation system, treatment delivery wand, and pleural cavity geometry.
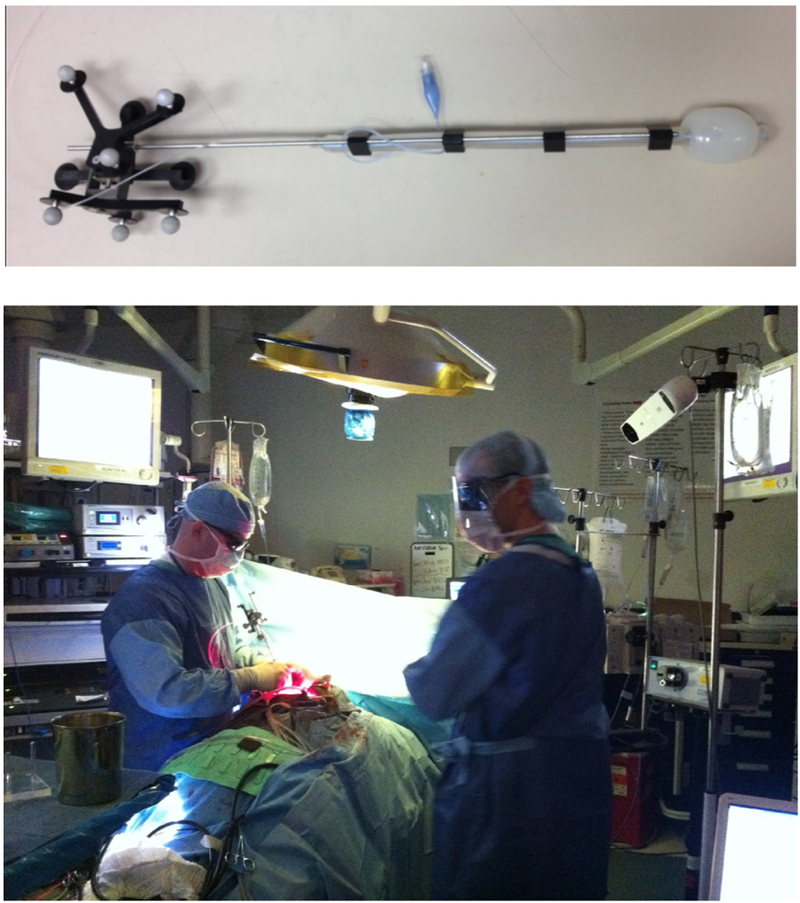
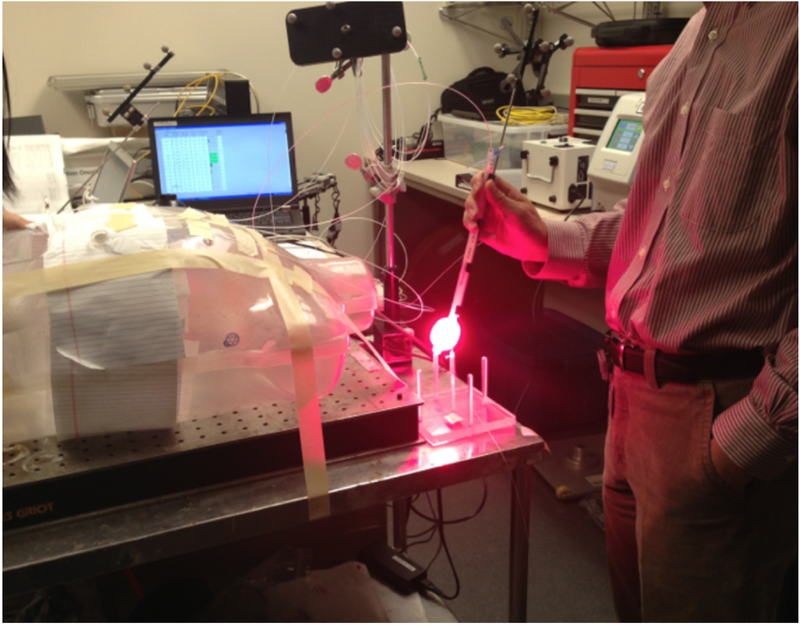
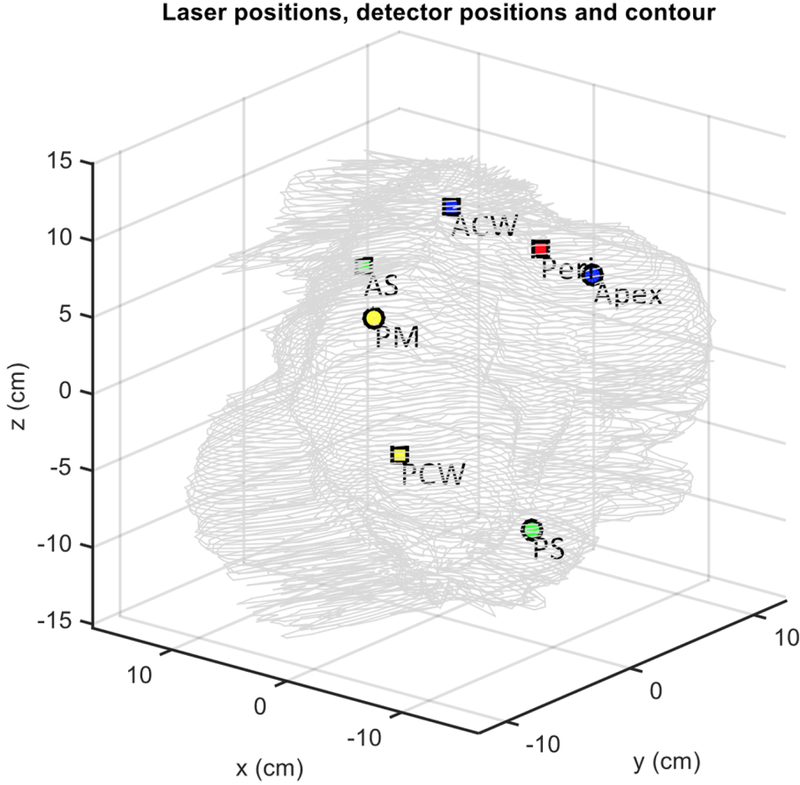
An NDI Polaris IR navigation system (Polaris, NDI, Waterloo, Canada) was used to track the light source movement during pleural PDT. The NDI stereo-camera was mounted on a tripod and a modified endotracheal tube fitted with a flat cut fiber was used for light delivery (Fig. 1) (13). As also shown in Fig. 1, 9 reflective markers are mounted on a custom-made shape at the end of the stainless steel rod that allows the camera to monitor the position of the tip of the rod at a 20 – 60 Hz sampling rate from 360 degree in space. The position of the tip of the rod is given by coordinates (x, y, z) and the orientation (Q0, Q1, Q2, Q3) at each sampling time. The accuracy of the system is about 0.5 mm in 3D (active volume: 205×186×147 cm3). To translate the position from the tip of the rod to the center of the light source (or the laser fiber tip), a laser source positioning calibration was performed in an 8-position calibration jig (Fig. 2) in the operating room immediately before PDT delivery. A calibrated isotropic detector was mounted in the center and light fluence was measured for 4 distant positions (when the wand was placed at one the 4 plastic poles at 5 cm from the center pole) and 4 close positions (when the wand was touching the detector from 4 directions (left, right, front, back)). These measured light fluence rates were used along with the navigation system-determined laser wand positions to determine the location of the laser source inside the ET tube (12). Before light delivery for PDT, a 3-min mock treatment was performed using the laser wand to determine the pleural geometry using the position data obtained inside the pleural cavity. A detailed description of the algorithm to reconstruct the cavity contour was previously reported (14, 12). A separate detector positioning rod was used to determine the location of the 8 isotropic detectors on the pleural cavity. Figure 3 shows a reconstruction of the pleural cavity using the algorithm. This reconstruction of the pleural surface cavity is used as the target surface for light fluence delivery.
Figure 1.
Modified endotracheal (ET) tube fitted with a laser fiber inside 0.01% intralipid is used as treatment delivery wand. A stainless steel rod fit with a custom-shaped 360 degree 9-reflective ball mount was attached to the side of the treatment delivery wand to aid the determination of laser source position.
Figure 9.
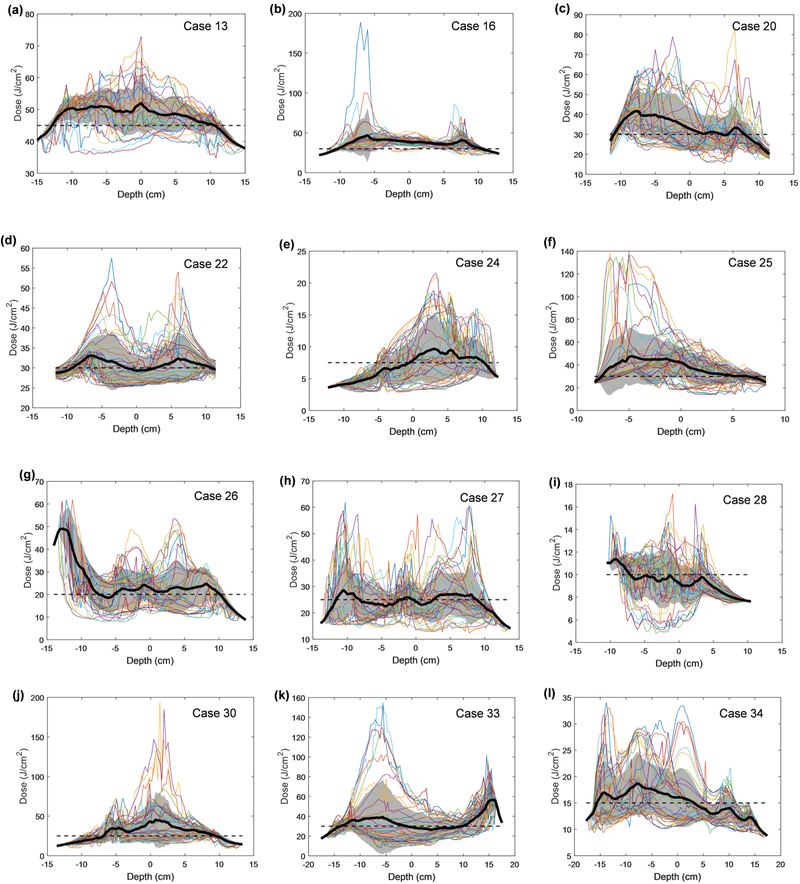
Fluence distribution for all patients along the z-axis (depth) for each angular location. The mean is shown in a solid black line and the standard deviation is indicated by the grey shaded area. Uniformity is calculated as percent variation and summarized for each patient in Table 5.
Figure 2.
Laser source positioning calibration devices are used to determine the shift between the laser source position inside the ET tube and the tip of the stainless steel rod. The device is composed of 4 poles positioned at equal distances (5 cm) from the central pole, which holds an isotropic detector. Light fluence rate was measured at these 4 positions plus another 4 positions when the 4-cm ET tube filled with 0.1% intralipid was in contact with the detector at front, back, right, left positions.
Figure 3.
Detector positions inside a patient’s pleural cavity contour determined from raw data.
Calculation of the light fluence during PDT.
One can calculate the light fluence rate (ϕ) by summing up the direct and the scattered light during pleural PDT. The direct light follows a simple formula for a point source, i.e.,
| (1) |
where r is the distance from the point of interest to the laser point source. The scattered light fluence rate inside the sphere, assuming an infinite number of reflections, is uniform due to the integrating sphere effect caused by scattered light by the tissue and can be represented by a constant b (mW/cm2). A dual correction method was applied to the light fluence rate:
| (2) |
Where CF(t) is a time dependent multiplication correction factor applied to the entire calculated light fluence rate (12). The dual correction was evaluated every 30 seconds and every 150 seconds, where the fluence rate up to the first time interval was matched and the total cumulative fluence at the second time interval was matched, both at the detector receiving the highest fluence rate.
Statistical analysis.
To evaluate the uncertainties of the calculated light fluence rate with or without the scatter light and the dual correction methods, the calculated light fluence was compared to the measured light fluence at the end of treatment at all 7 locations. The percentage difference between the measured and calculated light fluence was used to evaluate the uncertainty of the calculated light fluence rate.
RESULTS
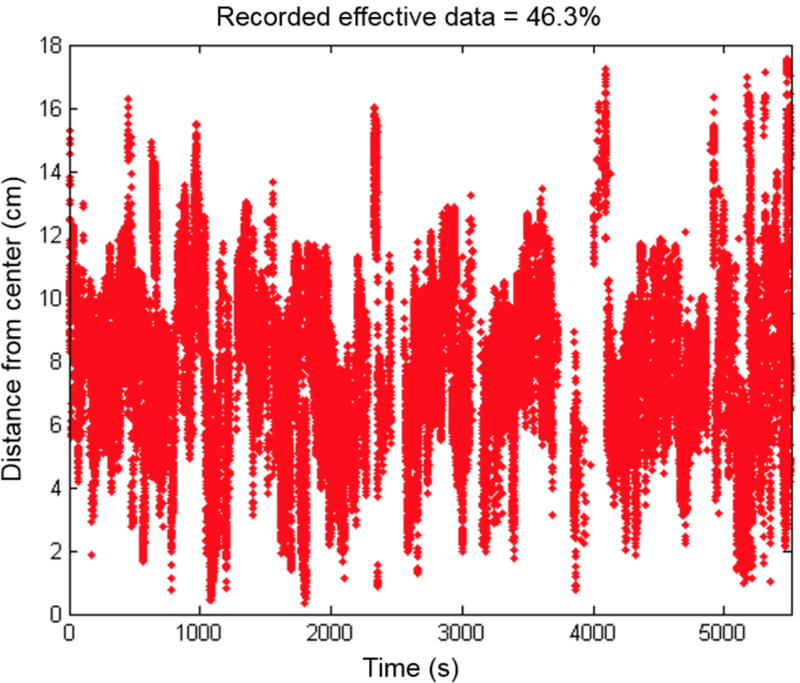
Figure 4 shows the distance from the center of mass measured for one representative patient (#13) vs. the time for the laser source position. Throughout the PDT treatment, 46.3% of data points recorded were termed “good data”, i.e. with a sufficient number of light source positions obtained evenly throughout the entire treatment to allow for accurate calculation of cumulative light fluence. The remaining data were discarded because the treatment wand was blocked by obstacles. Table 1 shows the percentage of good data from the IR navigation system for all 20 patients examined, whether the reference position to the operating room bed was obtained, and whether the detector positions were successfully obtained. The navigation system was not used for patients 11, 14, 17, and 29. Only 15 patients among the 20 patients had sufficient good data from the IR navigation system for data analysis. Table 2 shows the shift between the tip of the stainless rod (see Fig. 1) and the light source position for these 15 patients.
Figure 4.
Time and distance from the center of effective data (i.e., none of the reflective markers are blocked during PDT treatment) acquired throughout the entire course of PDT treatment of a representative patient (Case No. 013).
Table 2.
Light source point shift from calibration point obtained in the calibration performed right before PDT in OR using the positioning calibration jig as shown in Fig. 2 for 15 patients with good navigation data.
| Case No. | Shift x (cm) | Shift y (cm) | Shift z (cm) | Average |
|---|---|---|---|---|
| 13 | 0.58 | 1.14 | −2.41 | −0.2±1.6 |
| 16 | 0.52 | −0.42 | −2.04 | −0.6±1.1 |
| 18 | −2.21 | −0.61 | −4.08 | −2.3±1.4 |
| 20 | 2.69 | 3.25 | −3.68 | 0.8±3.2 |
| 21 | 0 | 1 | −3 | −0.7±1.7 |
| 22 | 1.20 | 0.94 | −1.49 | 0.2±1.2 |
| 24 | 1.64 | 0.53 | −2.10 | 0.0±1.6 |
| 25 | 1.53 | 0.79 | −4.11 | −0.6±2.5 |
| 26 | −1.85 | 0.26 | −4.36 | −2.0±1.9 |
| 27 | 1.25 | 0.29 | −3.51 | −0.7±2.1 |
| 28 | 1.42 | 0.43 | −4.15 | −0.8±2.4 |
| 30 | 0.86 | −0.55 | −4.23 | −1.3±2.2 |
| 31 | 0 | 1 | −3 | −0.7±1.7 |
| 33 | 1.12 | −0.21 | −2.41 | −0.5±1.5 |
| 34 | 1.42 | 0.40 | −3.08 | −0.4±1.9 |
| Average | 0.7±1.3 | 0.6±0.9 | −3.2±0.9 |
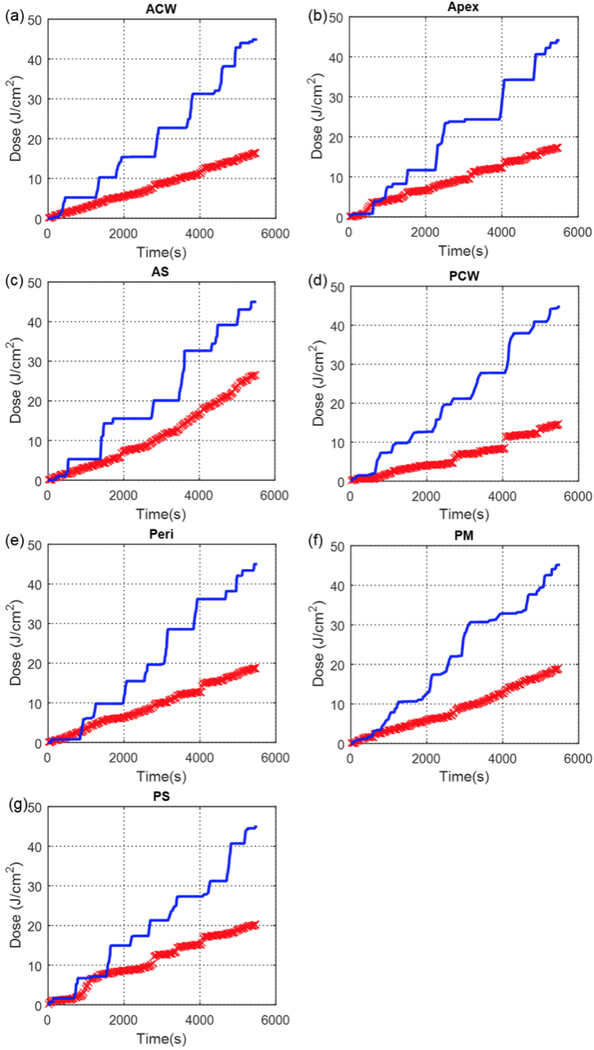
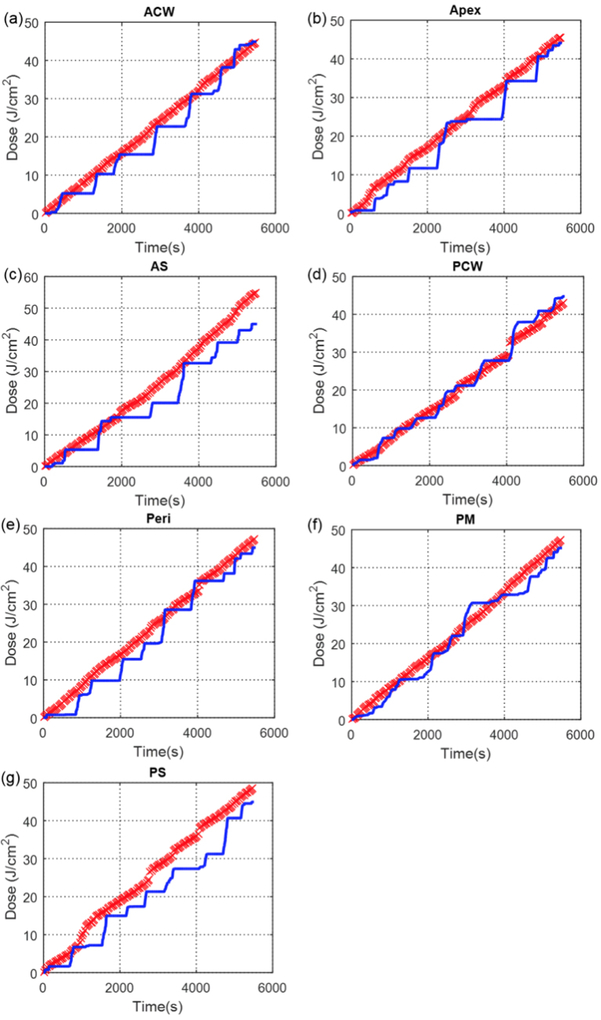
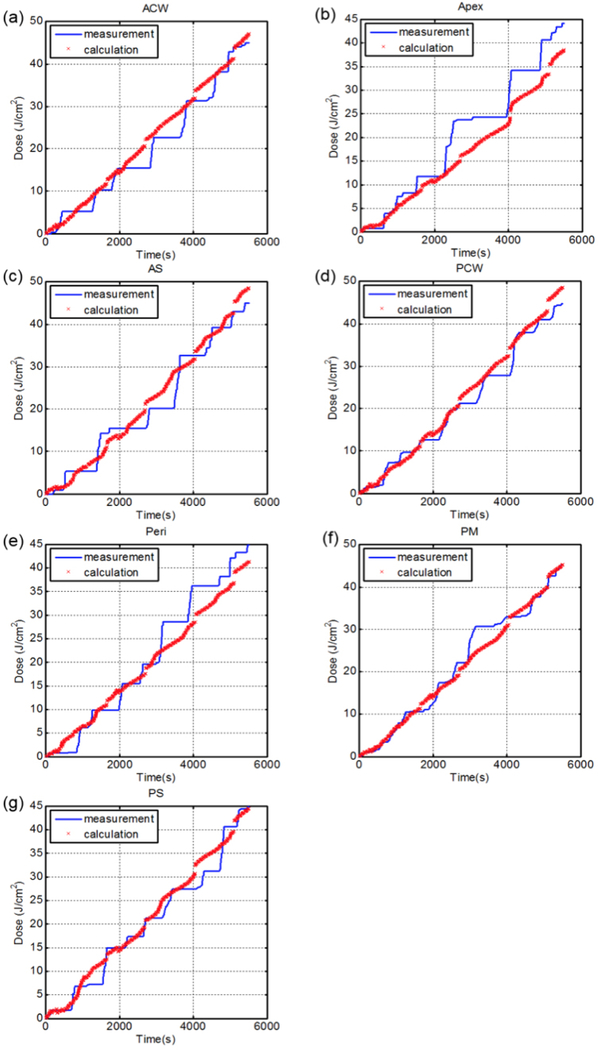
Figure 5 shows the comparison between measured light cumulative fluence vs. time at all 7 locations with the calculation using direct light (Eq. 1). Figure 6 shows the comparison between measured light cumulative fluence vs. time at all 7 locations with the calculation using direct light plus dual correction (Eq. 2 with b=0). Figure 7 shows the comparison between measured light cumulative fluence vs. time at all 7 locations with the calculation using direct light plus dual correction (Eq. 2). Table 3 summarizes the total treatment time, the scatter constant b (mW/cm2), the surface area and the volume of the pleural cavity based on the IR navigation system, and the total fluence used for each patient. Table 4 shows the statistics of the percentage error between the measured and calculated light fluence at the end of PDT treatment using (a) direct component only (Eq. 1), (b) direct and scatter components, (c) direct component only with dual correction methods, and (d) direct and scatter components with dual correction methods.
Figure 5.
Measured (blue solid line) light fluence data over the course of treatment along with calculated (red ‘x’) light fluence using the direct component plotted for 7 detector locations (Case No. 013): (a) anterior chest wall (ACW), (b) apex, (c) anterior sulcus (AS), (d) posterior chest wall (PCW), (e) pericardium (Peri), (f) posterior mediastinum (PM), and (g) posterior sulcus (PS).
Figure 6.
Measured (blue solid line) light fluence data over the course of treatment along with calculated (red ‘x’) light fluence using the direct component with fixed scattered light plotted for 7 detector locations (Case No. 013): (a) anterior chest wall (ACW), (b) apex, (c) anterior sulcus (AS), (d) posterior chest wall (PCW), (e) pericardium (Peri), (f) posterior mediastinum (PM), and (g) posterior sulcus (PS).
Figure 7.
Measured (blue solid line) light fluence data over the course of treatment along with calculated (red ‘x’) light fluence using the direct component with fixed scattered light and the dual correction method plotted for 7 detector locations (Case No. 013): (a) anterior chest wall (ACW), (b) apex, (c) anterior sulcus (AS), (d) posterior chest wall (PCW), (e) pericardium (Peri), (f) posterior mediastinum (PM), and (g) posterior sulcus (PS).
Table 3.
Summary of treatment time, scattering component (b), pleural surface area, volume and total fluence for 12 patients whom we have successfully obtained light fluence distributions. IR navigation was performed partially for patient 24, 28 and 34, where the treatment time and the mean delivered fluence when IR navigation system was turned on are presented in parentheses.
| Case no | Treatment time (s) | b (mWcm−2) | Surface Area (cm2) | Volume (cm3) | Φ (Jcm−2) |
|---|---|---|---|---|---|
| 13 | 5506 | 4.78 | 692.7 | 2308.5 | 45 |
| 16 | 3094 | 8.98 | 731.0 | 2295.4 | 45 |
| 20 | 2294 | 9.15 | 1572.9 | 9532.4 | 30 |
| 22 | 2888 | 7.03 | 1619.0 | 10497.0 | 30 |
| 24 | 3230 (803) | 7.52 | 922.0 | 3782.1 | 30 (7.5) |
| 25 | 2793 | 6.83 | 778.1 | 3725.1 | 30 |
| 26 | 2257 | 6.03 | 772.4 | 2455.9 | 20 |
| 27 | 3090 | 5.53 | 554.5 | 1239.5 | 25 |
| 28 | 2565 (1198) | 4.58 | 858.4 | 4212.4 | 20 (10) |
| 30 | 2370 | 6.06 | 1133.9 | 4948.6 | 25 |
| 33 | 3581 | 4.26 | 1381.2 | 5530.8 | 30 |
| 34 | 2593 (1500) | 6.99 | 1149.6 | 3626.3 | 30 (15) |
| Average | 3000±800 | 6.5±1.5 | 1000±340 | 4500±2700 |
Table 4.
Percent error from measured light dose at the end of treatment with calculated light fluence using (a) direct component only, (b) direct and scattering components, (c) direct component with dual correction method, and (d) direct and scattering components with dual correction method. (Missing points did not get detector position.)
| (a) | Direct Component Only | ||||||||
|---|---|---|---|---|---|---|---|---|---|
| Case No. | Diaph | PS | AS | PM | PCW | ACW | Peri | Apex | Average |
| 13 | - | 63.3% | 50.9% | 61.1% | 57. 8% | 57.7% | 53.2% | 65.9% | 59%±5% |
| 16 | - | 64.2% | 63.0% | 41.9% | 49.3% | 60.3% | 71.8% | 80.8% | 62%±12% |
| 20 | - | 80.7% | 78.2% | 63.1% | 72.3% | 79.6% | 73.8% | 75.6% | 75%±6% |
| 22 | - | 67.3% | 61.0% | 74.9% | 87.4% | 57.0% | 80.8% | 59.4% | 70%±11% |
| 24 | - | 91.6% | 81.9% | 66.9% | - | 63.5% | 60.3% | 84.8% | 75%±12% |
| 25 | - | 20.1% | 59.3% | 28.9% | 36.7% | 47.7% | 3.3% | 50.7% | 35%±18% |
| 26 | 55.7% | 55.7% | 14.1% | 22.5% | 36.6% | 43.4% | 20.6% | 30.8% | 35%±15% |
| 27 | - | 32.3% | 26.4% | - | - | 19.0% | 32.4% | - | 28%±6% |
| 28 | - | - | 59.2% | 80.1% | 30.7% | 61.3% | 89.6% | 18.4% | 57%±25% |
| 30 | 50.8% | 22.6% | 58.4% | 16.7% | 28.0% | 47.1% | 50.8% | 67.3% | 43%±17% |
| 33 | 20.7% | 46.3% | 22.6% | 37.0% | 32.3% | 17.0% | 42.7% | 59.0% | 35%±14% |
| 34 | 36.9% | 73.3% | 24.7% | 27. 3% | 24.7% | 14.3% | 6.7% | 52. 9% | 33%±20% |
| Avg. | 41% ±14% |
56% ±23% |
50% ±22% |
47% ±22% |
46% ±20% |
47% ±20% |
49% ±27% |
59% ±19% |
|
| (b) | Direct and Scattering Component | ||||||||
| Case No. | Diaph | PS | AS | PM | PCW | ACW | Peri | Apex | Avg. |
| 13 | - | 4.7% | 7.7% | 2.5% | 0.8% | 0.9% | 5.4% | 7.3% | 4%±3% |
| 16 | - | 2.8% | 1.4% | 19.9% | 11.7% | 1.4% | 9.7% | 19.3% | 10%±7% |
| 20 | - | 5.0% | 9.9% | 15.1% | 7.4% | 3.7% | 1.1% | 0.8% | 6%±5% |
| 22 | - | 4.2% | 10.3% | 8.0% | 19.3% | 11.7% | 12.9% | 15.4% | 12%±5% |
| 24 | - | 16.3% | 6.6% | 8.4% | - | 11.8% | 15.0% | 9.5% | 11%±4% |
| 25 | - | 30.1% | 29.6% | 0.9% | 6.4% | 19.8% | 26.6% | 20.4% | 19%±11% |
| 26 | 26.2% | 26.2% | 6.1% | 30.9% | 35.9% | 21.9% | 0.3% | 12.3% | 20%±12% |
| 27 | - | 23.8% | 15.1% | - | - | 7.1% | 21.1% | - | 17%±6% |
| 28 | - | - | 20.7% | 13.7% | 20.2% | 4.5% | 25.8% | 0.1% | 14%±9% |
| 30 | 8.3% | 24.2% | 15.9% | 23.5% | 14.6% | 6.9% | 8.3% | 23.9% | 16%±7% |
| 33 | 14.1% | 11.6% | 11.5% | 2.3% | 2.4% | 17.8% | 7.9% | 24.3% | 12%±7% |
| 34 | 5.6% | 29.9% | 8.8% | 6.1% | 8.8% | 14.4% | 26.8% | 20.6% | 15%±9% |
| Avg. | 14% ±8% |
16% ±11% |
12% ±7% |
12% ±9% |
13% ±10% |
10% ±7% |
13% ±9% |
14% ±8% |
|
| (c) | Direct Component with Dual Correction | ||||||||
| Case No. | Diaph | PS | AS | PM | PCW | ACW | Peri | Apex | Avg. |
| 13 | - | 5.5% | 13.7% | 5.8% | 8.7% | 5.3% | 10.3% | 19.1% | 10%±5% |
| 16 | - | 4.0% | 4.6% | 28.2% | 42.2% | 19.8% | 6.0% | 38.8% | 21%±15% |
| 20 | - | 8.3% | 12.8% | 59.8% | 9.4% | 13.3% | 10.8% | 3.7% | 17%±18% |
| 22 | - | 12.8% | 3.7% | 11.9% | 7.3% | 12.5% | 5.5% | 6.8% | 9%±3% |
| 24 | - | 22.9% | 10.5% | 6.7% | - | 15.9% | 15.1% | 11.2% | 14%±5% |
| 25 | - | 1.0% | 32.6% | 25.7% | 31.7% | 1.5% | 39.1% | 13.3% | 21%±14% |
| 26 | 34.1% | 30.6% | 30.5% | 35.1% | 23.4% | 8.1% | 35.0% | 55.7% | 32%±12% |
| 27 | - | 18.4% | 14.0% | - | - | 44.3% | 32.8% | - | 27%±12% |
| 28 | - | - | 12.0% | 38.2% | 45.1% | 27.0% | 1.9% | 24.6% | 25%±15% |
| 30 | 19.1% | 12.7% | 24.0% | 7.1% | 10.8% | 21.8% | 19.3% | 23.2% | 17%±6% |
| 33 | 11.3% | 18.8% | 17.3% | 7.2% | 6.3% | 12.2% | 20.7% | 16.2% | 14%±5% |
| 34 | 21.2% | 51.6% | 16.7% | 6.7% | 16.7% | 14.3% | 17.6% | 36.7% | 23%±14% |
| Avg. | 21% ±8% |
17% ±14% |
16% ±9% |
21% ±17% |
20% ±14% |
16% ±11% |
18% ±12% |
23% ±15% |
|
| (d) | Direct and Scattering Component with Dual Correction | ||||||||
| Case No. | Diaph | PS | AS | PM | PCW | ACW | Peri | Apex | Avg. |
| 13 | - | 1.2% | 6.9% | 0.6% | 7.8% | 4.5% | 6.7% | 15.4% | 6%±5% |
| 16 | - | 3.4% | 5.8% | 2.7% | 0.9% | 4.1% | 5.6% | 8.8% | 5%±2% |
| 20 | - | 4.5% | 10.5% | 6.5% | 15.6% | 8.3% | 6.7% | 10.8% | 9%±3% |
| 22 | - | 1.8% | 2.1% | 4.2% | 5.7% | 8.1% | 4.7% | 5.2% | 5%±2% |
| 24 | - | 11.2% | 7.7% | 1.8% | - | 7.9% | 8.6% | 8.8% | 8%±3% |
| 25 | - | 17.0% | 22.2% | 2.0% | 3.1% | 12.9% | 15.1% | 12.1% | 12%±7% |
| 26 | 10.8% | 13.5% | 9.6% | 16.4% | 24.2% | 2.1% | 6.9% | 2.7% | 11%±7% |
| 27 | - | 3.5% | 11.5% | - | - | 0.8% | 2.1% | - | 5%±4% |
| 28 | - | - | 13.1% | 3.4% | 11.4% | 6.0% | 12.3% | 0.5% | 8%±5% |
| 30 | 6.4% | 15.6% | 13.6% | 4.6% | 4.4% | 18.3% | 7.2% | 2.4% | 9%±6% |
| 33 | 1.5% | 2.3% | 21.2% | 15.7% | 17.3% | 4.3% | 15.7% | 0.5% | 10%±8% |
| 34 | 8.5% | 20.7% | 6.7% | 5.7% | 6.7% | 5.7% | 6.7% | 14.7% | 9%±5% |
| Avg. | 7% ±3% |
9% ±7% |
11% ±6% |
6% ±5% |
10% ±7% |
7% ±5% |
8% ±4% |
7% ±5% |
|
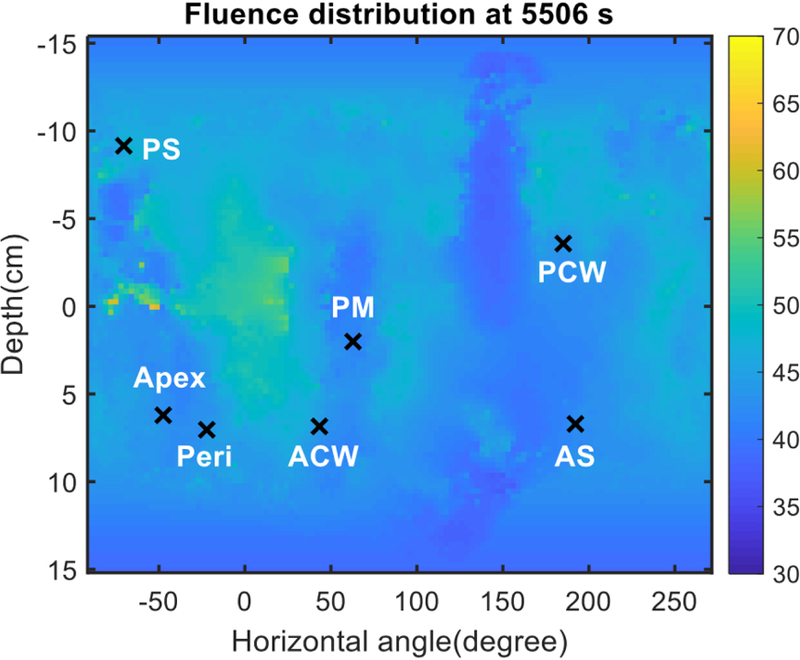
Figure 8 shows the final distribution of the light fluence at the end of PDT treatment for patient #13 using Eq. 2 with dual source corrections. The x-axis is the unwrapped angle of the pleural cavity and the y-axis is the distance in the patient superior and inferior direction. The locations of the 7 isotropic detectors are also shown in the figure. Figure 9 plots the light fluence rate distribution in the superior and inferior directions (depth, in cm) for all unwrapped angles for all patients analyzed. The darker line is the mean of the profiles with the grey area as the 1 standard deviation. Table 5 summarizes the percentage standard deviation from the ideal dose prescription for all 12 patients when both good navigation data and good detector positions were acquired.
Figure 8.
Fluence distribution map for a representative patient (Case No. 013). The 3D geometry is unwrapped and displayed on a 2D surface plot. Locations of 7 isotropic detectors are indicated by ‘x’ symbols.
Table 5.
Summary of uniformity across all horizontal angles for profiles in Fig. 9 for 12 patients with successful fluence distribution on pleural cavity.
| Case No. | Standard Deviation (% difference) |
Variation of Std. Deviation (% difference) |
|---|---|---|
| 13 | 6.9% | 8.9% |
| 16 | 14.5% | 18.6% |
| 20 | 17.4% | 25.4% |
| 22 | 3.8% | 12.3% |
| 24 | 24.9% | 30.2% |
| 25 | 18.9% | 33.5% |
| 26 | 31.1% | 28.7% |
| 27 | 11.1% | 24.0% |
| 28 | 12.6% | 17.7% |
| 30 | 30.0% | 32.7% |
| 33 | 23.0% | 43.8% |
| 34 | 15.2% | 22.7% |
| Average | 18% ± 8% | 25% ± 9% |
DISCUSSION
In this novel analysis, the position of the laser source was accurately tracked throughout the entire delivery of PDT treatment. We found that if the percentage of good data is >=30.3% (see Table 1), then sufficient number of laser source positions is obtained by the IR navigation system to predict the cumulative light fluence distribution. This is probably because the sampling rate of the navigation is very high, 20 – 60 samples per second. If the blocked data were randomly distributed throughout the PDT treatment, then there would be sufficient data points left to perform the light fluence rate calculations. Out of 20 patients studied, there are 75% (15/20) of patients with a sufficiently high percentage of good data for data analysis. Of the 15 patients with good data, 12 (80%) had isotropic detector positions acquired to apply the two-correction factor method for fluence distribution study.
Table 2 shows the shifts between the light source and the tip of the stainless steel rod. The average of z direction shift (along the rod direction) was −3.2±0.9 cm, meaning it was always extended beyond the tip of the rod. The standard deviation of z was 0.9 cm, reflecting the fact that the tip of the laser fiber was located at different locations relative to the ET tube by up to 0.9 cm. The positions of x and y are more random, with both plus and minus signs. The ideal position would be (0, 0), i.e., in the center of the rod. As shown in Fig. 2, the spherical bulb part of the ET tube can be a little tilted, which will affect the position of (x, y).
Figure 5 shows the comparison between the direct light fluence and the measured light fluence vs. time for patient 13. It is clear that the direct light is insufficient to account for the measured light fluence rate. Even if one applies the dual correction algorithm (Fig. 6, patient 13), one cannot make the measured light fluence to agree with the calculated light fluence at the end of PDT treatment for all 7 sites. Figure 6 shows that the agreement for apex was beyond an acceptable level (±15%), see Table 4c. If one applies the scatter fluence rate with a constant b, the agreement between measurement and calculation improves dramatically (see Table 4b). For patient 13, the addition of scatter light allows the calculated light fluence at all 7 sites to agree with the measurement at the end of the PDT treatment. When all patients are considered using Eq. 2, the dual correction method give the best overall agreement between measurement and calculations (see Fig. 7 and Table 4d). However, within this population of 12 patients, the agreement between calculated and measured values was not within ±15% for all sites (see Table 4d). We suspect this is caused by the uncertainty in determining the source positions. We have seen much better agreement between measurement and calculation when an improved wand design is used on which the reflective marker is made to directly relate to the position of the laser source (15).
For the 12 patients with both good navigation data and the detector locations (see Table 4), one can successfully apply the dual correction to the light fluence calculation. The resulting light fluence rate distribution is considered sufficiently accurate to determine the light fluence distribution at the end of PDT treatment (see Fig. 8). Figure 8 shows the light fluence distribution at the end of PDT treatment, with the light fluence in J/cm2 indicated by the color bar. By the conclusion of the treatment, this patient received 45 J/cm2 at every detector location. Figure 9 shows the corresponding profiles (in the anterior and superior direction) for all angles. For case 13, the calculated light fluence rate seems to be at 50 J/cm2, about 11% higher.
Figure 9 shows the profile for each patient analyzed in the study. The dark line is the mean of the profiles, while the dashed line indicates the ideal light fluence expected at the end of PDT treatment. The grey area encompasses one standard deviation of the variations of the profiles. There are some outlying profiles with very high light fluence rates, which usually correspond to the site of the surgical incision and thus are not in the pleural cavity. The mean profile is reflective of the uniformity of light fluence rate. The standard variation between the mean profile and the expected profile is shown in Table 5 for each patient analyzed. The average variation is 17.5% for all patients (Table 5). The variation of the mean is also shown in Table 5.
CONCLUSIONS
We have presented the summary results of light fluence distribution on the entire pleural cavity based on an IR navigation system and a dual correction method obtained from prospectively enroll patients treated with intrapleural PDT for malignant pleural mesothelioma. With the addition of scattered fluence rate, it is possible to obtain agreement between the calculation and measurement at all detector locations to a maximum (standard) uncertainty of 24.2% (5.7%). We can get good navigation data on 75% (15/20) of patients, and among these, detector location is available for 80% (12/15). The standard variation on the light fluence distribution on the pleural cavity is 17.5%.
Acknowledgements
This work is supported by grants from the National Institute of Health (NIH), R01 CA154562 and P01 CA87971.
Footnotes
This article is part of a Special Issue dedicated to Dr. Jarod Finlay. In memory of our colleague and good friend, Jarod C. Finlay, PhD, who passed away in April 2018. We will miss his ingenuity and his character as a physicist who possessed independent critical thinking.
References
- 1.Friedberg JS, Simone CB 2nd, Culligan MJ, Barsky AR, Doucette A, McNulty S, Hahn SM, Alley E, Sterman DH, Glatstein E and Cengel KA (2017) Extended Pleurectomy-Decortication–Based Treatment for Advanced Stage Epithelial Mesothelioma Yielding a Median Survival of Nearly Three Years. Ann Thorac Surg 103, 912–919. [DOI] [PMC free article] [PubMed] [Google Scholar]
- 2.Friedberg JS, Culligan MJ, Mick R, Stevenson J, Hahn SM, Sterman DH, Punekar S, Glatstein E and Cengel KA (2012) Radical pleurectomy and intraoperative photodynamic therapy for malignant pleural mesothelioma. Ann Thorac Surg 93, 1658–1665. [DOI] [PMC free article] [PubMed] [Google Scholar]
- 3.Friedberg JS, Mick R, Culligan M, Stevenson J, Fernandes A, Smith D, Glatstein E, Hahn SM and Cengel K (2011) Photodynamic Therapy and the Evolution of a Lung-Sparing Surgical Treatment for Mesothelioma. Ann. Thorac. Surg 91, 1738–1745. [DOI] [PubMed] [Google Scholar]
- 4.Du KL, Both S, Friedberg JS, Rengan R, Hahn SM and Cengel KA (2010) Extrapleural pneumonectomy, photodynamic therapy and intensity modulated radiation therapy for the treatment of malignant pleural mesothelioma. Cancer Biol Ther 10, 425–429. [DOI] [PubMed] [Google Scholar]
- 5.Simone CB 2nd and Cengel KA (2014) Photodynamic therapy for lung cancer and malignant pleural mesothelioma. Semin Oncol 41, 820–830. [DOI] [PMC free article] [PubMed] [Google Scholar]
- 6.Rice SR, Li YR, Busch TM, Kim MM, McNulty S, Dimofte A, Zhu TC, Cengel KA and Simone CB 2nd (2019) A Novel Prospective Study Assessing the Combination of Photodynamic Therapy and Proton Radiation Therapy: Safety and Outcomes when Treating Malignant Pleural Mesothelioma. Photochem Photobiol 95, 411–418. [DOI] [PMC free article] [PubMed] [Google Scholar]
- 7.Damhuis RA, Khakwani A, Deschutter H, Rich AI, Burgers JA and van Meerbeeck JP (2015) Treatment patterns and survival analysis in 9014 patients with malignant pleural mesothelioma from Belgium, the Netherlands and England. lung Cancer 89, 212–217. [DOI] [PubMed] [Google Scholar]
- 8.Zalcman G, Mazieres J, Margery J, Greillier L, AudigierValette C, Moro-Sibilot D, Molinier O, Corre R, Monnet I, Gounant V, Riviere F, Janicot H, Gervais R, Locher C, Milleron B, Tran Q, Lebitasy M-P, Morin F, Creveuil C, Parienti J-J and Scherpereel A (2016) Bevacizumab for newly diagnosed pleural mesothelioma in the Mesothelioma Avastin Cisplatin Pemetrexed Study (MAPS): a randomized, controlled, open-label, phase 3 trial. Lancet 387, 1405–1414. [DOI] [PubMed] [Google Scholar]
- 9.Vogelzang NJ, Rusthoven JJ, Symanowski J, Denham C, Kaukel E, Ruffie P, Gatzemeier U, Boyer M, Emri S, Manegold C, Niyikiza C and Paoletti P (2003) Phase III study of pemetrexed in combination with cisplatin versus cisplatin alone in patients with malignant pleural mesothelioma. J Clin Oncol 21, 2636–2644. [DOI] [PubMed] [Google Scholar]
- 10.Dougherty TJ, Gomer CJ, Jori G, Kessel D, Korbelik M, Moan J and Peng Q (1998) Photodymanic Therapy. J. Natl. Cancer Inst. 90, 889–905. [DOI] [PMC free article] [PubMed] [Google Scholar]
- 11.Zhu TC, Liang X, Chang C, Sandell J, Finlay JC, Dimofte A, Rodriguez C, Cengel K, Friedberg JS, Glatstein E and Hahn SM (2011) An IR navigation system for real-time treatment guidance of pleural PDT. Proc. SPIE 7886, 78860L. [DOI] [PMC free article] [PubMed] [Google Scholar]
- 12.Zhu TC, Liang X, Kim MM, Finlay JC, Dimofte A, Rodriguez C, Simone CB 2nd, Friedberg JS and Cengel KA (2015) An IR Navigation system for pleural PDT. Front. Phys 3, 1–12. [DOI] [PMC free article] [PubMed] [Google Scholar]
- 13.Delaney TF, Smith PD, Thomas GF, Tochner ZA, Sindelar WF, Pass HI, Harrington FS, Bonner RF and Mictchell JB (1991) A light diffusing device for intraoperative photodynamic therapy in the peritoneal or pleural cavity. J. Clin Laser Med Surg 9, 361–366. [DOI] [PubMed] [Google Scholar]
- 14.Zhu TC, Kim MM, Jacques SL, Penjweini R, Dimofte A, Finlay JC, Simone CB 2nd, Cengel KA and Friedberg JS (2015) Real-time treatment light dose guidance of pleural PDT: an update. Proc. SPIE 9308, 930809. [DOI] [PMC free article] [PubMed] [Google Scholar]
- 15.Zhu TC, Kim MM and Yi-Hong Ong RP, Dimofte Andreea, Finlay Jarod C., Rodriguez Carmen, and Cengel Keith A. (2017) A summary of light dose distribution using an IR navigation system for Photofrin-mediated Pleural PDT. Proc. SPIE 10047, 1004709. [DOI] [PMC free article] [PubMed] [Google Scholar]


