Abstract
The epidermis and its appendage, the hair follicle, represent an elegant developmental system in which cells are replenished with regularity because of controlled proliferation, lineage specification, and terminal differentiation. While transcriptome data exists for human epidermal and dermal cells, the hair follicle remains poorly characterized. Through single-cell resolution profiling of the epidermis and anagen hair follicle, we characterized the anatomical, transcriptional, functional, and pathological profiles of distinct epidermal, hair follicle, and hair follicle-associated cell subpopulations including melanocytes, endothelial cells, and immune cells. We additionally traced the differentiation trajectory of interfollicular and matrix cell progenitors and explored association of specific cell subpopulations to known molecular signatures of common skin conditions. These data simultaneously corroborate prior preliminary murine and human investigations while offering new insights into epidermal and hair follicle differentiation and pathogenesis.
INTRODUCTION
Skin has been the subject of extensive characterization at the pathological and molecular level in humans and mice for decades (Fuchs, 1998). During that time, numerous cell types within the epidermis and its appendages, the hair follicle, and sweat glands have been identified via immunohistochemical and array-based bulk gene expression analyses in each species. The characterization of epidermal, dermal, and hair follicles cells at a single cell resolution has lagged compared to other tissues, largely owing to limited sample sizes and the limitations of early single cell technologies. Previous single cell transcriptional methods (e.g. Fluidigm) required labor-intensive manual sorting of cells for array hybridization or sequencing, which necessitated significant sample sizes to overcome processing losses for reliable downstream application. Newer methods (e.g., Drop-seq, 10X Genomics), however, employ multiplex barcoding and microfluidics that enable the rapid parallel processing of thousands of cells at a lower cost with significantly improved sensitivity (Klein and Macosko, 2017; Picelli, 2017; Ziegenhain, Vieth et al., 2017).
The first single cell mapping of murine epidermal and hair follicle cells yielded 1422 unique transcriptome profiles, clustering into 25 unique subpopulations (Acosta, Joost et al., 2017; Joost, Zeisel et al., 2016). These human studies focused primarily on elucidation of interfollicular epidermal and dermal cell types and differential transcriptional programs activated by pathological processes such as psoriasis and wound healing (Cheng, Sedgewick et al., 2018; Philippeos, Telerman et al., 2018). Comparable characterization of human hair follicle cell types and differentiation states is currently lacking as profiling of human hair follicles is difficult due to their relative scarcity within the skin compared to mice.
In the current study, we gained access to follicular-enriched fractions of human skin that were discarded from hair transplant procedures and subjected them to high throughput sc-RNA procedures to gain single cell transcriptomes for many of the cells associated with human follicles. This allowed for the generation of single cell transcriptomes of numerous cell states within the follicle as well as epidermal keratinocytes, endothelial cells, mesenchymal populations, immune cells, and melanocytes. With these data, cell fate trajectories can be generated, and patterns of gene expression in skin diseases can be probed to find individual cell types that are targets of disease.
RESULTS
Single cell profiling of follicle-enriched human skin grafts
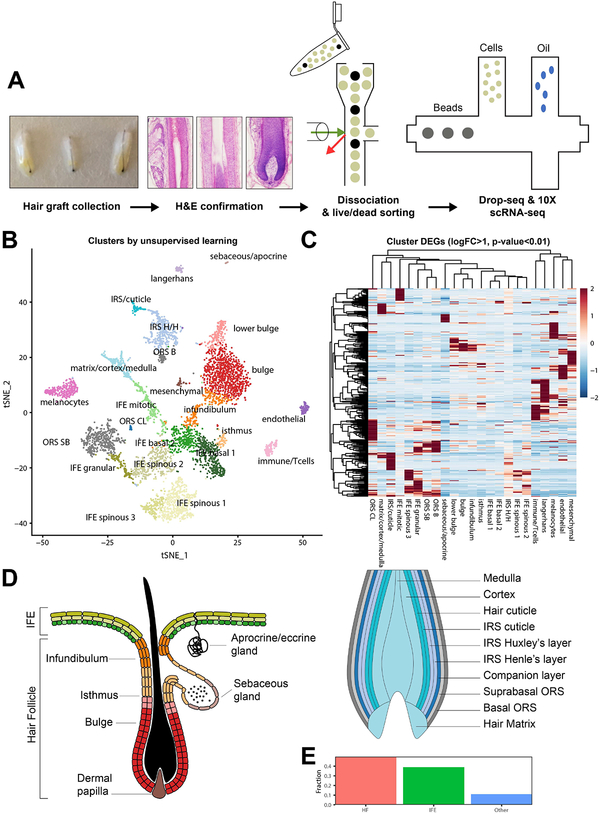
Prior human single cell investigations used fractions from total epidermis, resulting in a high ratio of epidermal to follicular cells (Cheng, Sedgewick et al., 2018). To improve single cell resolution of follicular cell types, anagen hair follicles were obtained from discarded human scalp micrografts collected for transplantation (Figure 1A). Micrografts are composed of several hair follicles, the hair bulbs, and variable amounts of surrounding tissues, including interfollicular epidermis, dermis, sebaceous/apocrine, among others. Micrografts were collected from five patients for single cell analysis and immunohistochemistry. Anagen phase was confirmed by H&E-labeled sections of adjacent graft samples. Following enzymatic and physical dissociation, single cell suspensions underwent fluorescence-activated cell sorted to remove dead cells and debris. Libraries were generated and sequenced using the Drop-seq (n=2) and commercial 10X Genomics (n=2) platforms (Klein and Macosko, 2017; Weisenfeld, Kumar et al., 2017). The 10X method identified more transcripts and genes compared to Drop-seq (Figure S1). Dataset integration was accomplishing using the Seurat integration method (Butler, Hoffman et al., 2018).
Figure 1. Identification of unique cell types from follicular-enriched scalp grafts by scRNA-seq.
(A) Experimental workflow schematic. Grafts were collected from human scalp, examined microscopically to confirm anagen phase, dissociated, then sorted to remove dead cells and other debris prior to Drop-seq or 10X sc-RNA-seq. (B) T-distributed stochastic neighbor embedding (t-SNE) visualization of clusters generated by unsupervised, graph-based clustering of the integrated dataset. (C) left, Illustration of the primary epidermal and follicular compartments present during Telogen identified; and right, depiction of the layers and cell types found in the bulb of anagen follicle (bulb not present during Telogen). (D) Percentage of epidermal, follicular, and other cell types identified. Abbreviations: IRS H/H = inner root sheath Huxley’s/Henley’s layers. ORS CL = outer root sheath companion layer. ORS SB/S = outer root sheath suprabasal/basal layer.
Unsupervised clustering and cell type identification
Unsupervised, graph-based clustering revealed 23 primary clusters of cells, visualized by t-distributed stochastic neighbor embedding (Figure 1B). Overlaid t-SNE projections of the Drop-seq and 10X sample and calculated cell counts from each technique were reviewed (Figure S1C–D). Differentially expressed genes (DEGs) between clusters, expression values of keratin isoforms, as well as MKI-67 expression were employed to identify the individual subpopulations. The Gene Expression Deconvolution Interactive Tool (GEDIT) was additionally employed for cell type identification using the Skin Signatures database to assess cluster DEGs (Figure S2A) (Swindell, Johnston et al., 2013).
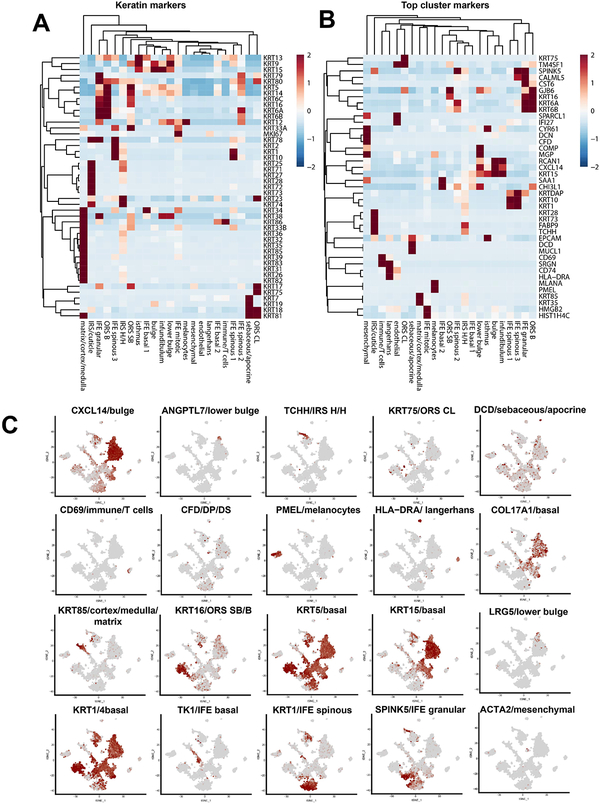
Hierarchical clustering of significant differentially expressed gene (DEGs, logFC>1, adjusted p-value <0.01) showed that distinct transcriptional profiles define each cell type (Figure 1C). The majority of the dataset (49.9%%, Figure 1D) consisted of hair follicle subpopulations present during Anagen (e.g., bulge, lower bulge, outer root sheath, inner root sheath, matrix, medulla, cortex, isthmus, infundibulum), indicative of a successful enrichment procedure. Note that lower bulge, matrix, medulla, and cortex are not present in Telogen follicles. Interfollicular epidermal cells constituted the next most prevalent cell type (39%); and T-cells, Langerhans cells, endothelial cells, apocrine/eccrine gland cells, melanocytes, and sebocytes were additionally identified (~11.1%). One cluster appeared to represent mesenchymal cell types potentially including dermal papillae (DP), dermal sheath (DS), smooth muscle, and fibroblasts (Figure S2B–C), but the cell number and the diversity within this cluster precluded definitive judgement. Highly differentially expressed keratin and non-keratin gene expression profiles are shown in Figure 2A–C to demonstrate specificity of expression. The epidermal transcriptional profiles largely reproduced the findings of (Cheng, Sedgewick et al., 2018). The full list of identified cell type makers arepresented in Table S1.
Figure 2. Cell type identification and gene expression profiles.
(A) Heatmap of genes differentially expressed at a logFC>1, adjusted p-value <0.01 by cluster. (B) Clustered heatmap of the top cluster-specific markers of each cluster by fold change. (C) Clustered heatmap of keratin isoform expression across identified clusters. (D) t-SNE visualization of known and previously undescribed markers of cell type. Abbreviations: IRS H/H = inner root sheath Huxley’s/Henley’s layers. ORS CL = outer root sheath companion layer. ORS SB/S = outer root sheath suprabasal/basal layer.
Immunostaining to confirm scRNA-seq-identified expression patterns
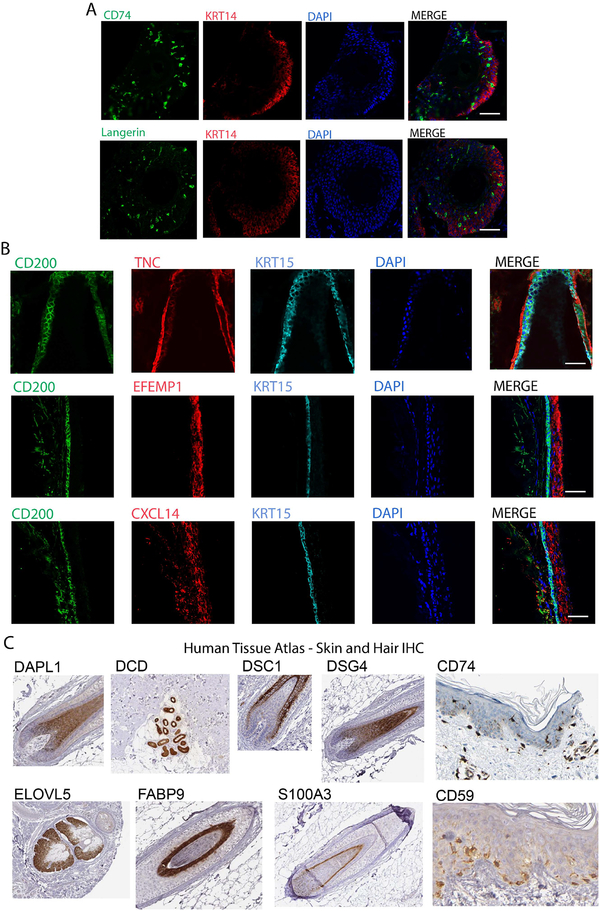
Melanocyte and Langerhans cell subpopulations were confirmed by langerin and CD74 labeling, respectively, in hair follicle sections (Figure 3A). To confirm the utility of scRNA-seq analysis in identifying previously undescribed subpopulation markers, we looked for enrichment of immunostaining with markers such as CXCL14 through immunostaining of hair follicle sections alongside known bulge marker, CD200, demonstrating co-localization (Figure 3B). Gene ontology analysis indicated enrichment of ECM protein synthesis associated with the bulge (Figure S3), confirmed by co-localization of ECM markers TNC and EFEMP1 (Figure 3B and lower magnification images in Figure S4A). These three secreted ECM components were indeed found at the protein level in the bulge compartment of the follicle in a pattern suggestive of their secretion. While these markers were not completely exclusive to the bulge in either the RNA-seq or immunostaining analyses, the presence of these proteins in the bulge was confirmatory for the sc-RNA-seq procedures.
Figure 3. Validation of enrichment of gene expression at the protein level.
(A) Immunostaining of serial sections of frozen hair follicle samples labeled with CD74 and Langerin (green) highlight Langerhans cells in the basal interfollicular epidermis (KRT14+, red). Nuclei labeled with DAPI. (B) Immunostaining of serial sections of frozen hair follicle samples labeled with antibodies against CXCL14, TNC, EFEMP1 (red) compared to canonical bulge markers CD200 (green) and KRT15 (blue). Nuclei labeled with DAPI. Note that scale bars for (A) and (B) indicate 50uM. (C) Immunohistochemistry the indicated epitopes derived from the Human Tissue Atlas for markers identified by scRNA-seq as specific to particular cell types.
We additionally analyzed the expression patterns of a subset of other putative markers identified by cluster differential gene expression analysis using an independently derived resource, the Human Tissue Atlas (Uhlen, Fagerberg et al., 2015), demonstrating the particular fidelity of this subset for hair follicle layers (Figure 3C, Figure S4B). Specifically, DAPL1 was predicted to be expressed in the cortex/medulla; DCD in sweat gland; DSC1 in IRS; DSG4 in cortex/medulla; CD74 in Langerhans cells; ELOVL5 in sebaceous glands; FABP9 in IRS; S100A3 in cuticle; and CD59 in melanocytes.
Lineage trajectory of epidermal and follicular cell progenitors
To examine the differentiation of the interfollicular epidermis (IFE), IFE cells were placed in pseudotemporal order (Figure 4A). Cells deriving from the basal IFE were predicted from this analysis to differentiate into the spinous and later granular layers, as would be predicted by decades of research on both human and murine skin (Figure 4B). Consistent with that reported in Cheng et. al 2018, there additionally exists a highly mitotically active subset of basal IFE cells which do not follow the traditional IFE differentiation pattern. As a result, we are confident in both the data and the methods employed to generate lineage trajectories. Also, as predicted, progressive loss of basal markers, KRT5, KRT14, and COL17A1 is observed coincident with a gain of spinous markers KRT10 and granular markers CALML5 expression as differentiation progresses (Figure 4C). The top genes driving differentiation are shown in Figure 4D.
Figure 4. Trajectory analysis of interfollicular progenitor cells.
(A) Pseudotemporal trajectory of analyzed interfollicular subpopulations. (B) Basal, spinous, and granular subpopulations in pseudotemporal order. (C) Expression of known critical keratin markers in pseudotime (branchpoint variations in expression not indicated). (D) Heatmap of top-scoring targets with differential expression across pseudotime.
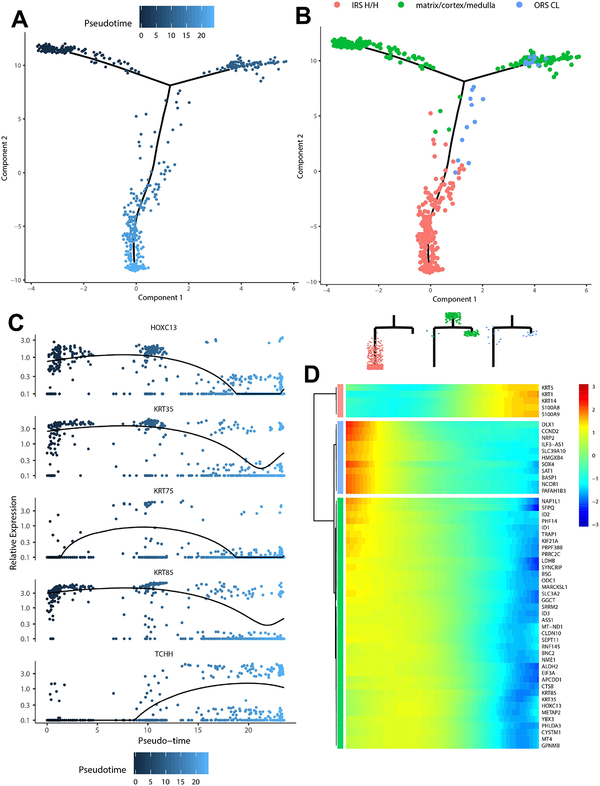
Probing for lineage trajectories in the hair follicle, we ordered data from the cortex/medulla/matrix, IRS Huxley’s/Henle’s layers, and ORS CL (Figure 5A–D). When placed in pseudotemporal order, the cortex/medulla/matrix population branches off, terminating in ORS companion layer cells as well as a further differentiated subset of cells, likely representing hair shaft medulla and cortex components. Additionally, the cortex/medulla/matrix subpopulation additionally gives rise to the IRS Huxley’s/Henle’s layers. These data are consistent with a prior report by Mesler et al 2017, in which early matrix progenitors give rise to the companion layer and later matrix progenitors give rise to IRS and lower hair shaft components (Mesler, Veniaminova et al., 2017).
Figure 5. Trajectory analysis of matrix progenitor cells.
(A) Pseudotemporal trajectory of analyzed interfollicular subpopulations. (B) Matrix, IRS Huxley’s/Henle’s layers, IRS cuticle, cuticle subpopulations in pseudotemporal order. (C) Expression of critical differentiation markers in pseudotime (branchpoint variations in expression not indicated). (D) Heatmap of top-scoring targets with differential expression across pseudotime.
Cell-type enrichment of pathological signatures
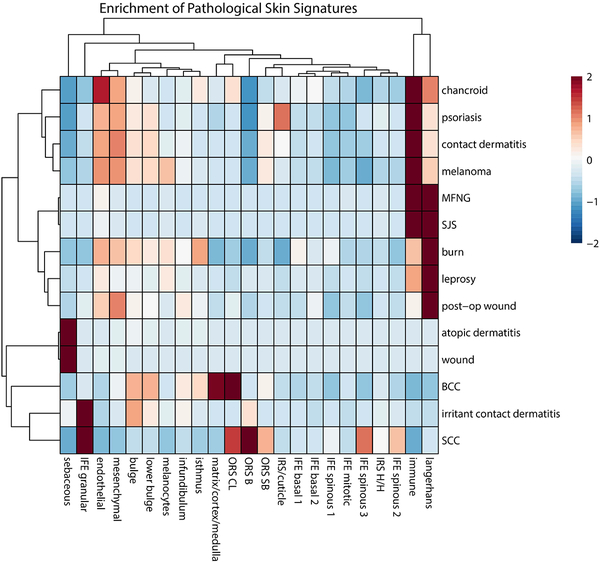
Another potential utility of these datasets is to link disease states to particular cell types in human skin. Numerous databases have been generated to describe the gene expression patterns associated with the onset or progression of skin diseases. In particular, DermDB2 (http://chlamy.mcdb.ucla.edu/NewDermDB/NewDermDB.html) provided a deep resource of data on gene expression patterns induced by various injuries, skin infections, cancers etc. The limitation of these databases is the fact that the analyses were performed on bulk tissue samples, so information about the effect on particular cell types is obscured. Here, we probed the expression of groups of genes associated with various skin syndromes across our scRNA datasets. As shown in Figure 6, 14 disease or injury states showed distinct patterns of expression in each of the clusters identified by within the scRNA datasets. Of note, some of the diseases known to be particularly related to immune responses showed a strong pattern of regulation in Langerhans and immune/T-cells (leprosy, SJS, MFNG). As expected, the three cancer expression patterns were most linked to cell types that have been described pathologically to be most similar to the indicated cancer type (IFE granular for Squamous Cell Carcinoma; bulge, ORS and matrixfor BCC; melanocytes for Melanoma). These results demonstrate that gene expression patterns of skin diseases can be linked to particular target cells through correlational analysis with scRNA-seq.
Figure 6. Cell type-specific enrichment of disease signatures.
Heatmaps of the average expression of skin pathology signatures across identified cell types. This analysis looks at the pattern of previously established gene expression differences specific to the indicated skin disorders to determine whether individual cell types show enrichment for the patterns found in these syndromes (Developed by Matteo Pellegrini and available at: http://chlamy.mcdb.ucla.edu/NewDermDB/NewDermDB.html).
DISCUSSION
Our use of follicle-enriched subsamples permitted single cell deconvolution of the transcriptomes of several layers of the human interfollicular epidermis, infundibulum, and hair follicle as well as a wide variety of follicle associated cells (e.g., immune, glandular, pigment). Furthermore, we demonstrated the feasibility of integrated datasets generated from different technologies while maintaining clear cell type resolutions. We utilized a multi-dimensional identification and validation strategy, examining known keratin and proliferative markers, ontological enrichment of differentially expressed genes, immunohistochemical labeling, as well as examination of the literature regarding newly identified, but less well-characterized putative markers. Overall, the strategy proved highly effective in discerning most of the known hair follicle cell types, and several cell types known to be associated with the follicle such as immune cells and melanocytes. The physical isolation of the hair follicles still allowed for the capture of cells from endothelial lineages and sweat gland cells allowing for the additional characterization of these important cell types in the skin.
We used expression of keratins to first establish cell identities, as this has proven useful in the past. In addition, we also used an existing database to confirm identities based on the entire profile of each cell cluster (Figure S2). These identities and cell type specificity of expression patterns were confirmed at the protein level using both immunostaining of follicles in our own lab (Figure 3 and Figure S4), as well as a database of immunostaining patterns freely available (Figure S4, Human Protein Atlas).
By performing ontological molecular overrepresentation analysis on each cell type’s differentially expressed genes, we uncovered some interesting patterns that further confirmed cell identities and revealed previously undescribed biological pathways (Figure S3). For instance, the epidermal subpopulations displayed enrichment for genes related to cell-cell adhesion and epidermal development, as would be expected for cells from stratified epithelia for whom barrier formation is a paramount activity; immune cells in the follicle preps showed enrichment for peptide antigen binding; the dermal sheath/papillae population showed enrichment for collagen binding, ECM organization etc.; and cells of the IRS showed enrichment for genes related to keratinization.
Enrichment profiling of identified cell types for known skin condition gene expression signatures permitted identification of previously undescribed epidermal and follicular constituents of skin pathogenesis. As expected, hyperactivation of immune response associated with conditions such as leprosy, SJS, and MFNG revealed enrichment of signatures in Langerhans and T-cells. Additionally, the three neoplastic signatures (SCC, BCC, melanoma) were linked to known pathological identification, i.e. epidermis/infundibulum for SCC, bulge/lower bulge for BCC, and melanocytes for melanoma.
The primary limitation of scRNA-seq is depth of coverage. While the current study permitted expanded coverage through integration of Drop-seq and 10X platforms from five distinct samples, deconvolution of highly related or sparse tissue populations (e.g., cortex vs. medulla vs. matrix) was not possible with the current sample size. However, together these data represent an important advance in the investigation of hair follicle biology. We anticipate these data will be borne out by others to supplement a variety of analyses and comparisons with other datasets to further elucidate critical components and mechanisms in epidermal and follicular cell development and differentiation.
METHODS
Sample harvest and preparation
Hair grafts were obtained from patients undergoing hair transplantation. Written, informed consent was obtained from each patient and the study protocol was approved through the Institutional Review Board (IRB#16–000681-AM-00002). Single cell suspensions were generated from the micrografts as previously described (Ohyama, Vogel JCI 2006). Briefly, the grafts were flushed with PBS and incubated in dispase overnight at 4°C. The following day, the grafts were incubated in the same dispase solution at 37°C for 30 minutes. Hair grafts were gently dissociated with a P1000 pipette then incubated for 10 minutes in trypsin 0.05% solution diluted with PBS. The grafts were again gently dissociated with P1000 pipette and placed back in 37°C for 10 minutes. Trypsin was deactivated with 5% FBS. Fibrous tissue and debris were filtered out with a 40um strainer. Single cells were visualized and counted with a hemocytometer and washed with PBS. Live cells were preferentially sorted using a FACS Aria III High-speed Cell Sorter and submitted for single cell sequencing.
Immunostaining
Hair grafts were embedded in OCT compound, frozen, and sectioned for immunostaining as previously described (Flores et al 2014). Frozen sections were fixed in acetone and labelled with the following primary antibodies: CD59 (Abcam ab69084 1:50), Melan A (Santa Cruz sc-20032 1:50), CD200 (Biorad MCA1960, 1:75), CD74 (Santa Cruz sc-6262 1:50), Keratin 14 (Covance PRB-155P 1:500), Keratin 15 (Covance PCK-153P 1:500), CXCL14 (Abcam ab36622 1:50), EFEMP1 (Abcam ab106429 1:50), Langerin (Santa Cruz sc-271272 1:50). Samples were imaged using a Leica TCS SP8 Digital Light Sheet Microscope at the UCLA CNSI Advanced Light Microscopy/Spectroscopy Shared Resource Facility.
scRNA-seq
The raw drop-seq data was processed using the Drop-seq tools v1.12 pipeline from the McCaroll lab, utilizing the standard parameters as shown in the documentation (https://github.com/broadinstitute/Drop-seq/releases/tag/v1.12). In brief, cell and molecular barcodes were extracted from raw sequencing data based on bases 1–12 for cell and 13–20 for molecular barcodes, whilst filtering out reads with poor quality bases TagBamWithReadSequenceExtended). Subsequently reads were trimmed to remove SMART adapter sequences as well as PolyA tails (FilterBAM, TrimStartingsequence & PolyATrimmer). HiSat2 was used to align these filtered reads to the human reference genome, hg38. Aligned reads were then merged with the unaligned reads to recapture molecular/cell BAM tags and subsequently reads were tagged with ‘GE’ if they overlapped with gene exons (MergeBamAlignment & TagReadWithGeneExon). Bead synthesis errors were then corrected and uMIs merged (DetectBeadSynthesisErrors). Finally, DGEs were generated using standard parameters (DigitalExpression). We performed all downstream analysis on these DGEs after filtering out cells with fewer than 250 genes. For 10X data, CellRanger2.2 pipelines were used to generate expression matrices with all standard parameters. Raw fastq files were processed and aligned to the human GrCh38 genome and the CellRanger cell detection algorithm was utilized to determine the numbers of GEMs per run. No other parameters were changed.
Computational Methods
All analyses were performed in R. Gene expression analysis and cell type identification were performed using the Seurat package (Butler, Hoffman et al., 2018; Satija, Farrell et al., 2015). Seurat objects were created for each sample. Only those genes that were expressed in more than five cells and cells that expressed more than 200 genes were retained (22000 cells). Cells with a high proportion (>5%) mitochondrial expression were filtered out as these typically represent cells damaged during isolation. Filtering was also performed on the number of detected transcripts within each sample to eliminate partial cells and doublets, respectively. Datasets were normalized and scaled according to default settings with regression against cell number and mitochondrial content, following by variable gene expression calculation (FindVariableGenes, × low cutoff = 0.03, × high cutoff = 3, y cutoff = 1). The union of the top 2000 variables genes were used to perform canonical correlation analysis (CCA) across the different samples and align the subspaces (FindIntegrationAnchors, IntegrateData), followed by integrated t-SNE visualization of all cells. A total of 5270 remaining cells were used in the final analysis. Gene expression markers were calculated for each subpopulation (FindAllMarkers, method = t-test). Average, log-normalized expression profiles were calculated for each gene using the AverageExpression function. Gene ontology and pathway enrichment analyses were executed in clusterProfiler. Heatmaps were generated with the pheatmap package. Pseudotime calculations were performed in Monocle 2 as previously described using the clusters and differentially expressed genes identified in Seurat using default settings (Qiu, Hill et al., 2017). Cell subpopulations were identified as described in the primary text.
Supplementary Material
Table S1. Differentially expressed genes between identified clusters.
Figure S1: Cross-platform data integration of Drop-seq and 10X datasets. (A) UMI and gene detection rates of Drop-seq (top, n=2) and 10X (bottom, n=2) platforms, respectively, with median values per cell. (B) t-SNE visualization of the results of the unsupervised, graph-based clustering on the integrated dataset by individual dataset (left) or platform (right). (C) Proportion of cells from the 10X and Drop-seq datasets within each identified cluster.
Figure S2: Gene Expression Deconvolution Interactive Tool analysis of gene expression. The tool may be found at: http://webtools.mcdb.ucla.edu. (A) Enrichment of skin signaturess(Swindell, Johnston et al., 2013)Human Primary Cell Atlas, and ENCODE. (B and C) Heatmap of dermal papillae and dermal sheath signature genes (provided by Michael Rendl, personal communication) and TSNE of co-localized expression of two markers for each cell type.
Figure S3: Overrepresentation analysis of GO molecular functions by cluster genes. Significantly differentially expressed genes between clusters were defined as logFC>1 and adjusted p-value<0.05). Only enriched categories with an adjusted p-value <0.05 are shown. Overrepresentation analysis and visualization performed using ClusterProfiler R package.
Figure S4: Immunohistochemical confirmation of expression of proteins predicted by sc-RNA-seq. A, immunofluorescence for the same markers shown in Figure 3, but at lower magnification (5×). B, Immunostains were derived from the Human Protein Atlas (Uhlen, Fagerberg et al., 2015).
ACKNOWLEDGEMENTS
We are indebted to Dr. Rassman for his support of this project and their patients who donated follicles for this effort. In addition, we are grateful to the BSCRC Genomics Core Facility at UCLA for RNA sequencing. Furthermore, we acknowledge Michael Rendl for his expertise on Dermal populations, and to Matteo Pellegrini (UCLA) for development and sharing of the DermDB2 database. Confocal laser scanning microscopy was performed at the CNSI Advanced Light Microscopy/Spectroscopy Shared Resource Facility at UCLA. This work was supported by awards to RT (Dermatology Foundation, Dermatologic Research Foundation of California, and the T32 Training Grant Dermatological Scientist Training Program, UCLA) and to WEL (NIH NIAMS 5R01AR070245).
Footnotes
Publisher's Disclaimer: This is a PDF file of an unedited manuscript that has been accepted for publication. As a service to our customers we are providing this early version of the manuscript. The manuscript will undergo copyediting, typesetting, and review of the resulting proof before it is published in its final form. Please note that during the production process errors may be discovered which could affect the content, and all legal disclaimers that apply to the journal pertain.
Data Availability
The scRNA-seq data are in NIH-GEO (GSE129611). The averaged data for all cell clusters are available in TableS2. The raw data are available through Figshare: https://figshare.com/s/74a818b57f08b0873a8c
CONFLICT OF INTEREST
WEL is a co-founder, shareholder, and president of Pelage Pharmaceuticals. Pelage Pharmaceuticals did not sponsor or support this work in any way. The additional authors have no conflicts of interest to disclose.
REFERENCES
- Acosta JR, Joost S, Karlsson K, Ehrlund A, Li X, Aouadi M, et al. (2017) Single cell transcriptomics suggest that human adipocyte progenitor cells constitute a homogeneous cell population. Stem Cell Res Ther 8:250. [DOI] [PMC free article] [PubMed] [Google Scholar]
- Butler A, Hoffman P, Smibert P, Papalexi E, Satija R (2018) Integrating single-cell transcriptomic data across different conditions, technologies, and species. Nat Biotechnol 36:411–20. [DOI] [PMC free article] [PubMed] [Google Scholar]
- Cheng JB, Sedgewick AJ, Finnegan AI, Harirchian P, Lee J, Kwon S, et al. (2018) Transcriptional Programming of Normal and Inflamed Human Epidermis at Single-Cell Resolution. Cell Rep 25:871–83. [DOI] [PMC free article] [PubMed] [Google Scholar]
- Fuchs E (1998) Beauty is skin deep: the fascinating biology of the epidermis and its appendages. Harvey lectures 94:47–77. [PubMed] [Google Scholar]
- Joost S, Zeisel A, Jacob T, Sun X, La Manno G, Lonnerberg P, et al. (2016) Single-Cell Transcriptomics Reveals that Differentiation and Spatial Signatures Shape Epidermal and Hair Follicle Heterogeneity. Cell Syst 3:221–37 e9. [DOI] [PMC free article] [PubMed] [Google Scholar]
- Klein AM, Macosko E (2017) InDrops and Drop-seq technologies for single-cell sequencing. Lab Chip 17:2540–1. [DOI] [PubMed] [Google Scholar]
- Mesler AL, Veniaminova NA, Lull MV, Wong SY (2017) Hair Follicle Terminal Differentiation Is Orchestrated by Distinct Early and Late Matrix Progenitors. Cell Rep 19:809–21. [DOI] [PMC free article] [PubMed] [Google Scholar]
- Philippeos C, Telerman SB, Oules B, Pisco AO, Shaw TJ, Elgueta R, et al. (2018) Spatial and Single-Cell Transcriptional Profiling Identifies Functionally Distinct Human Dermal Fibroblast Subpopulations. J Invest Dermatol 138:811–25. [DOI] [PMC free article] [PubMed] [Google Scholar]
- Picelli S (2017) Single-cell RNA-sequencing: The future of genome biology is now. RNA Biol 14:637–50. [DOI] [PMC free article] [PubMed] [Google Scholar]
- Qiu X, Hill A, Packer J, Lin D, Ma YA, Trapnell C (2017) Single-cell mRNA quantification and differential analysis with Census. Nat Methods 14:309–15. [DOI] [PMC free article] [PubMed] [Google Scholar]
- Satija R, Farrell JA, Gennert D, Schier AF, Regev A (2015) Spatial reconstruction of single-cell gene expression data. Nat Biotechnol 33:495–502. [DOI] [PMC free article] [PubMed] [Google Scholar]
- Swindell WR, Johnston A, Voorhees JJ, Elder JT, Gudjonsson JE (2013) Dissecting the psoriasis transcriptome: inflammatory- and cytokine-driven gene expression in lesions from 163 patients. BMC Genomics 14:527. [DOI] [PMC free article] [PubMed] [Google Scholar]
- Uhlen M, Fagerberg L, Hallstrom BM, Lindskog C, Oksvold P, Mardinoglu A, et al. (2015) Proteomics. Tissue-based map of the human proteome. Science 347:1260419. [DOI] [PubMed] [Google Scholar]
- Weisenfeld NI, Kumar V, Shah P, Church DM, Jaffe DB (2017) Direct determination of diploid genome sequences. Genome Res 27:757–67. [DOI] [PMC free article] [PubMed] [Google Scholar]
- Ziegenhain C, Vieth B, Parekh S, Reinius B, Guillaumet-Adkins A, Smets M, et al. (2017) Comparative Analysis of Single-Cell RNA Sequencing Methods. Mol Cell 65:631–43 e4. [DOI] [PubMed] [Google Scholar]
Associated Data
This section collects any data citations, data availability statements, or supplementary materials included in this article.
Supplementary Materials
Table S1. Differentially expressed genes between identified clusters.
Figure S1: Cross-platform data integration of Drop-seq and 10X datasets. (A) UMI and gene detection rates of Drop-seq (top, n=2) and 10X (bottom, n=2) platforms, respectively, with median values per cell. (B) t-SNE visualization of the results of the unsupervised, graph-based clustering on the integrated dataset by individual dataset (left) or platform (right). (C) Proportion of cells from the 10X and Drop-seq datasets within each identified cluster.
Figure S2: Gene Expression Deconvolution Interactive Tool analysis of gene expression. The tool may be found at: http://webtools.mcdb.ucla.edu. (A) Enrichment of skin signaturess(Swindell, Johnston et al., 2013)Human Primary Cell Atlas, and ENCODE. (B and C) Heatmap of dermal papillae and dermal sheath signature genes (provided by Michael Rendl, personal communication) and TSNE of co-localized expression of two markers for each cell type.
Figure S3: Overrepresentation analysis of GO molecular functions by cluster genes. Significantly differentially expressed genes between clusters were defined as logFC>1 and adjusted p-value<0.05). Only enriched categories with an adjusted p-value <0.05 are shown. Overrepresentation analysis and visualization performed using ClusterProfiler R package.
Figure S4: Immunohistochemical confirmation of expression of proteins predicted by sc-RNA-seq. A, immunofluorescence for the same markers shown in Figure 3, but at lower magnification (5×). B, Immunostains were derived from the Human Protein Atlas (Uhlen, Fagerberg et al., 2015).


