

Abstract
Although a meta-analysis previously suggested a positive relationship between diabetes and intraocular pressure (IOP), the interrelationships among diabetes, IOP, and other ocular biometric parameters remain unclear. The present study investigated the relationships of diabetes, haemoglobin A1c (HbA1c), and serum glucose with IOP and ocular hypertension (IOP > 21 mmHg) in non-glaucomatous Japanese adults living in Chikusei City. Diabetes was defined as a self-reported history of diabetes, the use of antidiabetic medication, or HbA1c levels ≥6.5%. Among 6,786 enrolled participants aged 40 years and above, 734 were classified as diabetic (10.8%). After adjusting for several confounders, the IOP values were significantly higher in participants with diabetes than in those without diabetes (14.4 ± 0.1 vs. 13.9 ± 0.1 mmHg, P < 0.001) and were also significantly increased in those with elevated HbA1c and serum glucose levels (both P < 0.001). Moreover, diabetes was significantly related to ocular hypertension (multivariable-adjusted odds ratio, 1.75; 95% confidence interval, 1.09–2.81; P < 0.05). The positive influence of diabetes with ocular hypertension was consistent even after adjustment for central corneal thickness. In conclusion, diabetes, elevated HbA1c, and increased serum glucose are significant contributing factors for elevated IOP.
Subject terms: Glaucoma, Diabetes complications, Risk factors
Introduction
Over the past several decades, the prevalence of type 2 diabetes has increased markedly in Asian countries1, and patients with diabetes in these countries currently account for more than 60% of the global diabetic population2. Partly due to a marked change in dietary habits and lifestyle in Asia, type 2 diabetes has become a major public health burden, leading to substantial financial loss due to increased morbidity, mortality, and health care expenditures3. Diabetes is commonly accompanied by microvascular damage, which might contribute to numerous ocular complications, including elevated intraocular pressure (IOP)4–6 and subsequent glaucoma4,7–10, a leading cause of irreversible blindness worldwide11. According to a recent meta-analysis of 47 studies from 16 countries9, a history of diabetes was associated with an average increase of 0.18 mmHg (95% confidence interval [CI], 0.09–0.27) in IOP and a 48% increased relative risk for primary open-angle glaucoma (POAG) compared to the risk in nondiabetic patients.
The underlying mechanisms linking diabetes and elevated IOP have not been fully elucidated. Accumulating evidence suggests that a hyperglycaemic status may disrupt cell and repair functions in the cornea12–15, thus potentially affecting the central corneal thickness (CCT)16,17. Because IOP values rise by 0.11–1.00 mmHg per 10-μm increase in CCT18–20, it is plausible that a positive association between diabetes and high IOP may be partly attributable to a greater CCT in patients with diabetes. Nevertheless, many previous studies that examined the association between diabetes and IOP did not consider CCT measurements7,21–24, despite it being a plausible IOP regulating factor18–20.
Considerable evidence suggests that systemic and ocular biometric parameters are affected by genetic and environmental factors9,25–27. However, population-based studies of such factors in Asians are limited27–29. Specifically, in terms of IOP, Japanese adults may have unique characteristics compared to other populations: a relatively low IOP29–31 and a significant prevalence of normal-tension glaucoma (3.3–3.6%)32,33. The mean IOP in non-glaucomatous Japanese individuals (11.8–14.5 mmHg)29–31 was lower than that in Caucasians (17.2 mmHg)34 and other Asians, including Malays (15.3 mmHg)35 and Indians (15.8 mmHg)35. Since the suggested positive relationship between diabetes and IOP was largely based on research conducted in Western countries9, this relationship should be re-examined in East Asian populations. Furthermore, it is not clear whether diabetes is a CCT-independent cause of elevated IOPs or whether the observed positive association between diabetes and IOP is merely mediated by CCT increases. To the best of our knowledge, no study has investigated the interrelationships among diabetes, IOP, and CCT in a Japanese population.
Here, the influence of type 2 diabetes, serum glucose, and haemoglobin A1c (HbA1c, which is considered to reflect the average serum glucose level in the previous 2–3 months) levels on IOP was evaluated using a large body of data from ophthalmologically normal Japanese adults who participated in an epidemiological survey conducted in Chikusei City, Japan.
Results
Characteristics of systemic and ocular factors in participants with and without diabetes
Among the 6,786 enrolled participants (4,013 men and 2,773 women), 734 (10.8%; 292 men and 442 women) had diabetes. The mean age ± standard deviation (SD) was slightly higher in patients with diabetes (66.9 ± 7.8 years) than in participants without diabetes (63.3 ± 10.0 years, P < 0.001; Table 1). Individuals with diabetes were more likely to have a history of smoking; higher body mass index (BMI) and waist circumference; higher levels of HbA1c, non-fasting serum glucose, triglycerides, and IOP; and lower high-density lipoprotein cholesterol levels (Table 1). Figure 1 shows the IOP distribution according to the diabetic status. The mean IOP ± SD was 14.3 ± 2.8 mmHg for participants with diabetes and 13.9 ± 2.8 mmHg for those without diabetes (P < 0.001). The demographic breakdown of the IOP data from the participants in this study is presented in Supplementary Table S1. The mean IOP ± SD was 13.7 ± 2.8 mmHg in men and 14.1 ± 2.8 mmHg in women, and the IOP values were inversely correlated with age in both sexes.
Table 1.
Demographic, systemic, and ocular characteristics of the participants according to their diabetic statusa.
| Characteristics | Diabetes‡ (n = 734) | No diabetes (n = 6,052) | P-value |
|---|---|---|---|
| Demographic features | |||
| Mean age in years (SD)b | 66.9 (7.8) | 63.3 (10.0) | <0.001 |
| Male participants, n (%) | 292 (39.8) | 3,721 (61.5) | <0.001 |
| Body mass index, kg/m² (SD) | 24.6 (3.8) | 23.0 (3.2) | <0.001 |
| Waist circumference, cm (SD) | 78.1 (28.6) | 74.2 (25.9) | <0.001 |
| Weight, kg (SD) | 64.6 (13.1) | 57.0 (10.4) | <0.001 |
| Height, cm (SD) | 158.6 (10.3) | 157.0 (10.1) | <0.001 |
| Smoking status, n (%) | <0.001 | ||
| Never smokers | 36.5 | 24.2 | |
| Current smokers | 16.3 | 12.6 | |
| Alcohol intake, n (%) | 0.01 | ||
| <23 g/day | 56.0 | 58.3 | |
| 23 to <46 g/day | 14.0 | 16.4 | |
| ≥46 g/day | 30.0 | 25.2 | |
| Systemic features | |||
| Hypertension, n (%) | 57.2 | 44.9 | <0.001 |
| Systolic blood pressure, mmHg (SD) | 130.3 (17.1) | 125.1 (17.6) | <0.001 |
| Diastolic blood pressure, mmHg (SD) | 75.3 (11.1) | 74.6 (11.6) | 0.06 |
| HDL cholesterol, mg/dL (SD) | 56.4 (14.2) | 64.0 (15.8) | <0.001 |
| LDL cholesterol, mg/dL (SD) | 120.3 (32.6) | 125.9 (31.1) | <0.001 |
| Triglyceride, mg/dL (SD)c | 115.0 (77.9) | 95.0 (68.5) | <0.001 |
| HbA1c, % (SD)c | 6.7 (1.2) | 5.6 (0.3) | <0.001 |
| Participants with fasting glucose levels, n (%) | 452 (61.6) | 3,991 (66.0) | 0.02 |
| Fasting glucose, mg/dL (SD)d | 132.4 (33.3) | 96.3 (9.5) | <0.001 |
| Non-fasting glucose, mg/dL (SD)d | 138.2 (45.6) | 97.6 (13.1) | <0.001 |
| Ocular features | |||
| Central corneal thickness, µm (SD) | 554.3 (49.2) | 550.0 (59.3) | 0.16 |
| Intraocular pressure, mmHg (SD) | 14.3 (2.8) | 13.9 (2.8) | <0.001 |
| Ocular hypertension, n (%) | 24 (3.1) | 111 (1.9) | 0.01 |
aValues are presented as the means (SDs) for continuous variables and percentages for categorical variables.
bDiabetes was defined as self-reported antidiabetic medication use, physician-diagnosed diabetes, or HbA1c ≥ 6.5%.
bAll values other than age were adjusted for age and sex.
cFor triglycerides and HbA1c, medians (SDs) are presented.
dSerum glucose levels were examined in 2013–2016.
HbA1c, haemoglobin A1c; HDL, high-density lipoprotein; LDL, low-density lipoprotein; SD, standard deviation.
Figure 1.
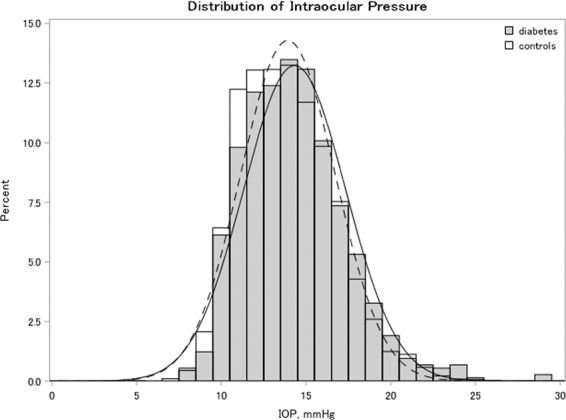
Intraocular pressure (IOP) distribution in the right eye of participants according to their diabetic status. The IOP distribution is indicated by white bars with a dotted line for controls and grey bars with a solid line for patients with diabetes.
Relationships of diabetes, haemoglobin A1c, and serum glucose with intraocular pressure
After adjusting for age, sex, and several lifestyle and metabolic factors, diabetes was significantly related to higher IOP values (mean IOP [±standard error, SE] in patients with diabetes vs. participants without diabetes: 14.4 ± 0.1 vs. 13.9 ± 0.1 mmHg, respectively, P < 0.001; Table 2). Similarly, individuals with higher serum HbA1c or serum glucose levels had elevated IOPs (P < 0.001). We confirmed these relationships after controlling for waist circumference, a good proxy for adiposity traits, instead of adjusting for BMI (data not shown), as well as in subgroup analyses by sex (data not shown). Additionally, we further adjusted the relationships for CCT and confirmed that the identified positive relationships of diabetes, serum HbA1c, and serum glucose with IOP were generally consistent.
Table 2.
Adjusted mean intraocular pressure by diabetes, HbA1c, and serum glucose.
| Characteristics | No. (%) | Mean intraocular pressure, mmHg (SE) | |||||
|---|---|---|---|---|---|---|---|
| Age- and sex-adjusted | P-value | Multivariable-adjusteda | P-value | Multivariable-adjustedb | P-value | ||
| Diabetesc | |||||||
| No | 6,052 (89.2) | 13.9 (0.1) | <0.001 | 13.9 (0.1) | <0.001 | 13.9 (0.1) | <0.001 |
| Yes | 734 (10.8) | 14.5 (0.1) | 14.4 (0.1) | 14.3 (0.1) | |||
| Serum HbA1c, % | |||||||
| <6.0% | 5,206 (76.7) | 13.9 (0.1) | <0.001 | 13.9 (0.1) | <0.001 | 13.8 (0.1) | <0.001 |
| ≥6.0% | 1,580 (23.3) | 14.3 (0.1) | 14.2 (0.1) | 14.1 (0.1) | |||
| Serum glucose, mg/dLd | |||||||
| Fasting <110 or non-fasting <140 | 5,282 (86.1) | 13.8 (0.1) | <0.001 | 13.8 (0.1) | <0.001 | 13.8 (0.1) | <0.001 |
| Fasting ≥ 110 or non-fasting ≥ 140 | 853 (13.9) | 14.6 (0.1) | 14.4 (0.1) | 14.4 (0.1) | |||
aAdjusted for age, sex, smoking status, alcohol intake, hypertension, and body mass index.
bAdjusted for age, sex, smoking status, alcohol intake, hypertension, body mass index, and central corneal thickness.
cDiabetes was defined as self-reported antidiabetic medication use, physician-diagnosed diabetes, or HbA1c ≥ 6.5%.
dSerum glucose data were only available between 2013–2016 for 6,135 samples out of 6,786 study participants in 2013–2017.
HbA1c, haemoglobin A1c; SE, standard error.
Relationships of diabetes, haemoglobin A1c, and serum glucose with ocular hypertension
Multivariable-adjusted logistic regression analyses showed that individuals with diabetes had an approximately two-fold higher prevalence of ocular hypertension than those without diabetes (multivariable-adjusted odds ratio [OR], 1.75; 95% CI, 1.09–2.81; P < 0.05; Table 3). Likewise, higher serum HbA1c (≥6.0%) and higher serum glucose (fasting ≥ 110 or non-fasting ≥ 140 mg/dL) levels were significantly related to ocular hypertension (multivariable-adjusted OR [95% CI] for HbA1c ≥ 6.0% vs. <6.0%: 1.47 [1.00–2.17], P < 0.05; for serum glucose with fasting levels ≥110 or non-fasting levels ≥140 mg/dL vs. fasting levels <110 or non-fasting levels <140 mg/dL: 1.80 [1.11–2.92], P < 0.05). Similar relationships were evident after controlling for CCT.
Table 3.
Multivariable logistic regression analyses of the relationships of ocular hypertension (intraocular pressure > 21 mmHg) with diabetes, HbA1c, and serum glucose.
| Characteristics | No. (%) | OR (95% CI) | ||
|---|---|---|---|---|
| Age- and sex-adjusted | Multivariable-adjusteda | Multivariable-adjustedb | ||
| Diabetesc | ||||
| No | 112 (1.9) | 1[Reference] | 1[Reference] | 1[Reference] |
| Yes | 23 (3.1) | 1.89 (1.19–3.02)‡ | 1.75 (1.09–2.81)† | 1.92 (1.13–3.28)† |
| Serum HbA1c, % | ||||
| <6.0% | 94 (1.8) | 1[Reference] | 1[Reference] | 1[Reference] |
| ≥6.0% | 41 (2.6) | 1.59 (1.09–2.32)† | 1.47 (1.00–2.17)† | 1.49 (0.95–2.32) |
| Serum glucose, mg/dLd | ||||
| Fasting <110 or non-fasting <140 | 81 (1.5) | 1[Reference] | 1[Reference] | 1[Reference] |
| Fasting ≥ 110 or non-fasting ≥ 140 | 24 (2.8) | 1.97 (1.22–3.17)‡ | 1.80 (1.11–2.92)† | 1.75 (1.07–2.87)† |
aAdjusted for age, sex, smoking status, alcohol intake, hypertension, and body mass index.
bAdjusted for age, sex, smoking status, alcohol intake, hypertension, body mass index, and central corneal thickness.
cDiabetes was defined as self-reported antidiabetic medication use, physician-diagnosed diabetes, or HbA1c ≥ 6.5%.
dSerum glucose data were only available between 2013–2016 for 6,135 samples out of 6,786 study participants in 2013–2017.
Test for significance: †P < 0.05, ‡P < 0.01.
CI, confidence interval; HbA1c, haemoglobin A1c; OR, odds ratio.
Discussion
This large Japanese population-based study assessed the relationships of diabetes, HbA1c, and serum glucose with IOP in non-glaucomatous individuals. After controlling for several possible confounders, the current study suggested that individuals with diabetes had significantly higher IOP than those without diabetes. Furthermore, patients with diabetes had an 80% increased prevalence of ocular hypertension compared to participants without diabetes, even after controlling for CCT measurements.
Consistent with a recent systematic review and meta-analysis9, the present results showed that a history of diabetes was related to both increased IOP and the presence of ocular hypertension. Earlier self-reported questionnaire-based studies showed a non-significant association between diabetes and high IOP36–39. In the present study, the positive relationship between poor glycaemic control, characterized by increased HbA1c or serum glucose levels, and high IOP was reaffirmed, in addition to the use of a questionnaire-based definition.
Accumulating evidence from epidemiological and animal studies suggests a causal link between hyperglycaemic status and increased IOP4,6,8,40,41; however, less is known about how excessive plasma glucose can elevate ocular tension in the anterior chamber. One conceivable explanation may involve the elevation of transforming growth factor (TGF)-β2 levels in the context of diabetes and the subsequent dysfunction of the trabecular meshwork, which reduces the outflow of the aqueous humour and elevates the IOP41. TGF-β may inhibit the proliferation and migration of trabecular cells42–44. Ochiai et al.45 and Min et al.46 reported increased levels of TGF-β2 in the aqueous humour and trabecular meshwork of eyes in individuals with diabetes. At least in mouse studies, human TGF-β2 decreased the aqueous outflow and increased the IOP41. Although future studies are warranted, high concentrations of TGF-β2 in diabetes may contribute to increased outflow resistance and elevated IOP. Another publication suggests the accumulation of advanced glycation end-products (AGEs) in trabecular meshwork cells in patients with diabetes47. Since increased levels of AGEs induce oxidative stress and apoptosis in human trabecular meshwork cells48,49, the impaired trabecular meshwork functions under these conditions may lead to an increased IOP50.
The present study provides evidence that the positive relationships between hyperglycaemic status and IOP were significant, even after controlling for CCT. Increases in CCT may lead to overestimated IOP values35,51,52, and diabetic patients have relatively greater CCTs due to the osmotic gradients induced by accumulated sorbitol in the cornea53. Accordingly, several studies have suggested that a greater CCT may mediate the association between higher glucose levels and elevated IOP10,54. In our current study, we tested the potential role of CCT as a mediator of diabetes and IOP. In the multiple linear regression analyses with diabetes predicting CCT (exposure-mediator) and with CCT predicting IOP (mediator-outcome), both relationships were statically significant (P < 0.05). Besides, the diabetes-IOP relationship was also significant after CCT adjustment, suggesting CCT as a partial mediator in our study population55,56. These findings are consistent with those of a previous study from Singapore reporting that a higher IOP in patients with diabetes was not primarily mediated by a greater CCT in these patients10. Therefore, controlling blood sugar in patients with diabetes is important to reduce future glaucoma susceptibility.
Nevertheless, the link between diabetes and POAG-related traits, including IOP, remains controversial in recent findings from genome-wide association studies57–59. Although Shiga et al. found a significant positive correlation between diabetes and POAG in a Japanese population57, another Japanese genetic study58 and a study in Europeans59 found no such association. Although genetic analyses are increasingly recognized as useful tools for providing unbiased estimates without confounding by reverse-causality or measurement errors, there are some non-genetic factors (i.e., impaired trabecular meshwork due to hyperglycaemia-induced inflammation or accumulation of AGEs) that possibly explain the link between diabetes and high IOP. Hence, additional large population-based studies examining the complex relationships among diabetes, CCT, and IOP in different ethnic groups are warranted.
This study had several limitations. First, the current findings are based on cross-sectional observations, which prevent the confirmation of causality between an increase or decrease in any of the parameters and changes in IOP. Although future longitudinal studies are warranted, studies assessing the interrelationships between diabetes and ocular biometric parameters, such as the current study, are noteworthy. Second, given that ocular hypertension is diagnosed by comprehensive ocular evaluations, including visual-field tests, the employed IOP measurement by non-contact pneumotonometry is not completely reflective of ocular hypertension. However, the mean IOP ± SD of 14.0 ± 2.8 mmHg in the present study was close to that of 14.5 mmHg in the Tajimi Study29, in which 3,021 non-glaucomatous individuals aged >40 years were subjected to Goldmann applanation tonometry. Furthermore, the use of Goldmann applanation tonometry may induce a larger amount of inter-investigator heterogeneity than encountered when using non-contact devices60. Generally, hospital-based studies, including detailed ocular investigations, may be hampered by selection bias and power issues. The present large population-based study reduced the effects of these caveats, although the results should still be interpreted cautiously. In addition, we did not include serum glucose levels in our definition of diabetes due to the unavailability of serum glucose levels in 2017. We acknowledge the possible underdiagnosis of diabetes and exposure misclassification. However, we conducted sensitivity analyses for the 2013–2016 participants using a diabetes definition that included serum glucose levels (≥200 mg/dL for non-fasting or ≥126 mg/dL for fasting serum glucose levels) and confirmed that the results were generally consistent (data not shown). Finally, the present data are restricted to a Japanese population, which might affect the generalizability. Nevertheless, the findings can be generally applied to other East Asian populations.
The strengths of our study include adequate power with substantial information on lifestyle and ocular parameters. The ophthalmic databases were rigorously evaluated by experienced ophthalmologists. In the current study, hyperglycaemic status was defined based on both self-reported questionnaires and laboratory data, including serum glucose and HbA1c, which should be more accurate than the data obtained only by self-reported patient information.
In conclusion, we found that diabetes and hyperglycaemia were significantly related to increased IOP among ophthalmologically healthy Japanese adults. This finding underscores the importance of appropriate glycaemic control to avoid IOP-related consequences in patients with diabetes.
Methods
Study population
The Japan Public Health Centre-based Prospective Study for the Next Generation (JPHC-NEXT) Eye Study is an ancillary investigation of an ongoing population-based study conducted under the protocol of the JPHC-NEXT Study61. Between 2013 and 2017, we performed a systemic and ophthalmological survey, as well as the JPHC-NEXT baseline surveillance in Chikusei City, located in central Japan, approximately 70 km north of Tokyo. All participants were asked about their socio-demographics, lifestyle factors (e.g., alcohol use or smoking status), medical history (e.g., history of diabetes or hypertension), ocular history (i.e., cataract surgery and refractive surgery), and medication use via interviews by trained technicians or via self-administered questionnaires. The health examination included anthropometry, blood pressure, laboratory measurements, and ocular examinations. Of the 9,940 individuals who agreed to participate in the ocular investigations and who were aged over 40 years, we excluded those who had a diagnosis of glaucoma or any history of IOP-lowering treatment (n = 490); a history of ocular laser treatment or surgery, including refractive or cataract surgeries, corneal oedema or dystrophy (n = 1,051); incomplete data on anthropometric or laboratory measurements (n = 1,022); or missing or outlying IOP measurements (n = 591). Thus, 4,013 males and 2,773 females were finally enrolled in this study.
Written informed consent was obtained from all individuals. The institutional review boards at Osaka University, Osaka; National Cancer Center, Tokyo; Keio University, Tokyo; and the University of Tsukuba, Ibaraki approved the study. This study adhered to the tenets of the Declaration of Helsinki and the laws of Chikusei City with respect to maintaining the privacy of the participants.
Systemic examination and exposure assessment
Anthropometric parameters, including waist circumference, weight, and height, were measured by trained technicians during the study. The BMI was calculated as weight (kg) divided by height (m) squared. Blood pressure was taken on the right upper arm twice by trained technicians with the participant in the sitting position, and the mean value of these two successive readings was utilized in this study. Blood samples were collected for measurements of serum glucose (fasting or non-fasting), HbA1c, and cholesterol concentrations. The fasting state was considered the state after a fasting duration of at least 10 h after the last meal. In 2017, serum glucose was excluded from the examination protocol. Hence, serum glucose data were available only from 2013–2016. Type 2 diabetes was defined as a self-reported history of physician-diagnosed diabetes, self-reported use of antidiabetic medication, or HbA1c levels ≥6.5%62,63. In accordance with the current guidelines from the Committee of the Japan Diabetes Society on the Diagnostic Criteria of Diabetes Mellitus63, the cut-off points of 6.0% for HbA1c, as well as <110 and <140 mg/dL for fasting and non-fasting serum glucose levels, respectively, were used.
Ocular examination and assessment of intraocular pressure
Standardised ocular examinations were performed by trained ophthalmologists. The IOP was determined by three successive readings of the right eye obtained by a non-contact tonometer (TonorefTM II; Nidek Co., Ltd., Tokyo, Japan). Ocular hypertension was defined as a right-eye IOP > 21 mmHg with no optic disc abnormalities, history of self-reported physician-diagnosed glaucoma, or use of any antiglaucoma therapy64. CCT was measured in the right eye using a specular-type pachymeter (Specular Microscope XIII; Konan, Nishinomiya, Japan).
Statistical analysis
Age- and sex-adjusted mean values for continuous variables and proportions for categorical variables were compared according to the participants’ diabetic status using regression analysis and logistic regression analysis, respectively. Analyses of covariance models were used to assess the relationships of mean IOP with diabetes, serum HbA1c, and serum glucose after adjusting for a priori known factors that affect IOP, including age (continuous), sex (male vs. female), smoking status (never, ex-smokers, or current smokers), alcohol intake (<23, 23 to <46, ≥46 g/day), hypertension (yes vs. no), and BMI (<25 vs. ≥25 kg/m2) in the primary multivariable model. Because CCT may mediate the relationship between hyperglycaemia and IOP, we additionally adjusted for CCT in the secondary model.
Multivariable logistic regression models were used after controlling for the same sets of confounders as stated above to analyse the relationships between the prevalence of ocular hypertension and diabetes, serum HbA1c, and serum glucose. The adjusted ORs and 95% CIs were calculated. All analyses were performed using SAS software (Version 9.4, SAS Institute, Cary, NC, USA). All P-values were two-sided, and a P-value of < 0.05 was considered statistically significant.
Supplementary information
Acknowledgements
We would like to thank the participants and staff of the Japan Public Health Center-based Prospective Study for the Next Generation (JPHC-NEXT) protocol for their valuable contributions. The authors assume full responsibility for analyses and interpretation of these data. This work was supported by the National Cancer Centre Research and Development Fund (since 2011) and a Grant-in-Aid for Cancer Research from the Ministry of Health, Labour and Welfare of Japan (from 1989 to 2010) and JSPS KAKENHI grant [JP16K11271 to K.Yu.]. K.Yu. was also supported by a 2015 Novartis Research Grant.
Author contributions
Design of the study: A.H. and N.S.; Study conduct: A.H.; Collection, management, analysis, and interpretation of the data: A.H., N.S., K.Yu., M.U., Y.O., M.S., K.Ya., H.I., K.T. and S.T.; and Preparation, review and final approval of the manuscript: A.H., N.S., K.Yu., M.U., Y.O., M.S., K.Ya., H.I., K.T. and S.T. All authors reviewed the manuscript and approved the final version.
Data availability
For information on how to submit an application for gaining access to JPHC-NEXT data and/or biospecimens, please follow the instructions at https://epi.ncc.go.jp/jphcnext/en/access/index.html.
Competing interests
The authors declare no competing interests.
Footnotes
Publisher’s note Springer Nature remains neutral with regard to jurisdictional claims in published maps and institutional affiliations.
Contributor Information
Norie Sawada, Email: nsawada@ncc.go.jp.
Kenya Yuki, Email: yukikenya114@gmail.com.
Supplementary information
is available for this paper at 10.1038/s41598-020-62135-3.
References
- 1.Chan JCN, et al. Diabetes in Asia: Epidemiology, risk factors, and pathophysiology. JAMA. 2009;301:2129–2140. doi: 10.1001/jama.2009.726. [DOI] [PubMed] [Google Scholar]
- 2.Malik VS, Willett WC, Hu FB. Global obesity: Trends, risk factors and policy implications. Nat. Rev. Endocrinol. 2013;9:13–27. doi: 10.1038/nrendo.2012.199. [DOI] [PubMed] [Google Scholar]
- 3.Bommer C, et al. Global economic burden of diabetes in adults: Projections from 2015 to 2030. Diabetes Care. 2018;41:963–970. doi: 10.2337/dc17-1962. [DOI] [PubMed] [Google Scholar]
- 4.Dielemans I, et al. Primary open-angle glaucoma, intraocular pressure, and diabetes mellitus in the general elderly population. The Rotterdam Study. Ophthalmology. 1996;103:1271–1275. doi: 10.1016/S0161-6420(96)30511-3. [DOI] [PubMed] [Google Scholar]
- 5.Sahin A, Bayer A, Ozge G, Mumcuoğlu T. Corneal biomechanical changes in diabetes mellitus and their influence on intraocular pressure measurements. Invest. Ophthalmol. Vis. Sci. 2009;50:4597–4604. doi: 10.1167/iovs.08-2763. [DOI] [PubMed] [Google Scholar]
- 6.Pimentel LGM, Gracitelli CPB, da Silva LSC, Souza AKS, Prata TS. Association between glucose levels and intraocular pressure: Pre- and postprandial analysis in diabetic and nondiabetic patients. J. Ophthalmol. 2015;2015:832058. doi: 10.1155/2015/832058. [DOI] [PMC free article] [PubMed] [Google Scholar]
- 7.Mitchell P, Smith W, Chey T, Healey PR. Open-angle glaucoma and diabetes: the Blue Mountains eye study, Australia. Ophthalmology. 1997;104:712–718. doi: 10.1016/S0161-6420(97)30247-4. [DOI] [PubMed] [Google Scholar]
- 8.Tan GS, Wong TY, Fong C-W, Aung T. Diabetes, metabolic abnormalities, and glaucoma. Arch. Ophthalmol. 2009;127:1354–1361. doi: 10.1001/archophthalmol.2009.268. [DOI] [PubMed] [Google Scholar]
- 9.Zhao D, Cho J, Kim MH, Friedman DS, Guallar E. Diabetes, fasting glucose, and the risk of glaucoma: a meta-analysis. Ophthalmology. 2015;122:72–78. doi: 10.1016/j.ophtha.2014.07.051. [DOI] [PubMed] [Google Scholar]
- 10.Luo X-Y, et al. Direct and indirect associations between diabetes and intraocular pressure: The Singapore Epidemiology of Eye Diseases Study. Invest. Ophthalmol. Vis. Sci. 2018;59:2205–2211. doi: 10.1167/iovs.17-23013. [DOI] [PubMed] [Google Scholar]
- 11.Quigley HA, Broman AT. The number of people with glaucoma worldwide in 2010 and 2020. Br. J. Ophthalmol. 2006;90:262–267. doi: 10.1136/bjo.2005.081224. [DOI] [PMC free article] [PubMed] [Google Scholar]
- 12.Cavallerano J. Ocular manifestations of diabetes mellitus. Optom. Clin. 1992;2:93–116. [PubMed] [Google Scholar]
- 13.Didenko TN, Smoliakova GP, Sorokin EL, Egorov VV. [Clinical and pathogenetic features of neurotrophic corneal disorders in diabetes] Vestn. Oftalmol. 1999;115:7–11. [PubMed] [Google Scholar]
- 14.Hallberg CK, Trocme SD, Ansari NH. Acceleration of corneal wound healing in diabetic rats by the antioxidant Trolox. Res. Commun. Mol. Pathol. Pharmacol. 1996;93:3–12. [PubMed] [Google Scholar]
- 15.Kabosova A, et al. Human diabetic corneas preserve wound healing, basement membrane, integrin and MMP-10 differences from normal corneas in organ culture. Exp. Eye Res. 2003;77:211–217. doi: 10.1016/S0014-4835(03)00111-8. [DOI] [PMC free article] [PubMed] [Google Scholar]
- 16.Lee JS, Oum BS, Choi HY, Lee JE, Cho BM. Differences in corneal thickness and corneal endothelium related to duration in diabetes. Eye (Lond.) 2006;20:315–318. doi: 10.1038/sj.eye.6701868. [DOI] [PubMed] [Google Scholar]
- 17.Rehany U, Ishii Y, Lahav M, Rumelt S. Ultrastructural changes in corneas of diabetic patients: an electron-microscopy study. Cornea. 2000;19:534–538. doi: 10.1097/00003226-200007000-00026. [DOI] [PubMed] [Google Scholar]
- 18.Shah S, et al. Relationship between corneal thickness and measured intraocular pressure in a general ophthalmology clinic. Ophthalmology. 1999;106:2154–2160. doi: 10.1016/S0161-6420(99)90498-0. [DOI] [PubMed] [Google Scholar]
- 19.Doughty MJ, Zaman ML. Human corneal thickness and its impact on intraocular pressure measures: a review and meta-analysis approach. Surv. Ophthalmol. 2000;44:367–408. doi: 10.1016/S0039-6257(00)00110-7. [DOI] [PubMed] [Google Scholar]
- 20.Shah S. Accurate intraocular pressure measurement-the myth of modern ophthalmology? Ophthalmology. 2000;107:1805–1807. doi: 10.1016/S0161-6420(00)00383-3. [DOI] [PubMed] [Google Scholar]
- 21.Wu SY, Leske MC. Associations with intraocular pressure in the Barbados Eye Study. Arch. Ophthalmol. 1997;115:1572–1576. doi: 10.1001/archopht.1997.01100160742012. [DOI] [PubMed] [Google Scholar]
- 22.Son J, Koh H, Son J. The association between intraocular pressure and different combination of metabolic syndrome components. BMC Ophthalmol. 2016;16:76. doi: 10.1186/s12886-016-0263-8. [DOI] [PMC free article] [PubMed] [Google Scholar]
- 23.Wu C-J, et al. Postprandial glucose as a risk factor for elevated intraocular pressure. PLoS One. 2016;11:e0168142. doi: 10.1371/journal.pone.0168142. [DOI] [PMC free article] [PubMed] [Google Scholar]
- 24.Cohen E, Kramer M, Shochat T, Goldberg E, Krause I. Relationship between serum glucose levels and intraocular pressure: A population-based cross-sectional study. J. Glaucoma. 2017;26:652–656. doi: 10.1097/IJG.0000000000000700. [DOI] [PubMed] [Google Scholar]
- 25.Coleman AL, Miglior S. Risk factors for glaucoma onset and progression. Surv. Ophthalmol. 2008;53:S3–S10. doi: 10.1016/j.survophthal.2008.08.006. [DOI] [PubMed] [Google Scholar]
- 26.Al Owaifeer AM, Al Taisan AA. The role of diet in glaucoma: A review of the current evidence. Ophthalmol. Ther. 2018;7:19–31. doi: 10.1007/s40123-018-0120-3. [DOI] [PMC free article] [PubMed] [Google Scholar]
- 27.Wang YX, Xu L, Wei WB, Jonas JB. Intraocular pressure and its normal range adjusted for ocular and systemic parameters. The Beijing Eye Study 2011. PLoS One. 2018;13:e0196926. doi: 10.1371/journal.pone.0196926. [DOI] [PMC free article] [PubMed] [Google Scholar]
- 28.Foster PJ, et al. Central corneal thickness and intraocular pressure in a Mongolian population. Ophthalmology. 1998;105:969–973. doi: 10.1016/S0161-6420(98)96021-3. [DOI] [PubMed] [Google Scholar]
- 29.Kawase K, Tomidokoro A, Araie M, Iwase A, Yamamoto T. Ocular and systemic factors related to intraocular pressure in Japanese adults: the Tajimi study. Br. J. Ophthalmol. 2008;92:1175–1179. doi: 10.1136/bjo.2007.128819. [DOI] [PubMed] [Google Scholar]
- 30.Shiose Y, et al. Epidemiology of glaucoma in Japan—A nationwide glaucoma survey. Jpn. J. Ophthalmol. 1991;35:133–155. [PubMed] [Google Scholar]
- 31.Nomura H, Shimokata H, Ando F, Miyake Y, Kuzuya F. Age-related changes in intraocular pressure in a large Japanese population: a cross-sectional and longitudinal study. Ophthalmology. 1999;106:2016–2022. doi: 10.1016/S0161-6420(99)90417-7. [DOI] [PubMed] [Google Scholar]
- 32.Iwase A, et al. The prevalence of primary open-angle glaucoma in Japanese: The Tajimi Study. Ophthalmology. 2004;111:1641–1648. doi: 10.1016/j.ophtha.2004.03.029. [DOI] [PubMed] [Google Scholar]
- 33.Yamamoto S, et al. Primary open-angle glaucoma in a population associated with high prevalence of primary angle-closure glaucoma: The Kumejima Study. Ophthalmology. 2014;121:1558–1565. doi: 10.1016/j.ophtha.2014.03.003. [DOI] [PubMed] [Google Scholar]
- 34.Sommer A, et al. Relationship between intraocular pressure and primary open angle glaucoma among white and black Americans. The Baltimore Eye Survey. Arch. Ophthalmol. 1991;109:1090–1095. doi: 10.1001/archopht.1991.01080080050026. [DOI] [PubMed] [Google Scholar]
- 35.Chua J, et al. Ethnic differences of intraocular pressure and central corneal thickness: The Singapore Epidemiology of Eye Diseases study. Ophthalmology. 2014;121:2013–2022. doi: 10.1016/j.ophtha.2014.04.041. [DOI] [PubMed] [Google Scholar]
- 36.Tielsch JM, Katz J, Quigley HA, Javitt JC, Sommer A. Diabetes, intraocular pressure, and primary open-angle glaucoma in the Baltimore Eye Survey. Ophthalmology. 1995;102:48–53. doi: 10.1016/S0161-6420(95)31055-X. [DOI] [PubMed] [Google Scholar]
- 37.de Voogd S, et al. Is diabetes mellitus a risk factor for open-angle glaucoma? The Rotterdam Study. Ophthalmology. 2006;113:1827–1831. doi: 10.1016/j.ophtha.2006.03.063. [DOI] [PubMed] [Google Scholar]
- 38.Goldich Y, et al. Effect of diabetes mellitus on biomechanical parameters of the cornea. J. Cataract Refract. Surg. 2009;35:715–719. doi: 10.1016/j.jcrs.2008.12.013. [DOI] [PubMed] [Google Scholar]
- 39.Shoshani Y, et al. Impaired ocular blood flow regulation in patients with open-angle glaucoma and diabetes. Clin. Exp. Ophthalmol. 2012;40:697–705. doi: 10.1111/j.1442-9071.2012.02778.x. [DOI] [PubMed] [Google Scholar]
- 40.Oh SW, Lee S, Park C, Kim DJ. Elevated intraocular pressure is associated with insulin resistance and metabolic syndrome. Diabetes Metab. Res. Rev. 2005;21:434–440. doi: 10.1002/dmrr.529. [DOI] [PubMed] [Google Scholar]
- 41.Shepard AR, et al. Adenoviral gene transfer of active human transforming growth factor-β2 elevates intraocular pressure and reduces outflow facility in rodent eyes. Invest. Ophthalmol. Vis. Sci. 2010;51:2067–2076. doi: 10.1167/iovs.09-4567. [DOI] [PubMed] [Google Scholar]
- 42.Wordinger RJ, et al. Cultured human trabecular meshwork cells express functional growth factor receptors. Invest. Ophthalmol. Vis. Sci. 1998;39:1575–1589. [PubMed] [Google Scholar]
- 43.Gottanka J, Chan D, Eichhorn M, Lütjen-Drecoll E, Ethier CR. Effects of TGF-β2 in perfused human eyes. Invest. Ophthalmol. Vis. Sci. 2004;45:153–158. doi: 10.1167/iovs.03-0796. [DOI] [PubMed] [Google Scholar]
- 44.Fleenor DL, et al. TGFβ2-induced changes in human trabecular meshwork: implications for intraocular pressure. Invest. Ophthalmol. Vis. Sci. 2006;47:226–234. doi: 10.1167/iovs.05-1060. [DOI] [PubMed] [Google Scholar]
- 45.Ochiai Y, Ochiai H. Higher concentration of transforming growth factor-β in aqueous humor of glaucomatous eyes and diabetic eyes. Jpn. J. Ophthalmol. 2002;46:249–253. doi: 10.1016/S0021-5155(01)00523-8. [DOI] [PubMed] [Google Scholar]
- 46.Min SH, Lee T-I, Chung YS, Kim HK. Transforming growth factor-β levels in human aqueous humor of glaucomatous, diabetic and uveitic eyes. Korean J. Ophthalmol. 2006;20:162–165. doi: 10.3341/kjo.2006.20.3.162. [DOI] [PMC free article] [PubMed] [Google Scholar]
- 47.Park CH, Kim JW. Effect of advanced glycation end products on oxidative stress and senescence of trabecular meshwork cells. Korean J. Ophthalmol. 2012;26:123–131. doi: 10.3341/kjo.2012.26.2.123. [DOI] [PMC free article] [PubMed] [Google Scholar]
- 48.Schmidt AM, et al. Cellular receptors for advanced glycation end products. Implications for induction of oxidant stress and cellular dysfunction in the pathogenesis of vascular lesions. Arterioscler. Thromb. 1994;14:1521–1528. doi: 10.1161/01.ATV.14.10.1521. [DOI] [PubMed] [Google Scholar]
- 49.Ramasamy R, et al. Advanced glycation end products and RAGE: a common thread in aging, diabetes, neurodegeneration, and inflammation. Glycobiology. 2005;15:16R–28R. doi: 10.1093/glycob/cwi053. [DOI] [PubMed] [Google Scholar]
- 50.Tektas O-Y, Lütjen-Drecoll E. Structural changes of the trabecular meshwork in different kinds of glaucoma. Exp. Eye Res. 2009;88:769–775. doi: 10.1016/j.exer.2008.11.025. [DOI] [PubMed] [Google Scholar]
- 51.Janićijević-Petrović MA, et al. Evaluation of central corneal thickness in patients with ocular hypertension and primary open-angle glaucoma. Med. Glas. (Zenica). 2014;11:115–119. [PubMed] [Google Scholar]
- 52.Wei W, et al. Correlation analysis between central corneal thickness and intraocular pressure in juveniles in Northern China: The Jinan City eye study. PLoS One. 2014;9:e104842. doi: 10.1371/journal.pone.0104842. [DOI] [PMC free article] [PubMed] [Google Scholar]
- 53.Choo M, et al. Corneal changes in type II diabetes mellitus in Malaysia. Int. J. Ophthalmol. 2010;3:234–236. doi: 10.3980/j.issn.2222-3959.2010.03.12. [DOI] [PMC free article] [PubMed] [Google Scholar]
- 54.Su DHW, et al. Diabetes, hyperglycemia, and central corneal thickness: the Singapore Malay Eye Study. Ophthalmology. 2008;115:964–968.e1. doi: 10.1016/j.ophtha.2007.08.021. [DOI] [PubMed] [Google Scholar]
- 55.Baron RM, Kenny DA. The moderator-mediator variable distinction in social psychological research: conceptual, strategic, and statistical considerations. J. Pers. Soc. Psychol. 1986;51:1173–1182. doi: 10.1037/0022-3514.51.6.1173. [DOI] [PubMed] [Google Scholar]
- 56.MacKinnon DP, Fairchild AJ, Fritz MS. Mediation analysis. Annu. Rev. Psychol. 2007;58:593–614. doi: 10.1146/annurev.psych.58.110405.085542. [DOI] [PMC free article] [PubMed] [Google Scholar]
- 57.Shiga Y, et al. Genome-wide association study identifies seven novel susceptibility loci for primary open-angle glaucoma. Hum. Mol. Genet. 2018;27:1486–1496. doi: 10.1093/hmg/ddy053. [DOI] [PMC free article] [PubMed] [Google Scholar]
- 58.Kanai M, et al. Genetic analysis of quantitative traits in the Japanese population links cell types to complex human diseases. Nat. Genet. 2018;50:390–400. doi: 10.1038/s41588-018-0047-6. [DOI] [PubMed] [Google Scholar]
- 59.Laville V, et al. Genetic correlations between diabetes and glaucoma: An analysis of continuous and dichotomous phenotypes. Am. J. Ophthalmol. 2019;206:245–255. doi: 10.1016/j.ajo.2019.05.015. [DOI] [PMC free article] [PubMed] [Google Scholar]
- 60.Burr JM, et al. Surveillance for ocular hypertension: An evidence synthesis and economic evaluation. Health Technol. Assess. 2012;16:1–271. doi: 10.3310/hta16290. [DOI] [PMC free article] [PubMed] [Google Scholar]
- 61.Sawada N, et al. The Japan Public Health Center-based Prospective Study for the Next Generation (JPHC-NEXT): Study design and participants. J. Epidemiol. 2019;30:46–54. doi: 10.2188/jea.JE20180182. [DOI] [PMC free article] [PubMed] [Google Scholar]
- 62.Alberti KG, Zimmet PZ. Definition, diagnosis and classification of diabetes mellitus and its complications. Part 1: diagnosis and classification of diabetes mellitus provisional report of a WHO consultation. Diabet. Med. 1998;15:539–553. doi: 10.1002/(SICI)1096-9136(199807)15:7<539::AID-DIA668>3.0.CO;2-S. [DOI] [PubMed] [Google Scholar]
- 63.Seino Y, et al. Report of the expert committee on the classification and diagnostic criteria of diabetes mellitus. J. Diabetes Investig. 2010;1:212–228. doi: 10.1111/j.2040-1124.2010.00074.x. [DOI] [PMC free article] [PubMed] [Google Scholar]
- 64.Tielsch JM, Katz J, Sommer A, Quigley HA, Javitt JC. Hypertension, perfusion pressure, and primary open-angle glaucoma. A population-based assessment. Arch. Ophthalmol. 1995;113:216–221. doi: 10.1001/archopht.1995.01100020100038. [DOI] [PubMed] [Google Scholar]
Associated Data
This section collects any data citations, data availability statements, or supplementary materials included in this article.
Supplementary Materials
Data Availability Statement
For information on how to submit an application for gaining access to JPHC-NEXT data and/or biospecimens, please follow the instructions at https://epi.ncc.go.jp/jphcnext/en/access/index.html.