

Abstract
In typical visual working memory tasks participants report the color of a previously studied item at some probed location. Alternatively, in some recent studies a color is probed and participants must report the item’s location. There is a surprising difference between these tasks: in location reports participants almost never guess randomly as they do when reporting color, but often incorrectly report the locations of non-probed items. This finding has been taken as evidence for feature binding errors in memory, and evidence against discrete capacity models which predict that pure guessing should occur. We test an alternative possibility: that non-target responses are guesses, but intelligent ones. In particular, when asked to report the location of an item for which participants have no memory, they may guess near locations where they know something was presented. Here we present false-probe trials in which a color is probed that was not actually studied, and find that the responses, which are necessarily guesses, are nonetheless centered around studied locations. Moreover, we find that the confidence ratings for non-target responses are low, and similar to confidence for uniformly distributed guesses. In a second experiment we find that manipulating the retention interval, which is known to affect guess rates, changes the rate of these low-confidence non-target responses. These results suggest that the tendency to report locations of non-probed items reflects a good guessing strategy; not something fundamental about how features and objects are represented in working memory.
Keywords: Discrete Capacity, Visual Working Memory, Confidence Ratings
In a common test of visual working memory participants view an array of colored items, and after a brief delay a location cue prompts them to report the color of an item (Wilken & Ma, 2004). Results from this task are often taken as evidence for discrete capacity models of visual working memory, in which items are either stored in memory with high precision or are completely absent from memory (Zhang & Luck, 2008). Accurate performance on this task requires memory for color, location, and the binding between color and location. It therefore seems reasonable that similar results should be obtained if, instead of probing a location and asking for the color, a color is shown at test and participants must report the that item’s location. However, recent studies have identified a striking difference between these tasks: whereas color reports primarily follow a mixture of accurate in-memory responses and uniformly distributed random guesses, location reports primarily follow a mixture of accurate responses and responses that are clustered around non-target item locations. The preponderance of these non-target location responses, often called “swap errors”, has been interpreted as evidence that memory for location is different than memory for other features (Rajsic & Wilson, 2014), that location memory can not be described by discrete capacity models which predict random guessing (Schneegans & Bays, 2016), and that all forgetting in visual working memory reflects a failure in binding an item’s features with its location (Pertzov, Dong, Peich, & Husain, 2012).
Here we suggest instead that the prevalence of non-target location reports reflects a guessing strategy, rather than anything interesting about working memory. For example, consider an extreme case in which all study items are located on the left side of the display. Even if you have no memory of the color probed at test, you would almost surely respond somewhere on the left side of the screen. In the modeling approaches which have been used to differentiate uniform random guessing from non-target responding (Bays, Catalao, & Husain, 2009), such intelligent guessing would be identified as non-target responding, since responses are closer to non-target items than is predicted by uniform guessing. Whereas current models can estimate the rate of non-target responding, they can not identify whether these responses arise for interesting reasons, such as binding errors, or non-memory processes such as guessing strategies.
There is some evidence to suggest such a guessing strategy in location reports. Rajsic & Wilson (2014) showed that presenting non-target items at test eliminated non-target responses, and suggest that this effect may imply that presenting non-targets allowed their locations to be ruled out as good guesses. However, there are other possible explanations for why presenting non-targets at test might reduce non-target responses, such as helping participants to correct binding errors, or to more accurately determine which color is being probed. Here we directly test whether non-target location reports reflect an informed guessing strategy. Experiment 1 was a location report task, but on some trials the probed color was not one of the studied colors (Province & Rouder, 2012). On these trials participants are necessarily guessing, and we examine whether responses are nonetheless centered around study locations. In addition, confidence ratings were collected (e.g., Rademaker, Tredway, & Tong, 2012) and a joint-modeling approach was developed to determine whether non-target location responses have high confidence, which would suggest that they reflect something about memory, or have low confidence suggesting that they are guesses.
Experiment 1
Method
Participants.
Sixty-one students at Mississippi State University participated in Experiment 1 in exchange for course credit. All experiments were approved by the Mississippi State University Institutional Review Board.
Stimuli & Design.
Figure 1 illustrates the structure of a trial. Eight filled circles (0.4° radius) were presented for 200 ms in discriminable colors that were randomly selected from 10 possible colors. The items were positioned along an invisible circle (4° radius), with the restriction that they were separated by at least 22° radial angle (1.5° visual angle). Following a retention interval (1000 ms), a colored circle at fixation probed participants to report the previous location of that item. The probe color was chosen randomly from all 10 possible colors, such that on approximately 20% of trials the probe color was not one of the studied colors, termed a false-probe trial. After a 500 ms probe period a response annulus was shown centered around the invisible circle on which stimuli had been presented (±.5°). Participants used the computer mouse to report the angular location of the probed item. Following the location response a rectangle was shown labeled “Low Confidence” to the left and “High Confidence” to the right. Participants clicked within this region to denote their confidence in the accuracy of their location report.
Figure 1.
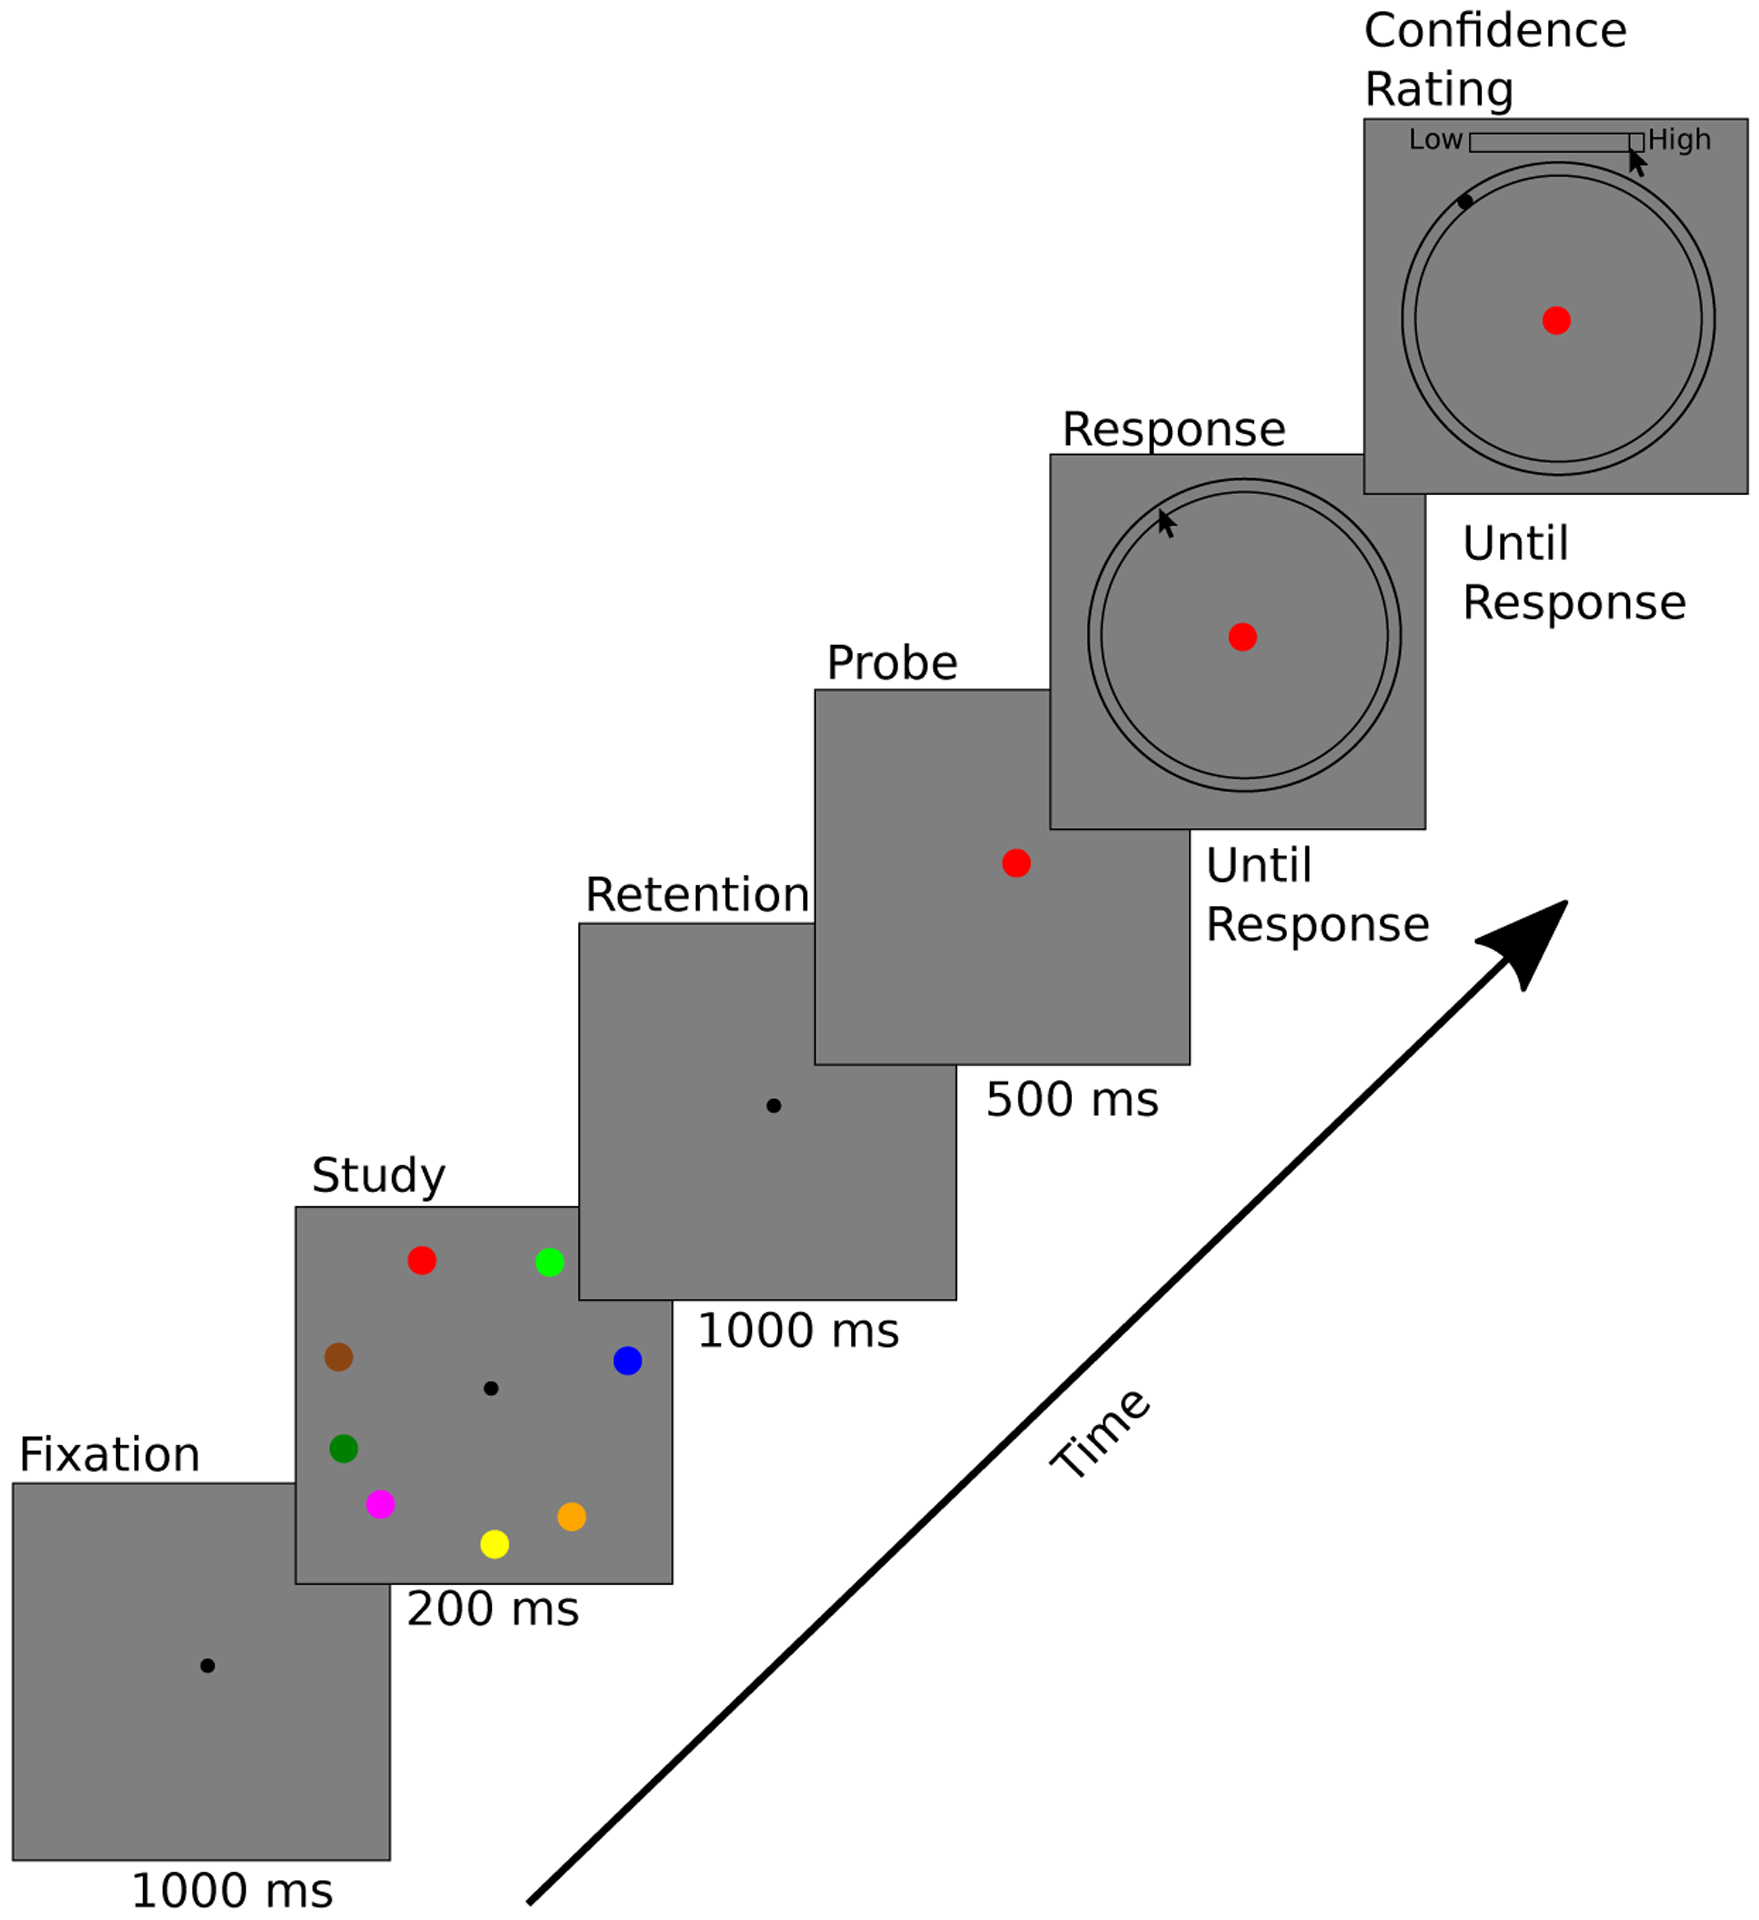
Structure of a trial in Experiment 1. In this valid trial the probe is one of the 8 studied colors. In the false-probe trials the probe would be one of the two colors not shown in the study array.
Each participant completed 20 practice trials, followed by 500 experimental trials (102 of which were false-probe trials). Participants were not informed of the false-probe trials before the experiment. Stimulus locations and colors were chosen randomly for each trial. However, trial parameters and their order were identical across participants.
Results
Figure 2 shows responses on four representative trials. Colored circles in the surround show the locations and colors of each studied item; the central circle shows the color of the test probe. The locations of diamonds denote location responses of each participant; their color indicates the corresponding confidence rating. The top panels show typical legitimate-probe trials: Some participants responded near the target location and did so with relatively high confidence, while others responded at locations far from the target items and did so with low confidence. Although these inaccurate low-confidence responses are sometimes far from the target location, they are almost always clustered around non-target locations. This pattern of non-target responding replicates previous findings, however, the corresponding low confidence ratings suggest that participants do not believe that they are accurately identifying the location of the probed color when making these responses.
Figure 2.
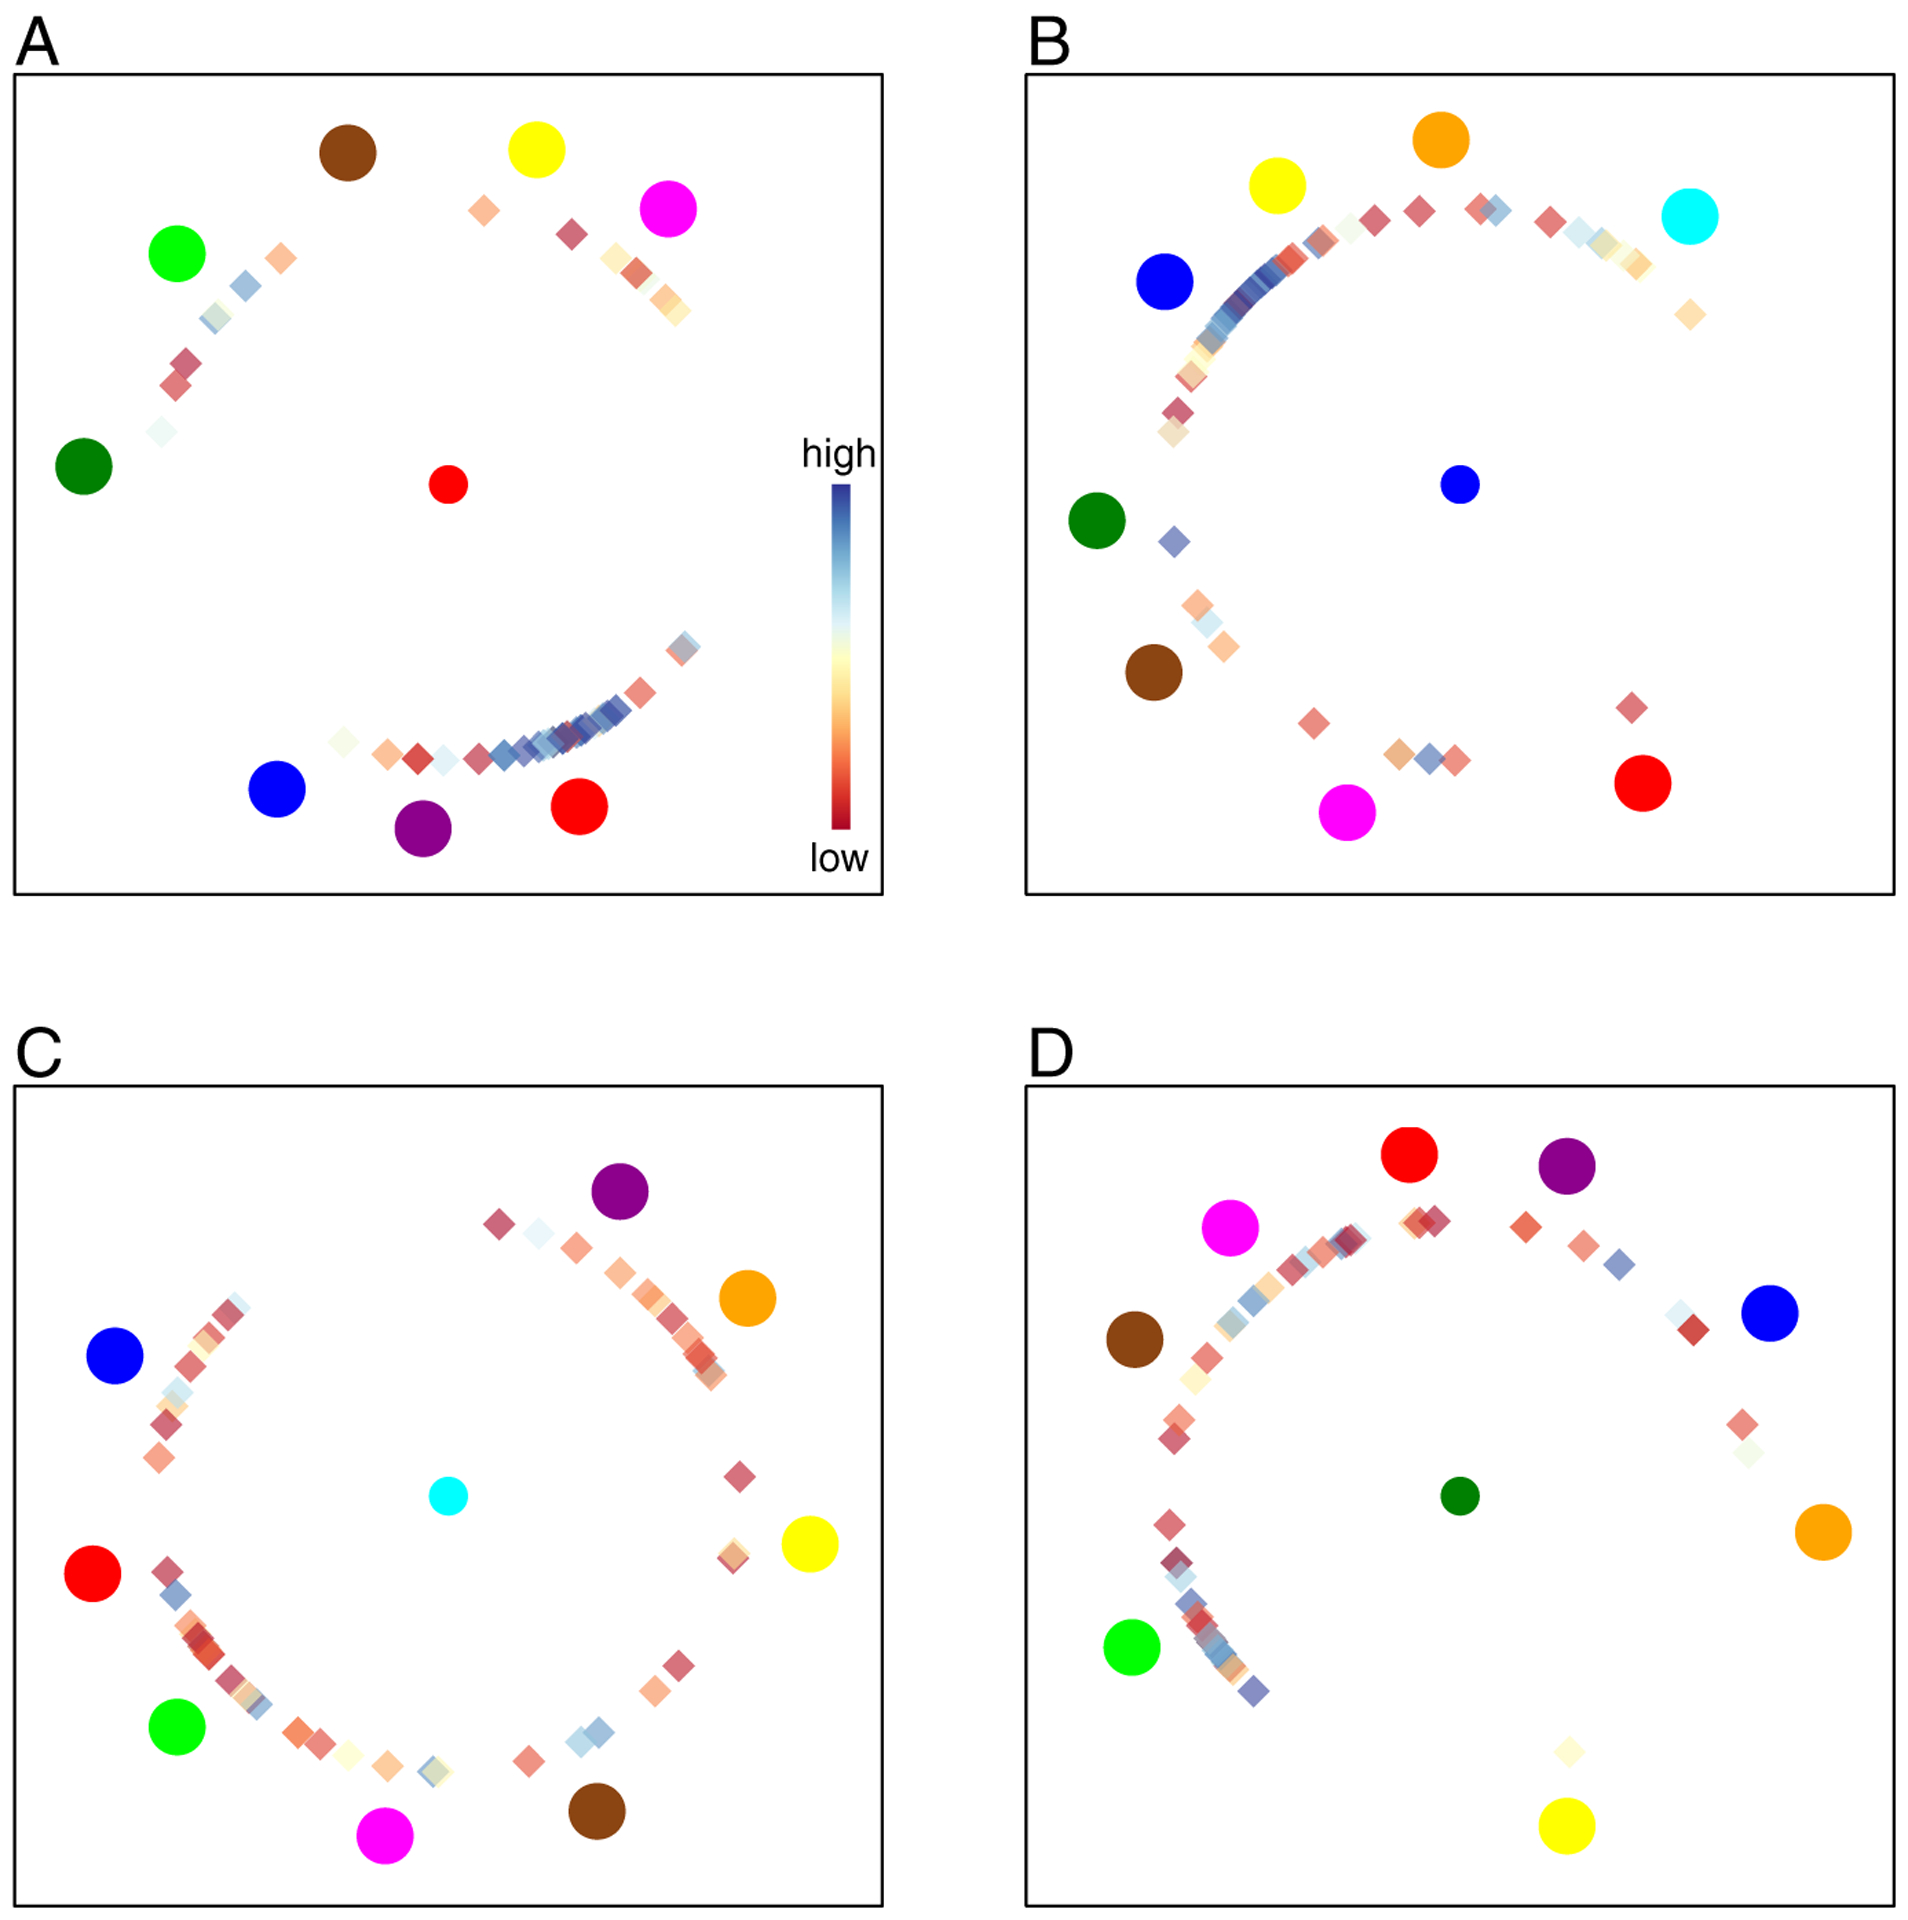
Stimuli and responses for four trials in Experiment 1. Colored circles in the surround denote the colors and locations of studied items. The color at fixation denotes the color probed at test. The angular location of each diamond denotes a participant’s location response, and the color of the diamond show the corresponding confidence rating (color scale shown in panel A). Top panels show legitimate-probe trials; bottom panels show false-probe trials.
The bottom panels of Figure 2 show false-probe trials. Responses on these trials are necessarily guesses, and confidence is generally low as expected. Nonetheless, these guesses are largely non-target responses, with almost no responses in regions that did not contain study items. To test whether responses on false-probe trials were centered around non-targets, we computed the minimum distance between each response and the nearest non-target location, and the minimum distance between a uniformly distributed response and its nearest non-target. Responses were found to be significantly closer to non-target items than expected under uniform guessing for 61 out of 61 participants (t-tests, p<.05), suggesting that guessing near non-target locations is a general strategy in this task.
A joint model of location reports and confidence.
Confidence ratings have been shown to track working memory performance, suggesting that people have accurate meta-knowledge of their memory accuracy (Rademaker et al., 2012; van den Berg, Yoo, & Ma, 2017). Therefore, if confidence ratings for non-target responses are low, similar to confidence for uniform guesses, then they are informed guesses. Alternatively, if confidence for non-target responses is high, similar to confidence for in-memory responses, then they may reflect a memory process. A joint model of response errors and confidence ratings was developed (see also van den Berg et al., 2017) in order to estimate the rates of high- and low-confidence non-target responses. The model is based on the discrete capacity model of working memory that includes non-target responses (Bays et al., 2009), and assumes that responses arise from a mixture of the four processes shown in Figure 3. Location responses from memory follow a von Mises distribution centered on the studied location, non-target responses follow a mixture of von Mises distributions centered at non-target locations with the same precision as in-memory responses, and guesses follow a uniform distribution. Confidence ratings are modeled as logit-normal distributions, a common approach for modeling variables that are constrained to be between zero and one. In-memory and high-confidence non-target responses follow one distribution, while uniform guesses and low-confidence non-target responses follow another. The model is estimated for each participant using standard maximum likelihood procedures, providing estimates of the contribution of the four processes (see Supplement for details).
Figure 3.

Joint model of response errors (left) and corresponding confidence ratings (right). Confidence distributions are constrained to be the same for in-memory and high-confidence non-target responses (blue). Confidence distributions for low-confidence non-target responses and uniform guesses (red) are constrained to be the same. In Experiment 1 false-probe trials can only arise from one of the non-memory processes.
Figure 4 shows distributions of response errors and confidence ratings for three participants. Scatter plots show the joint distribution of location errors and confidence ratings, demonstrating that confidence ratings are typically higher when memory errors are small. Lines overlaid on the marginal histograms denote model predictions, and suggest that the joint mixture model provides for a reasonable account of both location errors and confidence ratings. Figure 5A shows the average estimated rates of the four response types. Less than half of the legitimate-probe responses are identified as being from memory, however only 23% of the remaining trials are identified as non-target responses made with high confidence. Instead, 77% of non-memory responses are either uniform guesses or non-target responses that are accompanied by the same low confidence as uniform guesses.
Figure 4.

Response errors and confidence ratings for three participants in Experiment 1. Scatter plots show the joint distribution of confidence rating as a function of response error on legitimate-probe trials. Marginal distributions of response error and confidence are shown in the top and right margins, respectively, with model predictions overlaid as lines. For confidence ratings distributions the positive axis (blue) shows confidence distributions for legitimate-probe trials; the negative axis (red) shows confidence distributions for false-probe trials. Although the shape of confidence distributions differs markedly across participants, the mixture model is largely able to capture this variability.
Figure 5.

Estimated proportions of the four response types. Rates are shown for A) Experiment 1 which had a 1000 ms retention interval, B) The 500 ms retention interval condition in Experiment 2, and C) The 50 ms retention interval condition in Experiment 2. The results are highly similar if participants are excluded who may not have used the confidence ratings effectively (see Supplementary Figure S1).
High confidence non-target responses.
Although high-confidence non-target responses are infrequent, it is interesting to examine why they might occur. For example, they may be actual binding errors between colors and locations (Pertzov et al., 2012). Alternatively, some pairs of colors may be perceptually similar such that when probed with a color like dark-green, participants mistakenly report the location of the light-green object due to noise in color memory (Bays, 2016; Emrich & Ferber, 2012). In order to examine these possibilities we fit the same joint model as above, but using a Bayesian model estimation technique that provides the probability that each response arose from the four possible response types (see Supplement). We can therefore identify responses that were likely to be high-confidence non-target responses and examine the stimulus characteristics of these trials.
We first identified the 1000 trials that were most likely to have been from each of the response processes. We then calculated which of the 8 stimulus locations was nearest to the participant’s location response on each trial, and compared the color of that item with the probe color. Figure 6A shows the result for in-memory responses, and as expected the color of the item nearest to the reported location is the probed color. Figure 6B shows low-confidence non-target trials. Here the color of the reported item is largely evenly distributed relative to the probed color, which is expected if these low-confidence non-target reports are guesses (see also Figure 2). Alternatively, Figure 6C shows high-confidence non-target trials, and there is a clear pattern: The color of the reported item is often perceptually similar to the color of the probe. For example, when the probe was dark green participants often responded nearest the location of the light green study item. Similarly, purple and magenta are often confused, as are yellow and orange, both relatively bright colors. About one third of these 1000 high-confidence non-target responses are from the false-probe condition, suggesting that even when there is no correct answer participants sometimes report the location of a study item that had a similar color as the probe, and do so with high confidence (e.g. Figure 2D).
Figure 6.

Color confusions in Experiment 1. Each panel is comprised of the 1000 trials most likely to reflect in memory responses (A), low-confidence non-target responses (B), or high-confidence non-target responses (C). Shading denotes the proportion of these trials on which the probed item was the color indicated on the x-axis, and the location response was nearest to the item with the color shown on the y-axis (scale shown in panel A).
Discussion
The results of Experiment 1 suggest that the majority of non-target location responses are guesses. In Experiment 2 we test a prediction of this interpretation: manipulations which affect the rate of guessing should primarily affect the rate of low-confidence non-target responses. Although guess rates are often manipulated by varying set size, we worry that varying set size may also affect guessing strategies. For example, more items in a study array will change the density with which items are located, potentially influencing whether participants adopt a non-target response guessing strategy. Fortunately, guess rate was also recently shown to increase with memory retention interval, whereas precision changes very little (Pratte, 2018). In Experiment 2 manipulating the memory retention interval provides a way to explore how changes in guess rate manifest as changes in the four responses types, without changing stimulus properties.
Experiment 2
Method
Participants.
One hundred and seven participants completed Experiment 2 in exchange for course credit.
Stimuli & Design.
Experiment 2 was similar to Experiment 1 with the following exceptions. There were no false-probe trials. The time between study display offset and probe onset was either 50 ms or 500 ms. Each participant completed 200 trials at each retention interval, randomized across the experiment.
Results
Figure 7 shows location errors aggregated over participants for the 50 ms (A) and 500 ms (B) conditions. Whereas both distributions have a punctuate peak, increasing the retention interval caused a marked increase in mass in the long tails of the distribution. Confidence ratings for a representative participant are shown for the 50 ms (C) and 500 ms (D) conditions, and suggest that retention interval affects the proportion of high- and low-confidence responses, but not the shape of the confidence distributions. The joint mixture model was fit by allowing the rates of the four response types and memory precision to vary across retention interval conditions, but the distributions of confidence ratings were fixed across retention intervals. Figures 5B and 5C show the average proportion of each response type for each retention interval. Performance for the 1000 ms condition in Experiment 1 is similar to that for the 500 ms condition in Experiment 2, suggesting that the 500 ms condition largely reflects working memory. However, reducing the retention interval from 500 to 50 ms in Experiment 2 had a marked effect on the probability that an item is stored in memory (t(106)=21.29, p<.001), suggesting a substantial contribution of iconic memory in the 50 ms condition. Critically, the corresponding increase in non-memory responses is driven almost entirely by an increase in low-confidence non-target responses (t(106)=13.42, p<.001), with no significant difference in uniform guessing (t(106)=1.08, p=.28) or high-confidence non-target responses (t(106)=0.01, p=.99).
Figure 7.
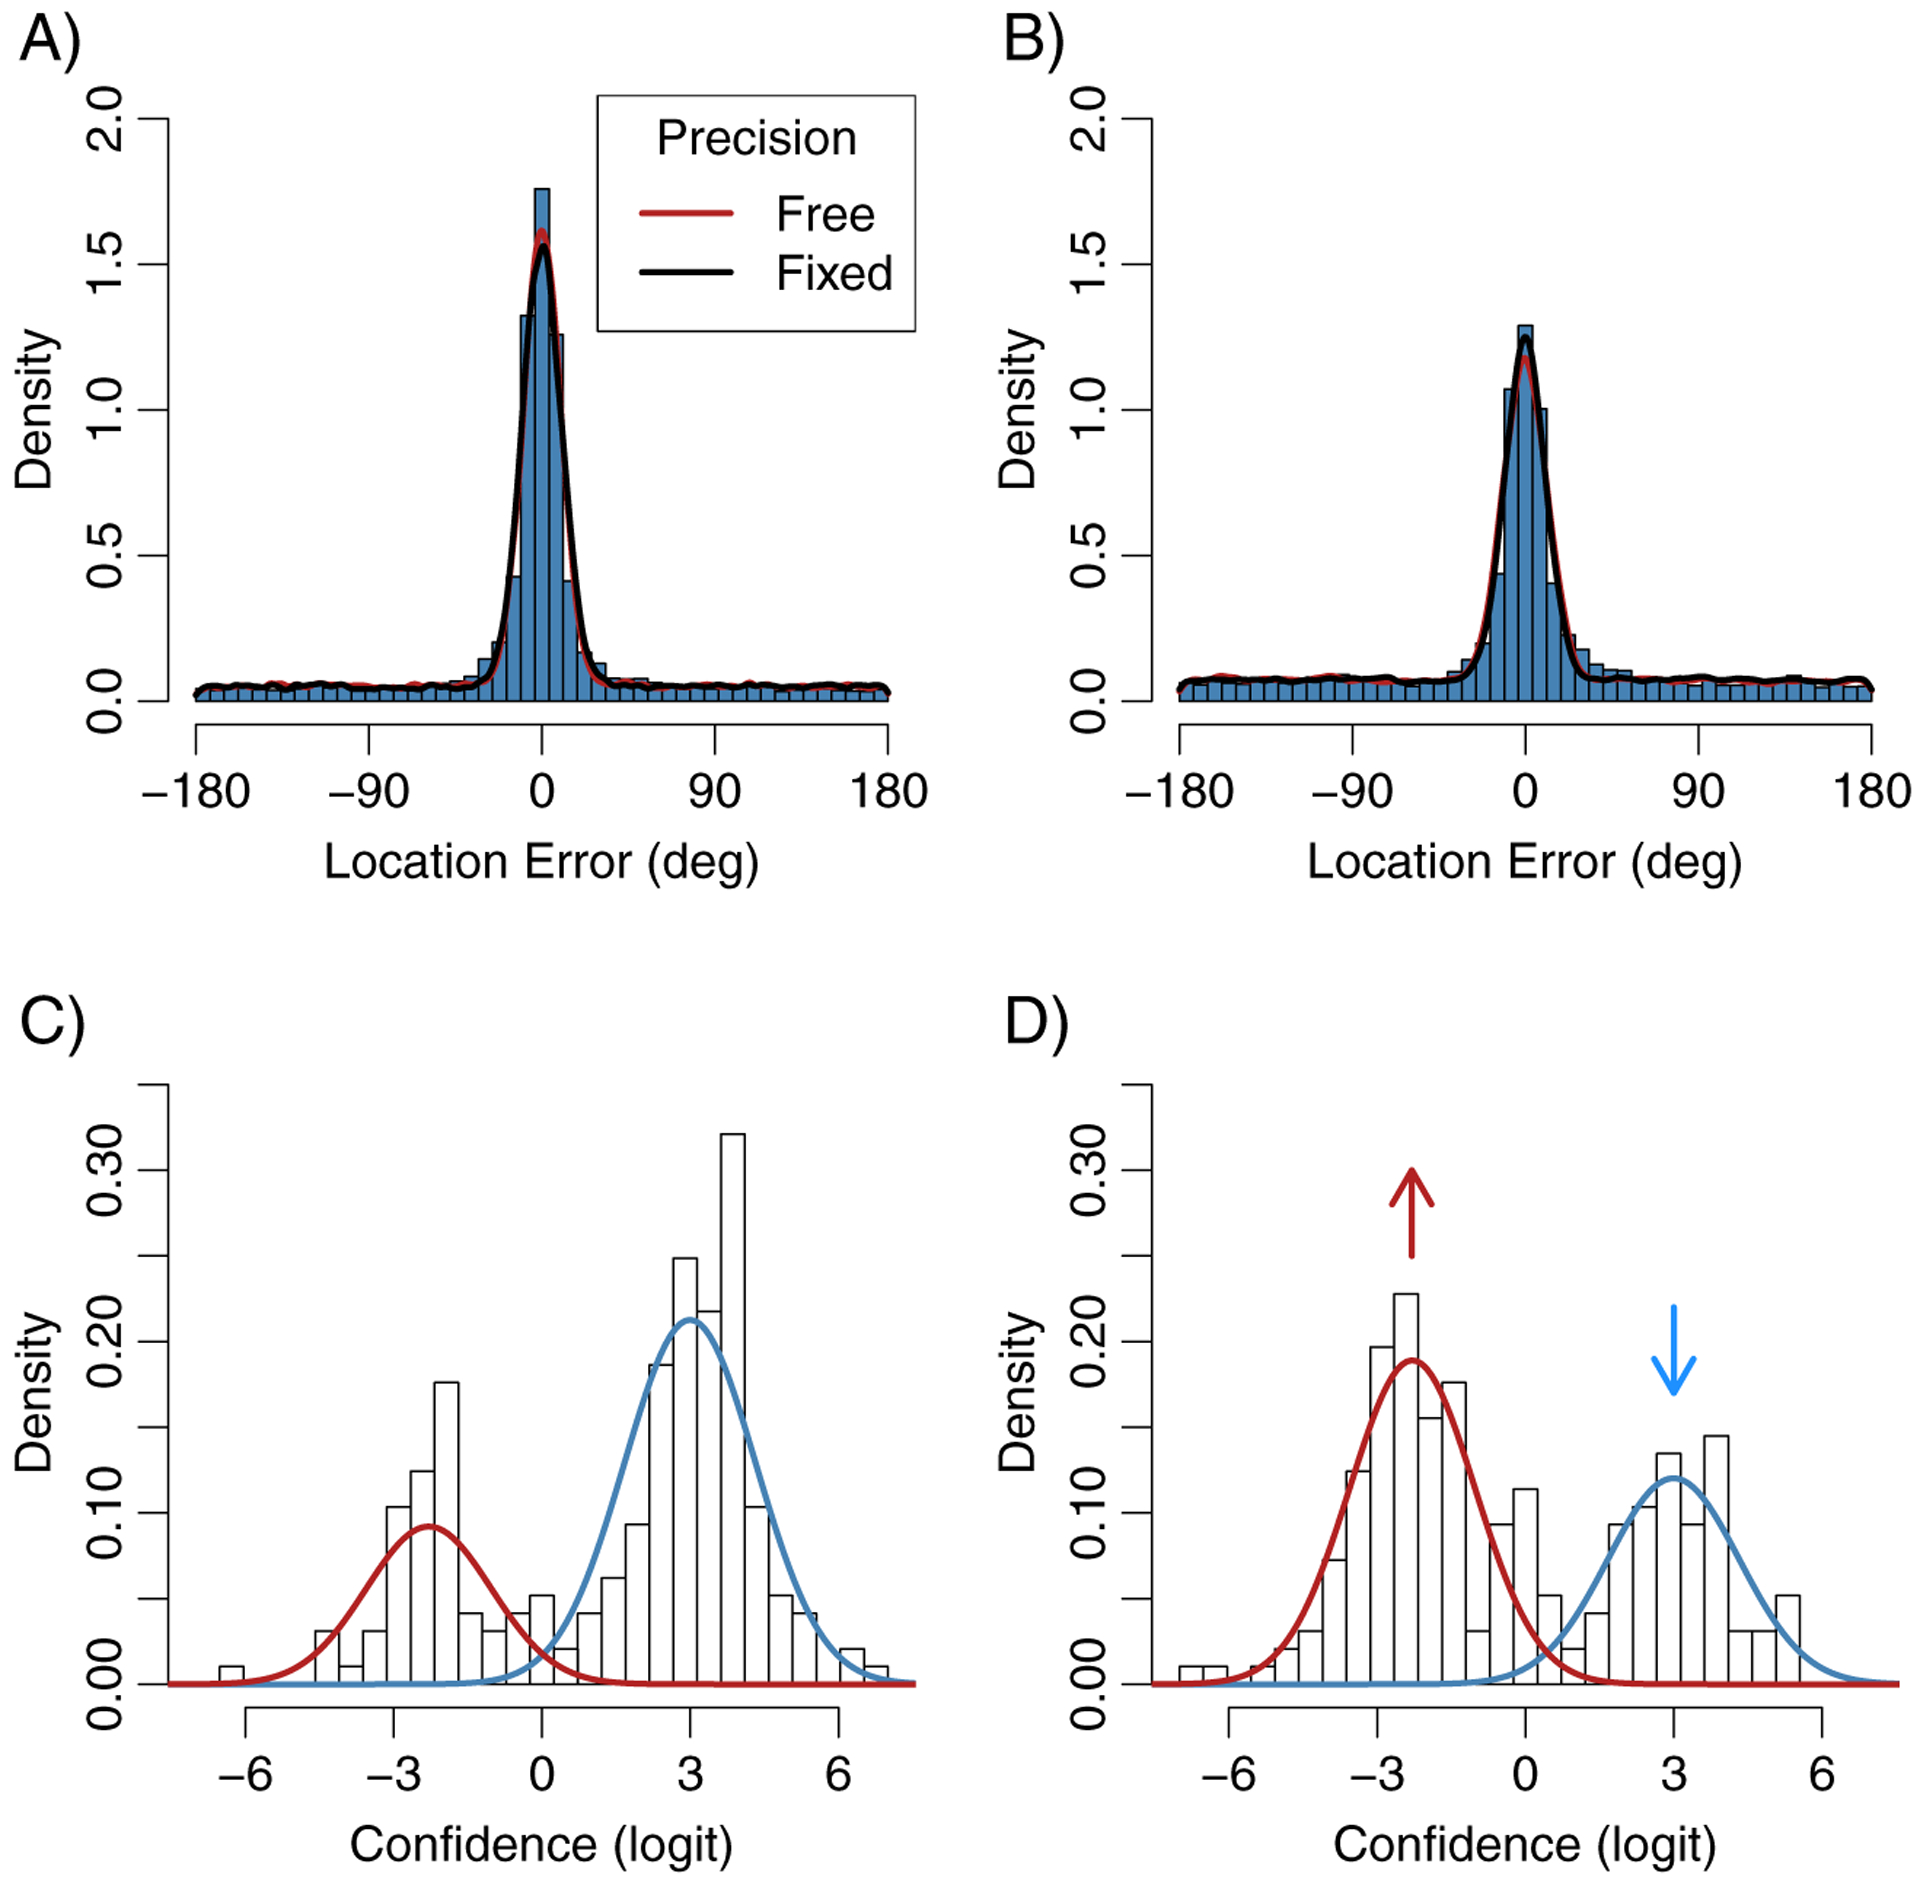
Results from Experiment 2. Top panels show memory errors aggregated over participants for the 50 ms (A) and 500 ms (B) retention intervals. Lines are from swap model fits to the aggregated error data in which precision is either free to vary across retention interval conditions (red) or is fixed to be identical across conditions (black). Aggregating the error data produces small distortions relative to any individual’s data, such as exaggerated peakedness. However, because confidence ratings vary substantially in shape across participants, the confidence distribution averaged over participants does not at all resemble those of individuals. The bottom panels therefore show confidence ratings for a representative participant for the 50 ms (C) and 500 ms (D) conditions. Ratings have been logit-transformed, and on this space the model predicts mixtures of normally distributed low (red) and high (blue) confidence ratings that change only in their relative proportion across conditions (see Supplement).
In swap models the precision parameter is necessarily fixed for in-memory and non-target response distributions. Consequently, it is impossible to know whether differences in precision estimates reflect changes in memory precision, or differences in non-target responding. Precision did decrease significantly with retention interval in Experiment 2 (t(106) = 5.66, p<.001). However, the magnitude of this effect was extremely small compared with the effect on the rate of in-memory responses. For example, the lines in Figures 7A and B show that a model with precision fixed across conditions fits the error data remarkably well. Moreover, in a simulation study we found that if the only effect is the observed change in in-memory rate across conditions, a non-parametric test identifies the resulting distributions as significantly different in 99.5% of simulations. Alternatively, if only precision changes by the amount observed, the result is significant in only 16.6% of simulations (see Supplement). These results suggest that memory precision or the precision of swap errors varies with retention interval, but only marginally.
General Discussion
Whereas swap errors can account for a portion of non-memory responses on color-report tasks (e.g. Bays et al., 2009; van den Berg, Awh, & Ma, 2014), here we replicate the finding that they comprise almost all non-memory responses in location-report tasks. However, whereas these responses are typically assumed to reflect something about working memory, our results suggest that they instead reflect a guessing strategy. First, the same non-target responding was observed on false-probe trials, on which participants were necessarily guessing. Second, confidence ratings were typically high when responses were centered around targets, but were similarly low for both uniform guesses and the majority of non-target responses, suggesting that subjects know that these non-target responses do not reflect accurate memories. Finally, shortening the retention interval, which has been shown to primarily decrease guessing (Pratte, 2018), increased in-memory responses with a corresponding decrease in the rate of low-confidence non-target responses.
If low-confidence non-target responses are considered guesses, then working memory capacity for locations (4.5 items in Experiment 1) is similar to capacity estimates for a myriad of other visual and non-visual stimuli (Cowan, 2001; Luck & Vogel, 2013). We also observed some high-confidence non-target responses, occurring primarily when responses were near an item that had a color similar to the probe. It has been suggested that such probe confusions account for swap errors in color working memory tasks, such that participants mistake the location probe as corresponding to the wrong item (Bays et al., 2009; Emrich & Ferber, 2012). However, it is also possible that swap errors in color memory tasks are guesses: if the color of a probed item is unknown, a reasonable strategy is to respond with whatever color you have in mind. If multiple non-targets are in mind, people may choose the color of the item closest to the probed location, making such guesses look like probe confusion errors. Although swap errors are far less frequent in color report tasks, the tools used here may prove useful for examining their cause.
The rate of uniform guessing was not affected by the manipulation of retention interval, suggesting that these responses may reflect a different process than what causes low-confidence non-target responses, such as complete attentional lapses (Rouder et al., 2008). Another possibility is that these responses actually are non-target responses, but the non-target distribution was not estimated to be as wide as it should be, causing some non-target responses to be incorrectly classified as uniform guesses. For example, although swap models specify that precision is identical for in-memory and non-target responses, it is likely that responses from an informed guessing strategy are more widely distributed around non-targets than are in-memory responses to targets. Such possibilities make it difficult to interpret precision estimates from swap models, as manipulations that might alter informed guessing strategies may produce effects in precision that do not reflect memory processes (c.f. Schneegans & Bays, 2016). Hopefully, richer paradigms and further model development will make it possible to separate memory precision from swap-error precision.
There may be important differences between memory for space and memory for other visual features, however, studying these differences requires taking into account potential differences in non-memory processes such as guessing strategy. Here we have taken a step toward doing so by jointly modeling response errors and confidence ratings. There are many ways that this simple model might be improved, such as by accounting for stimulus-driven item effects (Pratte, Park, Rademaker, & Tong, 2017), how sources of trial-to-trial variability affect response precision (van den Berg et al., 2014) and confidence (van den Berg et al., 2017), and how categorical encoding might affect color memory (Hardman, Vergauwe, & Ricker, 2017). Moreover, whereas the goal of our modeling was to separate high- from low-confidence non-target responses, some participant’s confidence ratings appear to be more complex then is predicted by the simple mixture model (e.g. right panel in Figure 4). Likewise, distributions other than the von Mises may more accurately characterize response-error and swap-error distributions (Bays, 2016). Developing new experimental paradigms and building better models that can capture the data more accurately will allow for the interesting aspects of working memory, such as binding errors, to be studied without contamination from non-memory processes, such as guessing strategies.
Supplementary Material
Acknowledgments
We are grateful to Hali Palmer and Conne George for assistance with data collection. This work was supported by NIH NIMH grant R15MH113075-01.
References
- Bays PM (2016). Evaluating and excluding swap errors in analogue tests of working memory. Scientific Reports, 6. doi: 10.1038/srep19203 [DOI] [PMC free article] [PubMed] [Google Scholar]
- Bays PM, Catalao RFG, & Husain M (2009). The precision of visual working memory is set by allocation of a shared resource. Journal of Vision, 9 (10), 7–7. doi: 10.1167/9.10.7 [DOI] [PMC free article] [PubMed] [Google Scholar]
- Cowan N (2001). The magical number 4 in short term memory. A reconsideration of storage capacity. Behavioral and Brain Sciences, 24 (4), 87–186. doi: 10.1017/S0140525X01003922. arXiv: 0140–525X [DOI] [PubMed] [Google Scholar]
- Emrich SM & Ferber S (2012). Competition increases binding errors in visual working memory. Journal of Vision, 12 (4), 12–12. doi: 10.1167/12.4.12 [DOI] [PubMed] [Google Scholar]
- Hardman KO, Vergauwe E, & Ricker TJ (2017). Categorical working memory representations are used in delayed estimation of continuous colors. Journal of Experimental Psychology: Human Perception and Performance, 43 (1), 30–54. doi: 10.1037/xhp0000290 [DOI] [PMC free article] [PubMed] [Google Scholar]
- Luck SJ & Vogel EK (2013). Visual working memory capacity: From psychophysics and neurobiology to individual differences. Trends in Cognitive Sciences, 17 (8), 391–400. doi: 10.1016/j.tics.2013.06.006 [DOI] [PMC free article] [PubMed] [Google Scholar]
- Pertzov Y, Dong MY, Peich MC, & Husain M (2012). Forgetting What Was Where: The Fragility of Object-Location Binding. PLoS ONE, 7 (10). doi: 10.1371/journal.pone.0048214 [DOI] [PMC free article] [PubMed] [Google Scholar]
- Pratte MS (2018). Iconic Memories Die a Sudden Death. Psychological Science, 29 (6), 877–887. doi: 10.1177/0956797617747118 [DOI] [PMC free article] [PubMed] [Google Scholar]
- Pratte MS, Park YE, Rademaker RL, & Tong F (2017). Accounting for stimulus-specific variation in precision reveals a discrete capacity limit in visual working memory. Journal of Experimental Psychology: Human Perception and Performance, 43 (1), 6–17. doi: 10.1037/xhp0000302 [DOI] [PMC free article] [PubMed] [Google Scholar]
- Province JM & Rouder JN (2012). Evidence for discrete-state processing in recognition memory. Proceedings of the National Academy of Sciences, 109 (36), 14357–14362. doi: 10.1073/pnas.1103880109 [DOI] [PMC free article] [PubMed] [Google Scholar]
- Rademaker RL, Tredway CH, & Tong F (2012). Introspective judgments predict the precision and likelihood of successful maintenance of visual working memory. Journal of vision, 12 (13), 21. doi: 10.1167/12.13.21 [DOI] [PMC free article] [PubMed] [Google Scholar]
- Rajsic J & Wilson DE (2014). Asymmetrical access to color and location in visual working memory. Attention, Perception, and Psychophysics, 76 (7), 1902–1913. doi: 10.3758/s13414-014-0723-2 [DOI] [PubMed] [Google Scholar]
- Rouder JN, Morey RD, Cowan N, Zwilling CE, Morey CC, & Pratte MS (2008). An assessment of fixed-capacity models of visual working memory. Proceedings of the National Academy of Sciences of the United States of America, 105 (16), 5975–9. doi: 10.1073/pnas.0711295105 [DOI] [PMC free article] [PubMed] [Google Scholar]
- Schneegans S & Bays PM (2016). No fixed item limit in visuospatial working memory. Cortex, 83, 181–193. doi: 10.1016/j.cortex.2016.07.021 [DOI] [PMC free article] [PubMed] [Google Scholar]
- van den Berg R, Awh E, & Ma WJ (2014). Factorial comparison of working memory models. Psychological Review, 121 (1), 124–49. doi: 10.1037/a0035234. arXiv: NIHMS150003 [DOI] [PMC free article] [PubMed] [Google Scholar]
- van den Berg R, Yoo AH, & Ma WJ (2017). Fechner’s law in metacognition: A quantitative model of visual working memory confidence. Psychological Review,124 (2), 197–214. doi: 10.1037/rev0000060 [DOI] [PMC free article] [PubMed] [Google Scholar]
- Wilken P & Ma WJ (2004). A detection theory account of change detection. Journal of Vision, 4 (12), 11. doi: 10.1167/4.12.11 [DOI] [PubMed] [Google Scholar]
- Zhang W & Luck SJ (2008). Discrete fixed-resolution representations in visual working memory. Nature, 453 (7192), 233–U13. doi:Doi 10.1038/Nature06860 [DOI] [PMC free article] [PubMed] [Google Scholar]
Associated Data
This section collects any data citations, data availability statements, or supplementary materials included in this article.