

Abstract
In this paper, a novel 3D graphical representation of DNA sequence based on trinucleotides is proposed. This representation allows direct inspection of composition as well as distribution of trinucleotides in DNA sequence for the first time and avoids loss of information, from which one can obtain more information. Based on this novel model, six numerical descriptors of DNA sequence are deduced without complicated calculations, and the applications in similarities/dissimilarities analysis of coding sequences and conserved genes discrimination illustrate their utilities. In addition, two simple methods for similarities/dissimilarities analysis of coding sequences among different species are exploited by using two vectors composed of 64 and six components, respectively, which can provide convenient sequence alignment tools for both computational scientists and molecular biologists.
Keywords: Numerical descriptor, Similarity/dissimilarity analysis, Projection, Coding sequence
1. Introduction
Developments of sequencing technologies cause the number of biological sequences increasing exponentially in databases. However, it is difficult to obtain information directly from the primary sequences. Then mathematical analysis of the large volume of sequences data becomes one of the challenges for bio-scientists. Using graphical approaches to study biological problems can provide intuitive picture or useful insights for helping analyzing complicated relations in these systems, as demonstrated by many previous studies on a series of important biological topics, such as enzyme-catalyzed reactions (Andraos, 2008; Chou, 1981, Chou, 1989; Chou and Forsen, 1980; Chou and Liu, 1981; Myers and Palmer, 1985), protein folding kinetics (Chou, 1990), inhibition kinetics of processive nucleic acid polymerases and nucleases (Althaus et al., 1993a, Althaus et al., 1993b, Althaus et al., 1993c), analysis of codon usage (Chou and Zhang, 1992; Zhang and Chou, 1993, Zhang and Chou, 1994), base frequencies in the antisense strands (Chou et al., 1996). Moreover, graphical methods have been introduced for QSAR study (Gonzalez-Diaz et al., 2006, Gonzalez-Diaz et al., 2007b; Prado-Prado et al., 2008) and for dealing with complicated network systems (Diao et al., 2007; Gonzalez-Diaz et al., 2007a, Gonzalez-Diaz et al., 2008). Recently, the images of cellular automata (Wolfram, 1984) were also used to represent biological sequences (Xiao et al., 2005a) for predicting protein structural classes (Xiao et al., 2008) and subcellular location (Xiao et al., 2006b), identifying G-protein-coupled receptor functional classes (Xiao et al., 2009), investigating HBV virus gene missense mutation (Xiao et al., 2005b) and HBV viral infections (Xiao et al., 2006a), as well as visually analyzing SARS-CoV (Gao et al., 2006; Wang et al., 2005). In this study, we attempted to propose a different 3D graphical representation for DNA sequences in hopes to provide a useful tool for the relevant areas.
Since Hamori and Ruskin (1983) first proposed a 3D graphical representation, some different graphical approaches have been reported for DNA sequences. Zhang and Zhang, 1991, Zhang and Zhang, 1994 create Z curve to represent DNA sequences in a 3D space. It demonstrates that Z curve does not lose any biological information of the sequence, because it especially uses the classifications of chemical structure on purines–pyrimidines, amino–keto groups and strong–weak hydrogen bonds. Nandy (1994) proposes a 2D graphical representation by arbitrarily assigning A, G, T, and C to four directions of Cartesian coordinate axes, but such a representation of DNA is accompanied by some loss of visual information associated with crossing and overlapping of the resulting curve by itself. Randic et al. (2000) presents a 3-D graphical representation based on four mutually equivalent tetrahedral directions, which has an important advantage in that the assignment of the four bases to the four tetrahedral directions does not involve arbitrary decisions. Nevertheless, this model is also accompanied by the limitations associated with crossing and overlapping of the spatial curve representing a DNA sequence. Since 2000, researchers have outlined different representations of DNA sequences based on 2D (Guo et al., 2001; Huang et al., 2008; Liu et al., 2006; Randic et al., 2003a, Randic et al., 2003b; Randic, 2004; Song and Tang, 2005; Yao et al., 2006), 3D (Cao et al., 2008; Liao and Wang, 2004a; Liao and Ding, 2006; Qi and Fan, 2007; Qi et al., 2007), 4D (Chi and Ding, 2005), 5D (Liao et al., 2007) and 6D (Liao and Wang, 2004b) spaces. However, some representations still cannot avoid loss of information due to overlapping and crossing of the curve with itself (Guo and Nandy, 2003; Wu et al., 2003; Nandy and Nandy, 2003). Moreover, some mathematical models are based on complex distance matrices and equations, their computations are so complicated, which may also ignore biology information hidden between the neighboring nucleotides (Liao and Wang, 2004c).
Motivated by these aforementioned works, we propose a novel 3D graphical representation based on trinucleotides (TN curve). Consideration of trinucleotides instead of individual and dual nucleotides has superior reasons and advantages. For example, the genetic code consists of trinucleotides of DNA and one can easily find the ORF as the longest sequence of trinucleotides that contains no stop codons when read in a single reading frame. Comparing with other models, TN curve is the first model that can display the information of trinuleotides within 3D space, which helps in visual inspections of sequence features such as composition and distribution of trinucleotides in DNA sequences, recognizing similarities/dissimilarities among different DNA sequences, and allows one to construct considerable numerical characterizations. With two vectors composed of 64 and 6 components, we outline two methods to compare similarities of different DNA sequences, respectively, which may provide convenient tools in sequences alignment.
2. Construction of TN curve
As we know, the four nucleic bases A, G, T, and C can buildup 64 kinds of trinucleotides; the second base of a trinucleotide is associated with the hydrophobic/hydrophilic property of the translated amino acid. According to the property of the second base of a trinucleotide, we can classify the 64 kinds of trinucleotides into four categories as presented in Table 1 .
Table 1.
sixty-four kinds of trinucleotides are classified into four categories.
| Category | Triplets | |||||||||||||||
|---|---|---|---|---|---|---|---|---|---|---|---|---|---|---|---|---|
| I | AAA | GAG | CAC | TAT | AAG | GAA | CAT | TAC | GAC | CAG | AAT | TAA | AAC | CAA | GAT | TAG |
| II | AGA | GGG | CGC | TGT | AGG | GGA | CGT | TGC | GGC | CGG | AGT | TGA | AGC | CGA | GGT | TGG |
| III | ACA | GCG | CCC | TCT | ACG | GCA | CCT | TCC | GCC | CCG | ACT | TCA | ACC | CCA | GCT | TCG |
| VI | ATA | GTG | CTC | TTT | ATG | GTA | CTT | TTC | GTC | CTG | ATT | TTA | ATC | CTA | GTT | TTG |
To numerically represent the trinucleotides in Table 1, we assign the first and third base of a trinucleotide as A→1, G→2, C→3, T→4, while the second base is determined by positive sign “+” and negative sign “-” of the first and third base, i.e., {+,+}→A, {−,+}→G, {−,−}→C, {+,−}→T. In this way, each trinucleotide can be represented by using a set of coordinate (x, y), then the 64 kinds of trinucleotides are divided into four quadrants of a Cartesian 2D coordinates as shown in Fig. 1 .
Fig. 1.
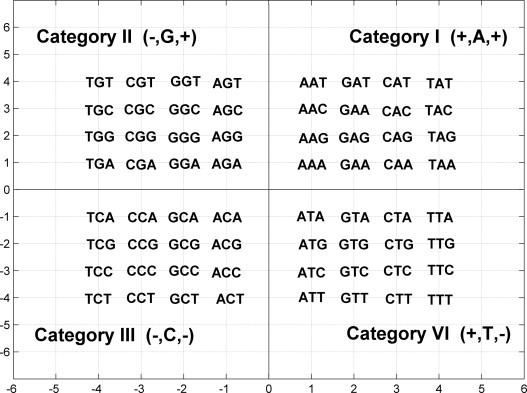
Distributions of the 64 kinds of trinucleotides in Cartesian 2D coordinates.
In Fig. 1, taking (3,−2) for example, pure number 3 and 2 denote that the first and the third bases of corresponding trinucleotide are C and G, respectively, and integration of “+” and “−” denotes the second base is T, therefore (3,−2) represents trinucleotide CTG. Similarly, (3,2) represents CAG, (−3,2) represents CGG and (−3,−2) represents CCG.
Now we consider all possible trinucleotides of an arbitrary DNA primary sequence. In detail, supposing S=s 1 s 2 s 3 s 4… is a DNA sequence, we have a map φ, which can map S into a plot set φ(S)=φ(s 1 s 2 s 3) φ(s 2 s 3 s 4)…φ(s i s i+1 s i+2)…, where, according to Fig. 1,
The corresponding plot set is called as characteristic plot set of corresponding primary sequence. The curve connected all plots of the characteristic plot set in turn is called TN curve (curve based on trinucleotides). Thus, a given DNA sequence can be converted numerically into a 3D curve. In Table 2 , we calculate corresponding (x,y,i) of the eight non-overlapping trinucleotides of sequence ATGGTGCACC. Fig. 2 A shows the corresponding 3D representation. Obviously, the relation between every given DNA sequence with its TN curve is exactly one to one.
Discussion 1
According to the definition, x links the first and second bases of a trinucleotide, this can be used as an approximate descriptor of dinucleotide. If x>0, the second base of given trinucleotide must be A or T, otherwise G or C. Similar results can be obtained for y which links the second and third bases of a trinucleotide, y>0 represents that the second base is A or G, otherwise C or T. An intact trinucleotide is represented by integration of x and y. Therefore, one can obtain more information from these parameters. Letting and , we can obtain the cumulative effect of given sequence and inspect both the local and overall information of DNA sequence. Table 2 and Fig. 2B show the corresponding results based on (x′, y′,i).
Discussion 2
Based on Fig. 1, the 64 kinds of trinucleotides can also be classified into two groups according to the quadrant in which the second base locates in three ways. That is, purine (A, G)/pyrimidine (C, T) groups correspond to quadrant (I, II)/(III, VI), amino (A, C)/keto (G, T) groups correspond to quadrant (I, III)/(II, VI), and week-H bond (A, T)/strong-H bond (G, C) groups correspond to quadrant (I, VI)/(II, III). According to Discussion 1, x>0 or x<0 mean that the second base of the trinucleotide must be an element of (A, T) or (G, C), which just correspond to week-H bond (A, T)/strong-H bond (G, C) groups. Similarly, y>0 or y<0 mean that the second base are (A, G) or (C, T), which just correspond to purine (A, G)/pyrimidine (C, T) groups. Supposing z=x∗y, when z>0, the second base of corresponding trinucleotide must be (A, C), or else (G, T), which just correspond to amino(A, C)/keto(G, T) groups. Thus, we have six descriptors x, y, x′, y′, z and z′ to numerically represent a given DNA sequence, where, z=x∗y, .
Discussion 3
From the construction of TN curve, we know that the initial assignments are not unique. According to statistics theory, we have, that is to say, various 3D curves for the same primary DNA sequence based on different assignments. Nevertheless, we can only obtain a unique primary DNA sequence by translating any TN curve to DNA sequence according to the designations in Fig. 1. Since the zigzag curve does not represent the genuine molecular geometry, we are not interested in the unique relationship between the initial assignments and the possible number of TN curve, but are interested in them as numerical parameters that may facilitate analysis of DNA sequences.
Table 2.
Cartesian 3D coordinates of the sequence ATGGTGCACC.
| Triplets | x | y | i | x′ | y′ |
|---|---|---|---|---|---|
| ATG | 1 | −2 | 1 | 1 | −2 |
| TGG | −4 | 2 | 2 | −3 | 0 |
| GGT | −2 | 4 | 3 | −5 | 4 |
| GTG | 2 | −2 | 4 | −3 | 2 |
| TGC | −4 | 3 | 5 | −7 | 5 |
| GCA | −2 | −1 | 6 | −9 | 4 |
| CAC | 3 | 3 | 7 | −6 | 7 |
| ACC | −1 | −3 | 8 | −7 | 4 |
Fig. 2.
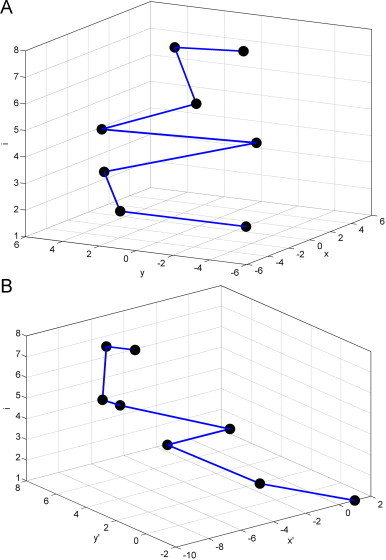
TN curve of sequence ATGGTGCACC.
3. Application
3.1. Utility in providing visual information
A random DNA sequence can be represented by its 3D representation, as is introduced in the construction of TN curve. Based on trinucleotides, TN curve can provide more information that is intuitionistic. Fig. 3 shows the projections of the TN curves of the coding sequences of the first exon of β-globin gene of four different species Human, Gorilla, Opossum and Gallus in Cartesian 2D x–y coordinates, different colors denote the trinucleotides’ densities which can be inferred from the colorbar. Furthermore, the numbers of the line linking the trinucleotides can also display the corresponding trinucleotides usage frequency and correlations between neighboring trinuleotides, the more lines linked, the higher frequency occurring in the DNA sequence (the numbers of the lines observed may be less than practical situation because of overlapping). We can likewise find out whether specific trinucleotides, such as start and stop codons, consist in the DNA sequence directly. It is well known that any sequences have six possible reading frames. The specific codons such as start and stop codons only in a corresponding reading frame are significant. If we calculate the TN curves of each possible reading frame and repeat the steps of Fig. 3, it is conceivable that one can find out the ORF candidates easily.
Fig. 3.

Projections of the TN curves of the coding sequences of the first exon of β-globin gene of human, gorilla, opossum and gallus.
From Fig. 3, we can recognize directly the differences of the trinucleotides’ compositions and distributions in the four sequences. As can be seen, Human and Gorilla are similar in compositions of trinucleotides, which is accordant with actual evolution evidence, while Opossum and Gallus are the most dissimilar, this result is also coincident with the fact that Gallus is non-mammal and Opossum is the most remote species from the remaining mammals. In Fig. 4 , we give the 2D plots of x′ and y′ vs. i of the four species, respectively, from which the same results can be obtained. Besides, we can also inspect detailed features such as composition of bases of corresponding sequence from Fig. 4. Therefore, TN curve provides a practical tool for us to have a deeper insight into DNA sequence with visual information.
Fig. 4.
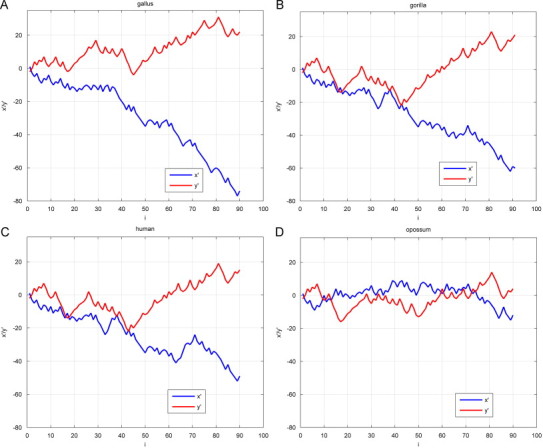
2D plots of x′ and y′ of the coding sequences of the first exon of β-globin gene of human, gorilla, opossum and gallus.
3.2. Discrimination of conserved genes through numerical characterization of DNA sequences
The rapid growth of data in the DNA sequence databases has led to intensive research to develop different ways to identify new gene sequences and functions. In this section, we will illustrate an application of the DNA descriptors arising out of TN curve in differentiating various conserved gene sequences. Here, we take the mean values of x and y as the numerical descriptors of gene sequence.
Table 3 presents the mean values of x and y for ten histone H4 DNA sequences, column 1 lists the species common name, column 2 lists the EMBL ID of the corresponding DNA sequence, and the mean values of x and y is given in columns 3 and 4. For our purpose, only the CDS sequences are used in order to relate closely to the conserved sequences. Accordingly, we show the mean value values of x and y in Fig. 5 .
Table 3.
Mean values of x and y of the coding regions for 10 histone H4 genes.
| Species | EMBL ID | Mean value |
|
|---|---|---|---|
| x | y | ||
| Maize | ZMH4C7 | −0.85484 | 0.21613 |
| Maize | ZMH4C14 | −0.87742 | 0.20645 |
| Maize | ZMH4A | −0.85161 | 0.2129 |
| Chicken | GGHIST4A | −0.87742 | 0.23548 |
| Chicken | GGHIST4B | −0.89355 | 0.23871 |
| Wheat | TAH4091 | −0.92258 | 0.090323 |
| Mouse | MMHIST4 | −0.69677 | 0.16774 |
| Rat | RR4HIS | −0.66129 | 0.2 |
| Human | HSHIS4 | −0.43548 | 0.24194 |
| Human | HSHISAD | −0.37742 | 0.2871 |
Fig. 5.
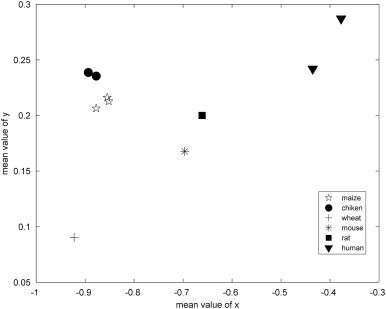
Numerically representing the ten histone H4 DNA sequences by mean values of x and y.
Seen from Fig. 5, the ten sequences are efficiently clustered according to species, the results show the descriptors we adopt do well in representing the DNA sequence. To provide a broader basis for our hypothesis of gene discrimination through numerical characteristics parameters of DNA sequences, we also test this method by discriminating conserve sequences of different gene types. In Table 4 , we compute the mean values of x and y of the coding sequences for three gene types α globin, β globin and histone H4 of different mammalian species.
Table 4.
Mean values of x and y of the coding regions of three conserved genes.
| Species | EMBL ID | Mean value |
|
|---|---|---|---|
| x | y | ||
| Histone H4 | |||
| Mouse | MMHIST4 | −0.69677 | 0.16774 |
| Rat | RR4HIS | −0.66129 | 0.2 |
| Human | HSHIS4 | −0.43548 | 0.24194 |
| Human | HSHISAD | −0.37742 | 0.2871 |
| Alpha globins—exons | |||
| Horse | ECHBA22 | −0.6815 | −0.31382 |
| Goat | CHHBAI | −0.68852 | −0.30679 |
| Rh. monkey | MMHBA | −0.79157 | −0.27869 |
| Mouse | MMAGL1 | −0.49883 | −0.29508 |
| Rabbit | OCHBAPT | −0.65574 | −0.25527 |
| Orangutan | PPHBA02 | −0.77518 | −0.31382 |
| Beta globins—exons | |||
| Human beta globin | HSHBB | −0.19457 | −0.19457 |
| Mouse | MMBGL1 | −0.3552 | −0.14932 |
| Rat | RNGLB | −0.22624 | −0.10633 |
| Goat | CHHBBAA | −0.31193 | −0.05734 |
| Opossum | DVHBBB | −0.1267 | −0.16516 |
| Lemur | LMHBB | −0.34842 | −0.11765 |
| Chimp | OCBGLO | −0.3371 | −0.02036 |
In Fig. 6 A, a 2D, plot of the mean value of x and y shows three distinct regions for the three gene types based on Table 4. As is expected from the fact that similar gene sequences from different species bear close homologies and are distinctly different from other genes by virtue of the base composition and distribution patterns. Nandy (2003) obtained the similar results except for the mouse gene of α globin by using his 2D graphical representation system for DNA sequences to calculate the normalized mean moments for the coding segments of the three gene types, as shown in Fig. 6B. Obviously, these gene types are clustered into three groups correctly in our work, while the mouse gene of α globin is intermingled by histone genes in Nandy's work. Then, the resolution of TN curve is much better.
Fig. 6.
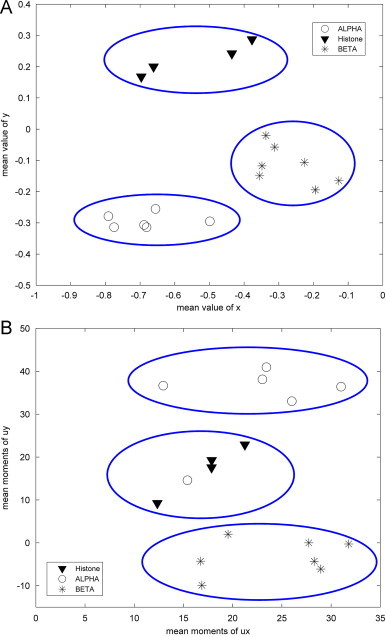
2D plot of the mean value of x vs. y. (A) Is the results based on TN curve and (B) is the results obtained by Nandy (2003).
3.3. Similarities/dissimilarities analysis of the coding sequences of gene among different species
Comparing similarities/dissimilarities among different DNA sequences is one of the essential motivations of graphical representation, which is reflected in recently researches (Chi and Ding, 2005; Chen et al., 2008; Cao et al., 2008; Liu et al., 2006; Liao and Wang, 2004a, Liao and Wang, 2004b, Liao and Wang, 2004c; Liao and Ding, 2006; Liao et al., 2006, Liao et al., 2008; Qi and Fan, 2007; Qi et al., 2007; Randic et al., 2006; Wang and Zhang, 2006; Yao et al., 2006; Zhang et al., 2007; Zhu et al., 2007). In these works, most researchers emphasize their approaches on the coding sequences of the first exon of β-globin gene of different species. Nandy and his partners (2006) suggest that researchers should apply their graphical techniques to complete genes, or at least to the complete coding sequence, so that an unambiguous point of contact is available for comparing to the real world. In this section, we illustrate the utilities of TN curve with the examination of similarities analysis among the coding sequences of the first exon of β-globin gene of 11 species. For comparison, we also do similarities analysis among the complete coding sequences of β-globin gene of the 11 species, and the detailed information of related DNA sequences is presented in Table 5 .
Table 5.
Coding sequences of the exon of β-globin gene of 11 different species.
| Species | NCBI ID | Location of each exon | Length of complete CDS (bp) |
|---|---|---|---|
| Human | U01317 | 62187…62278, 62409…62631, 63482…63610 | 444 |
| Goat | M15387 | 279…364, 493…715, 1621…1749 | 438 |
| Opossum | J03643 | 467…558, 672…894, 2360…2488 | 444 |
| Gallus | V00409 | 465…556, 649…871, 1682…1810 | 444 |
| Lemur | M15734 | 154…245, 376…598, 1467…1595 | 444 |
| Mouse | V00722 | 275…367, 484…705, 1334…1462 | 444 |
| Rabbit | V00882 | 277…368, 495…717, 1291…1419 | 444 |
| Rat | X06701 | 310…401, 517…739, 1377…1505 | 444 |
| Gorilla | X61109 | 4538…4630, 4761…4982, 5833…5881 | 364 |
| Bovine | X00376 | 278…363, 492…714, 1613…1741 | 438 |
| Chimpanzee | X02345 | 4189…4293, 4412…4633, 5484…5532 | 376 |
Sequence descriptors comparison is one of the main methods to do similarity analysis. It is based on the quantitative characterization of DNA sequences by ordered sets of descriptors derived from the sequences, such as the normalized eigenvalues of all kinds of matrices. For example, Randic et al. (2003a) proposed E matrix, M/M matrix, L/L matrix and Lk/Lk matrix, then used their eigenvalues as descriptors. These methods were proved to be useful and used by many authors. However, these matrices become too large to calculate the eigenvalues when DNA sequence is very long, and the computations are very complex. Furthermore, there is some loss of information associated with these matrices (Liao and Wang, 2004c). Then, how to create a simple and convenient method has been a considerable challenge. Here, we propose two methods by constructing two kinds of vectors composed of different numerical descriptors, and both methods do not relate to complex calculations. The underlying assumption is that if two vectors point to a similar direction, two DNA sequences represented by the descriptor vectors are similar. Using Euclidean distance as measurement of sequence similarities, the smaller the Euclidean distance is, the more similar the DNA sequences are. That is to say, the distances between evolutionary closely related species are smaller, while those between evolutionary disparate species are larger.
Method 1. The compositions of trinucleotides among DNA sequences of various species are universally different, which can be seen from Fig. 3. In order to find some of the invariants sensitive to the form of the TN curve, we use a vector relating to trinucleotides usages composed of 64 components as descriptors to represent DNA sequence. Here, we employ a symmetric matrix whose (i, j) is defined as the Euclidean distance between sequence i and j to describe the mutual distance of two sequences. Based on this vector, the Euclidean distance between two sequences can be defined as follows:
where and are the usage probability of mth trinucleotide among the 64 kinds of trinucleotides in sequences Si and Sj, respectively. With the help of TN curve, one can get each kind of trinucleotide's usage probability in a given DNA sequence without complicated computation. In the sample of Table 2, it is easy to count the number of each trinucleotide easily. For example, we want to obtain the usage probability of trinucleotide GGT in a DNA sequence, which can be accomplished with the following formula:
where Ntot is the total number of all trinucleotides in given DNA sequence, N (−2, 4) denotes the number of GGT, which can be got by counting out these dots with x=−2 and y=4 from map φ. In the sample of Table 2, the numbers of GGT is 1, the total number of all trinucleotides is 8, then the usage probability of trinucleotide GGT is 12.5%. Similarly, we can also compute the probabilities of other trinucleotides.
Method 2. In Discussions 1 and 2, we elaborate the significations of the six parameters x, y, z, x′, y′, z′. Here, we use a vector composed of six components as numerically descriptors for a given sequence. Having a vector representation of a DNA sequence, we can compare similarities of different sequences by using the Euclidean distance between two vectors representing them. The Euclidean distance based on the 6-components vector between sequences Si and Sj is defined as follows:
where, V={x, y, z, x′, y′, z′} is the descriptors vector, and are the nth component of the 6D vector of sequences Si and Sj, respectively.
Although methods 1 and 2 are based on two vectors composed of different descriptors of DNA sequences, their hypostasis is identity, for both methods can represent the trinucleotides’ compositions. Table 6, Table 7 are the similarities matrices of the coding sequences of the fist exon and complete coding sequences among the 11 species based on 64-components vector, respectively. Table 8, Table 9 are the corresponding similarities matrices based on 6-components vector, respectively. Observing Table 6, we find gallus (the only non-mammal among them) and Opossum (the most remote species from the remaining mammals) are most dissimilar to others among the 11 species. On the other hand, human–gorilla has the smallest distance, so they are the most similar species pairs. Human–chimpanzee, goat–bovine, mouse–gorilla, mouse–chimpanzee, rabbit–chimpanzee, and gorilla–chimpanzee have smaller distance, so they are more similar species pairs. Similar results are also obtained from Table 6, Table 7, Table 8, which are coincided with the results in recent papers (Cao et al., 2008; He and Wang, 2002; Liao and Ding, 2006; Qi and Fan, 2007; Wang and Zhang, 2006; Zhang and Chen, 2006).
Table 6.
Similarity matrix of the coding sequences of the first exon of 11 species based on 64-components vector.
| Species | Human | Goat | Opossum | Gallus | Lemur | Mouse | Rabbit | Rat | Gorilla | Bovine | Chimpanzee |
|---|---|---|---|---|---|---|---|---|---|---|---|
| Human | 0 | 0.10713 | 0.12172 | 0.11759 | 0.1144 | 0.083479 | 0.082923 | 0.091624 | 0.028869 | 0.08388 | 0.043609 |
| Goat | 0 | 0.14473 | 0.11809 | 0.10973 | 0.089438 | 0.11838 | 0.099444 | 0.10015 | 0.058322 | 0.1051 | |
| Opossum | 0 | 0.15072 | 0.13053 | 0.11929 | 0.12729 | 0.14229 | 0.12049 | 0.13052 | 0.11306 | ||
| Gallus | 0 | 0.11331 | 0.12601 | 0.11928 | 0.12273 | 0.11731 | 0.11023 | 0.11759 | |||
| Lemur | 0 | 0.10247 | 0.10732 | 0.11111 | 0.11075 | 0.097221 | 0.10929 | ||||
| Mouse | 0 | 0.095812 | 0.086324 | 0.074946 | 0.08181 | 0.078304 | |||||
| Rabbit | 0 | 0.11594 | 0.078356 | 0.099063 | 0.077364 | ||||||
| Rat | 0 | 0.088967 | 0.094274 | 0.098329 | |||||||
| Gorilla | 0 | 0.074857 | 0.034471 | ||||||||
| Bovine | 0 | 0.076464 | |||||||||
| Chimpanzee | 0 |
Table 7.
Similarity matrix of the complete coding sequences of 11 species based on 64-components vector.
| Species | Human | Goat | Opossum | Gallus | Lemur | Mouse | Rabbit | Rat | Gorilla | Bovine | Chimpanzee |
|---|---|---|---|---|---|---|---|---|---|---|---|
| Human | 0 | 0.047604 | 0.059859 | 0.064944 | 0.037313 | 0.036899 | 0.037993 | 0.043754 | 0.024439 | 0.043367 | 0.023129 |
| Goat | 0 | 0.055211 | 0.072704 | 0.04302 | 0.049797 | 0.047149 | 0.05337 | 0.048233 | 0.026747 | 0.047787 | |
| Opossum | 0 | 0.065494 | 0.052379 | 0.05411 | 0.055418 | 0.050792 | 0.057038 | 0.048812 | 0.056192 | ||
| Gallus | 0 | 0.06439 | 0.057681 | 0.068174 | 0.059773 | 0.068613 | 0.069482 | 0.069404 | |||
| Lemur | 0 | 0.046806 | 0.031512 | 0.049049 | 0.035886 | 0.040645 | 0.034526 | ||||
| Mouse | 0 | 0.048944 | 0.031186 | 0.041257 | 0.046439 | 0.040779 | |||||
| Rabbit | 0 | 0.051492 | 0.040774 | 0.043108 | 0.038851 | ||||||
| Rat | 0 | 0.048275 | 0.046161 | 0.048407 | |||||||
| Gorilla | 0 | 0.04252 | 0.012682 | ||||||||
| Bovine | 0 | 0.04246 | |||||||||
| Chimpanzee | 0 |
Table 8.
Similarity matrix of the coding sequences of the first exon of 11 species based on six-components vector.
| Species | Human | Goat | Opossum | Gallus | Lemur | Mouse | Rabbit | Rat | Gorilla | Bovine | Chimpanzee |
|---|---|---|---|---|---|---|---|---|---|---|---|
| Human | 0 | 16.807 | 27.623 | 18.167 | 40.553 | 25.198 | 28.544 | 18.024 | 3.5076 | 31.188 | 15.27 |
| Goat | 0 | 39.381 | 28.549 | 27.87 | 12.179 | 13.649 | 20.42 | 15.463 | 16.003 | 5.2699 | |
| Opossum | 0 | 32.858 | 51.966 | 46.078 | 49.26 | 22.698 | 30.846 | 49.012 | 40.636 | ||
| Gallus | 0 | 54.776 | 39.837 | 34.173 | 25.28 | 17.14 | 44.352 | 26.252 | |||
| Lemur | 0 | 20.646 | 29.885 | 35.364 | 40.908 | 13.675 | 32.363 | ||||
| Mouse | 0 | 19.912 | 29.197 | 24.447 | 9.2521 | 14.336 | |||||
| Rabbit | 0 | 27.373 | 26.596 | 18.102 | 15.705 | ||||||
| Rat | 0 | 19.709 | 30.006 | 23.232 | |||||||
| Gorilla | 0 | 30.607 | 13.053 | ||||||||
| Bovine | 0 | 19.912 | |||||||||
| Chimpanzee | 0 |
Table 9.
Similarity matrix of the complete coding sequences of 11 species based on six-components vector.
| Species | Human | Goat | Opossum | Gallus | Lemur | Mouse | Rabbit | Rat | Gorilla | Bovine | Chimpanzee |
|---|---|---|---|---|---|---|---|---|---|---|---|
| Human | 0 | 47.435 | 72.592 | 224.64 | 40.987 | 108.88 | 38.569 | 93.976 | 34.964 | 76.534 | 27.528 |
| Goat | 0 | 60.001 | 267.78 | 15.861 | 146.12 | 32.153 | 120.12 | 69.595 | 31.427 | 55.033 | |
| Opossum | 0 | 247.28 | 57.513 | 121.96 | 81.315 | 88.352 | 68.348 | 78.567 | 62.949 | ||
| Gallus | 0 | 260.84 | 126.19 | 255.55 | 165.68 | 198.98 | 298.67 | 214.76 | |||
| Lemur | 0 | 140.32 | 39.483 | 117.1 | 65.822 | 38.976 | 53.574 | ||||
| Mouse | 0 | 138.82 | 42.835 | 78.094 | 176.95 | 93.884 | |||||
| Rabbit | 0 | 117.09 | 61.332 | 55.437 | 46.124 | ||||||
| Rat | 0 | 59.751 | 149.89 | 71.831 | |||||||
| Gorilla | 0 | 100.97 | 16.342 | ||||||||
| Bovine | 0 | 86.436 | |||||||||
| Chimpanzee | 0 |
In method 2, we construct a six-components vector as descriptor of DNA sequence. To validate the efficiencies of this 6D vector, we perform principal component analysis (PCA) on the six parameters. Fig. 7 A shows the projection the 6D vectors of the complete coding sequences of 11 species on a 2D property space composed of PC 1 and PC 2, where PC 1 and PC 2 are the first two principal components. From Fig. 7A, we can find that opossum and gallus are most dissimilar with other species, while human–gorilla has the smallest distance. Besides, human–chimpanzee, gorilla–chimpanzee, goat–bovine are the more similar species. These results are overall in agreement with the results above. We calculate the contribution proportion of the six components, as shown in Fig. 7B, from which we find that the cumulative contribution proportion of the first two principal components is 92% of the total inertia of the six-dimension space vector. These results denote the six-components vector do well in numerically representing DNA sequences.
Fig. 7.
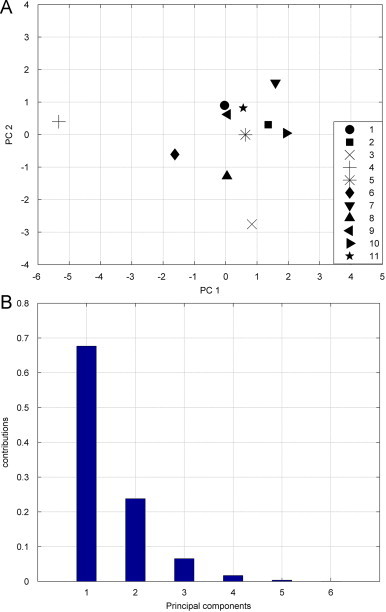
PCA is performed on the 6D vector. (A) Is the results of projection of 11 6-component vectors on the first two principal components, here: 1—human, 2—goat, 3—opossum, 4—gallus, 5—lemur, 6—mouse, 7—rabbit, 8—rat, 9—Gorilla, 10—bovine, and 11—chimpanzee and (B) shows the contributions of each principal component.
4. Conclusion
Visual inspection and numerical description of DNA sequences are major functions of graphical representations. By classifying the 64 kinds of trinucleotides into four categories, we construct a novel 3D graphical representation of DNA sequence. In this paper, the utilities of TN curve are illustrated by relevant applications, such as visual inspection and graphical analysis similarities of different DNA sequences, discriminating conserving sequences and similarities/dissimilarities of orthologous genes among different species. We also propose six descriptors which can be obtained without complex calculations for DNA sequences from this novel model, and the PCA validate their efficiencies. Meanwhile, two simple methods are outlined to analyze similarities/dissimilarities among DNA sequences, and these two approaches can be easier to perform with low cost of runtime.
Comparison with other geometrical models, TN curve has following advantages: (1) It is the first approach that allows us to display the trinucleotides information in a space within 3D space. (2) It contains more information, as introduced in Section 2, we can obtain information of not only trinucleotides but also dinucleotides. (3) It provides straightforwardly visual biological information of DNA sequence, such as compositions of trinucleotides and recognizing similarities among different sequences. (4) Based on trinucleotides, TN curve can provide efficient method in sequences especially coding sequences analysis. Therefore, TN curve can provide convenient tools for both computational scientists and molecular biologists in Bioinformatics researches.
Competing interests
The authors declare that they have no competing interests.
Acknowledgments
This paper is supported by National Natural Science Foundation of China (Project No. 60671018 and 60121101). The authors would like to thank the anonymous referees for many valuable suggestions that have improved this manuscript.
Contributor Information
Jia-Feng Yu, Email: bat3024@126.com.
Xiao Sun, Email: xsun@seu.edu.cn.
Ji-Hua Wang, Email: jhwyh@yahoo.com.cn.
References
- Andraos J. Kinetic plasticity and the determination of product ratios for kinetic schemes leading to multiple products without rate laws: new methods based on directed graphs. Canadian Journal of Chemistry. 2008;86:342–357. [Google Scholar]
- Althaus I.W., Chou J.J., Gonzales A.J., Diebel M.R., Chou K.C., Kezdy F.J., Romero D.L., Aristoff P.A., Tarpley W.G., Reusser F. Steady-state kinetic studies with the non-nucleoside HIV-1 reverse transcriptase inhibitor U-87201E. Journal of Biological Chemistry. 1993;268:6119–6124. [PubMed] [Google Scholar]
- Althaus I.W., Gonzales A.J., Chou J.J., Diebel M.R., Chou K.C., Kezdy F.J., Romero D.L., Aristoff P.A., Tarpley W.G., Reusser F. The quinoline U-78036 is a potent inhibitor of HIV-1 reverse transcriptase. Journal of Biological Chemistry. 1993;268:14875–14880. [PubMed] [Google Scholar]
- Althaus I.W., Chou J.J., Gonzales A.J., Diebel M.R., Chou K.C., Kezdy F.J., Romero D.L., Aristoff P.A., Tarpley W.G., Reusser F. Kinetic studies with the nonnucleoside HIV-1 reverse transcriptase inhibitor U-88204E. Biochemistry. 1993;32:6548–6554. doi: 10.1021/bi00077a008. [DOI] [PubMed] [Google Scholar]
- Cao Z., Liao B., Li R. A group of 3D graphical representation of DNA sequences based on dual nucleotides. International Journal of Quantum Chemistry. 2008;108:1485–1490. [Google Scholar]
- Chen W., Liao B., Liu Y., Zhu W., Su Z. A numerical representation of DNA sequence and its applications. MATCH Communications in Mathematical and in Computer Chemistry. 2008;60:291–300. [Google Scholar]
- Chi R., Ding K. Novel 4D numerical representation of DNA sequences. Chemical Physics Letters. 2005;407:63–67. [Google Scholar]
- Chou K.C. Two new schematic rules for rate laws of enzyme-catalyzed reactions. Journal of Theoretical Biology. 1981;89:581–592. doi: 10.1016/0022-5193(81)90030-8. [DOI] [PubMed] [Google Scholar]
- Chou K.C. Graphical rules in steady and non-steady enzyme kinetics. Journal of Biological Chemistry. 1989;264:12074–12079. [PubMed] [Google Scholar]
- Chou K.C., Forsen S. Graphical rules for enzyme-catalyzed rate laws. Biochemical Journal. 1980;187:829–835. doi: 10.1042/bj1870829. [DOI] [PMC free article] [PubMed] [Google Scholar]
- Chou K.C., Liu W.M. Graphical rules for non-steady state enzyme kinetics. Journal of Theoretical Biology. 1981;91:637–654. doi: 10.1016/0022-5193(81)90215-0. [DOI] [PubMed] [Google Scholar]
- Chou K.C., Zhang C.T. Diagrammatization of codon usage in 339 HIV proteins and its biological implication. AIDS Research and Human Retroviruses. 1992;8:1967–1976. doi: 10.1089/aid.1992.8.1967. [DOI] [PubMed] [Google Scholar]
- Chou K.C., Zhang C.T., Elrod D.W. Do antisense proteins exist? Journal of Protein Chemistry. 1996;15:59–61. doi: 10.1007/BF01886811. [DOI] [PubMed] [Google Scholar]
- Chou K.C. Review: applications of graph theory to enzyme kinetics and protein folding kinetics. Steady and non-steady state systems. Biophysical Chemistry. 1990;35:1–24. doi: 10.1016/0301-4622(90)80056-d. [DOI] [PubMed] [Google Scholar]
- Diao Y., Li M., Feng Z., Yin J., Pan Y. The community structure of human cellular signaling network. Journal of Theoretical Biology. 2007;247:608–615. doi: 10.1016/j.jtbi.2007.04.007. [DOI] [PMC free article] [PubMed] [Google Scholar]
- Gao L., Ding Y.S., Dai H., Shao S.H., Huang Z.D., Chou K.C. A novel fingerprint map for detecting SARS-CoV. Journal of Pharmaceutical and Biomedical Analysis. 2006;41:246–250. doi: 10.1016/j.jpba.2005.09.031. [DOI] [PMC free article] [PubMed] [Google Scholar]
- Gonzalez-Diaz H., Sanchez-Gonzalez A., Gonzalez-Diaz Y. 3D-QSAR study for DNA cleavage proteins with a potential anti-tumor ATCUN-like motif. Journal of Inorganic Biochemistry. 2006;100:1290–1297. doi: 10.1016/j.jinorgbio.2006.02.019. [DOI] [PubMed] [Google Scholar]
- Gonzalez-Diaz H., Vilar S., Santana L., Uriarte E. Medicinal chemistry and bioinformatics—current trends in drugs discovery with networks topological indices. Current Topics in Medicinal Chemistry. 2007;10:1015–1029. doi: 10.2174/156802607780906771. [DOI] [PubMed] [Google Scholar]
- Gonzalez-Diaz H., Bonet I., Teran C., De Clercq E., Bello R., Garcia M.M., Santana L., Uriarte E. ANN-QSAR model for selection of anticancer leads from structurally heterogeneous series of compounds. European Journal of Medicinal Chemistry. 2007;42:580–585. doi: 10.1016/j.ejmech.2006.11.016. [DOI] [PubMed] [Google Scholar]
- Gonzalez-Diaz H., Gonzalez-Diaz Y., Santana L., Ubeira F.M., Uriarte E. Proteomics, networks, and connectivity indices. Proteomics. 2008;8:750–778. doi: 10.1002/pmic.200700638. [DOI] [PubMed] [Google Scholar]
- Guo X., Randic M., Basak Subhash C. A novel 2-D graphical representation of DNA sequences of low degeneracy. Chemical Physics Letters. 2001;350:106–112. [Google Scholar]
- Guo X., Nandy A. Numerical characterization of DNA sequences in a 2-D graphical representation scheme of low degeneracy. Chemical Physics Letters. 2003;369:361–366. [Google Scholar]
- Hamori E., Ruskin J. H curves, a novel method of representation of nucleotide series especially suited for long DNA sequences. Journal of Biological Chemistry. 1983;258:1318–1327. [PubMed] [Google Scholar]
- He P.-a., Wang J. Characteristic sequences for DNA primary sequence. Journal of Chemical Information and Computer Science. 2002;42:1080–1085. doi: 10.1021/ci010131z. [DOI] [PubMed] [Google Scholar]
- Huang G., Liao B., Li Y., Liu Z. H curves: a novel 2D graphical representation for DNA sequences. Chemical Physics Letters. 2008;462:129–132. [Google Scholar]
- Liao B., Wang T.-m. 3-D graphical representation of DNA sequences and their numerical characterization. Journal of Molecular Structure (THEOCHEM) 2004;681:209–212. [Google Scholar]
- Liao B., Wang T.-m. Analysis of similarity/dissimilarity of DNA sequences based on nonoverlapping trinucleotides of nucleotide bases. Journal of Chemical Information and Computer Science. 2004;44:1666–1670. doi: 10.1021/ci034271f. [DOI] [PubMed] [Google Scholar]
- Liao B., Wang T.-m. Analysis of similarity/dissimilarity of DNA sequences based on 3-D graphical representation. Chemical Physics Letters. 2004;388:195–200. [Google Scholar]
- Liao B., Ding K. A 3D graphical representation of DNA sequences and its application. Theoretical Computer Science. 2006;358:56–64. [Google Scholar]
- Liao B., Zhu W., Liu Y. 3D graphical representation of DNA sequence without degeneracy and its applications in constructing phylogenic tree. MATCH Communications in Mathematical and in Computer Chemistry. 2006;56:209–216. [Google Scholar]
- Liao B., Zeng C., Li F., Tang Y. Analysis of similarity/dissimilarity of DNA sequences based on dual nucleotides. MATCH Communications in Mathematical and in Computer Chemistry. 2008;59:647–652. [Google Scholar]
- Liu X., Dai Q., Xiu Z., Wang T. PNN-curve: a new 2D graphical representation of DNA sequences and its application. Journal of Theoretical Biology. 2006;243:555–561. doi: 10.1016/j.jtbi.2006.07.018. [DOI] [PubMed] [Google Scholar]
- Liao B., Li R., Zhu W. On the similarity of DNA primary sequences based on 5-D representation. Journal of Mathematical Chemistry. 2007;42:47–57. [Google Scholar]
- Myers D., Palmer G. Microcomputer tools for steady-state enzyme kinetics. Bioinformatics. 1985;1:105–110. [PubMed] [Google Scholar]
- Nandy A. A new graphical representation and analysis of DNA sequence structure: I. Methodology and application to globin genes. Current Science. 1994;66:309–314. [Google Scholar]
- Nandy A., Nandy P. On the uniqueness of quantitative DNA difference descriptors in 2D graphical representation models. Chemical Physics Letters. 2003;368:102–107. [Google Scholar]
- Nandy, A., 2003. Novel method for discrimination of conserved genes through numerical characterization of DNA sequences. Internet Electronic Journal of Molecular Design, 2.
- Nandy A., Harle M., Basak S.C. Mathematical descriptors of DNA sequences: development and applications. ARKIVOC. 2006;9:211–238. [Google Scholar]
- Prado-Prado F.J., Gonzalez-Diaz H., de la Vega O.M., Ubeira F.M., Chou K.C. Unified QSAR approach to antimicrobials. First multi-tasking QSAR model for input-coded prediction, structural back-projection, and complex networks clustering of antiprotozoal compounds. Bioorganic & Medicinal Chemistry. 2008;16(Part 3):5871–5880. doi: 10.1016/j.bmc.2008.04.068. [DOI] [PubMed] [Google Scholar]
- Qi X.-Q., Wen J., Qi Z.-H. New 3D graphical representation of DNA sequence based on dual nucleotides. Journal of Theoretical Biology. 2007;249:681–690. doi: 10.1016/j.jtbi.2007.08.025. [DOI] [PMC free article] [PubMed] [Google Scholar]
- Qi Z.-H., Fan T.-R. PN-curve: a 3D graphical representation of DNA sequences and their numerical characterization. Chemical Physics Letters. 2007;442:434–440. [Google Scholar]
- Randic M., Vracko M., Nandy A., Basak S.C. On 3-D graphical representation of DNA primary sequences and their numerical characterization. Journal of Chemical Information and Computer Science. 2000;40:1235–1244. doi: 10.1021/ci000034q. [DOI] [PubMed] [Google Scholar]
- Randic M., Vracko M., Lers N., Plavsic D. Novel 2-D graphical representation of DNA sequences and their numerical characterization. Chemical Physics Letters. 2003;368:1–6. [Google Scholar]
- Randic M., Vracko M., Zupan J., Novic M. Compact 2-D graphical representation of DNA. Chemical Physics Letters. 2003;373:558–562. [Google Scholar]
- Randic M. Graphical representations of DNA as 2-D map. Chemical Physics Letters. 2004;386:468–471. [Google Scholar]
- Randic M., Zupan J., Vikic-Topic D., Plavsic D. A novel unexpected use of a graphical representation of DNA: graphical alignment of DNA sequences. Chemical Physics Letters. 2006;431:375–379. [Google Scholar]
- Song J., Tang H. A new 2-D graphical representation of DNA sequences and their numerical characterization. Journal of Biochemical and Biophysical Methods. 2005;63:228–239. doi: 10.1016/j.jbbm.2005.04.004. [DOI] [PubMed] [Google Scholar]
- Wang M., Yao J.S., Huang Z.D., Xu Z.J., Liu G.P., Zhao H.Y., Wang X.Y., Yang J., Zhu Y.S., Chou K.C. A new nucleotide-composition based fingerprint of SARS-CoV with visualization analysis. Medicinal Chemistry. 2005;1:39–47. doi: 10.2174/1573406053402505. [DOI] [PubMed] [Google Scholar]
- Wang J., Zhang Y. Characterization and similarity analysis of DNA sequences based on mutually direct–complementary trinucleotides. Chemical Physics Letters. 2006;425:324–328. [Google Scholar]
- Wu Y., Liew Alan W.-C., Yan H., Yang M. DB-curve: a novel 2D method of DNA sequence visualization and representation. Chemical Physics Letters. 2003;367:170–176. [Google Scholar]
- Wolfram S. Cellular automation as models of complexity. Nature. 1984;311:419–424. [Google Scholar]
- Xiao X., Shao S., Ding Y., Huang Z., Chen X., Chou K.C. Using cellular automata to generate image representation for biological sequences. Amino Acids. 2005;28:29–35. doi: 10.1007/s00726-004-0154-9. [DOI] [PMC free article] [PubMed] [Google Scholar]
- Xiao X., Shao S., Ding Y., Huang Z., Chen X., Chou K.C. An application of gene comparative image for predicting the effect on replication Ratio by HBV virus gene missense mutation. Journal of Theoretical Biology. 2005;235:555–565. doi: 10.1016/j.jtbi.2005.02.008. [DOI] [PubMed] [Google Scholar]
- Xiao X., Wang P., Chou K.C. Predicting protein structural classes with pseudo amino acid composition: an approach using geometric moments of cellular automaton image. Journal of Theoretical Biology. 2008;254:691–696. doi: 10.1016/j.jtbi.2008.06.016. [DOI] [PubMed] [Google Scholar]
- Xiao X., Shao S.H., Chou K.C. A probability cellular automaton model for hepatitis B viral infections. Biochemical and Biophysical Research Communications. 2006;342:605–610. doi: 10.1016/j.bbrc.2006.01.166. [DOI] [PubMed] [Google Scholar]
- Xiao X., Shao S.H., Ding Y.S., Huang Z.D., Chou K.C. Using cellular automata images and pseudo amino acid composition to predict protein subcellular location. Amino Acids. 2006;30:49–54. doi: 10.1007/s00726-005-0225-6. [DOI] [PMC free article] [PubMed] [Google Scholar]
- Xiao X., Wang P., Chou K.C. GPCR-CA: a cellular automaton image approach for predicting G-protein-coupled receptor functional classes. Journal of Computational Chemistry. 2009;30:1414–1423. doi: 10.1002/jcc.21163. [DOI] [PubMed] [Google Scholar]
- Yao Y.-h., Nan X.-y., Wang T.-m. A new 2D graphical representation classification curve and the analysis of similarity/dissimilarity of DNA sequences. Journal of Molecular Structure (THEOCHEM) 2006;764:101–108. [Google Scholar]
- Zhang C.T., Chou K.C. Graphic analysis of codon usage strategy in 1490 human proteins. Journal of Protein Chemistry. 1993;12:329–335. doi: 10.1007/BF01028195. [DOI] [PubMed] [Google Scholar]
- Zhang C.T., Chou K.C. Analysis of codon usage in 1562 E. Coli protein coding sequences. Journal of Molecular Biology. 1994;238:1–8. doi: 10.1006/jmbi.1994.1263. [DOI] [PubMed] [Google Scholar]
- Zhang C.T., Zhang R. Analysis of distribution of bases in the coding sequences by a diagrammatic technique. Nucleic Acids Research. 1991;19:6313–6317. doi: 10.1093/nar/19.22.6313. [DOI] [PMC free article] [PubMed] [Google Scholar]
- Zhang R., Zhang C.T. Z curves, an intuitive tool for visualizing and analyzing the DNA sequences. Journal of Biomolecular Structure and Dynamics. 1994;11:767–782. doi: 10.1080/07391102.1994.10508031. [DOI] [PubMed] [Google Scholar]
- Zhang X., Luo J., Yang L. New invariant of DNA sequence based on 3DD-curves and its application on phylogeny. Journal of Computational Chemistry. 2007;28:2342–2346. doi: 10.1002/jcc.20760. [DOI] [PubMed] [Google Scholar]
- Zhang Y., Chen W. Invariants of DNA sequences based on 2DD-curves. Journal of Theoretical Biology. 2006;242:382–388. doi: 10.1016/j.jtbi.2006.03.012. [DOI] [PubMed] [Google Scholar]
- Zhu W., Liao B., Luo J., Li R. Numerical characterization and similarity analysis of neurocan gene. MATCH Communications in Mathematical and in Computer Chemistry. 2007;57:143–155. [Google Scholar]