

Abstract
The cancer diagnostic is a complex process and, sometimes, the specific markers can interfere or produce negative results. Thus, new simple and fast theoretical models are required. One option is the complex network graphs theory that permits us to describe any real system, from the small molecules to the complex genetic, neural or social networks by transforming real properties in topological indices. This work converts the protein primary structure data in specific Randic's star networks topological indices using the new sequence to star networks (S2SNet) application. A set of 1054 proteins were selected from previous works and contains proteins related or not with two types of cancer, human breast cancer (HBC) and human colon cancer (HCC). The general discriminant analysis method generates an input-coded multi-target classification model with the training/predicting set accuracies of 90.0% for the forward stepwise model type. In addition, a protein subset was modified by single amino acid mutations with higher log-odds PAM250 values and tested with the new classification if can be related with HBC or HCC. In conclusion, we shown that, using simple input data such is the primary protein sequence and the simples linear analysis, it is possible to obtain accurate classification models that can predict if a new protein related with two types of cancer. These results promote the use of the S2SNet in clinical proteomics.
Keywords: Input-coded multi-target QPDR, Star graph, Cancer theoretical model, Clinical proteomics, GDA method
1. Introduction
Cancer is a leading cause of death worldwide, accounted for around 13% of all deaths in 2007 (WHO, 2008). Two of the leading types of cancer are the human breast cancer (HBC) and the human colon cancer (HCC). The estimated new cancer cases and deaths in US for 2008 shows that HBC will affect 26% of the women (15% will die) and HCC will involve 10% of the men/women (8% men and 9% women will die) (Jemal et al., 2008). Therefore, simple and fast theoretical method can be very useful in the detection of cancer diseases.
The actual work will use the protein quantitative proteome-disease relationship (QPDR) (Ferino et al., 2008), similar to quantitative structure-activity relationship (QSAR) (Devillers and Balaban, 1999). QPDR is one of the widely used analyse for predicting the protein properties and, in the present study, is using the macromolecular descriptors, named topological indices (TIs), obtained with the graph theory. The branch of mathematical chemistry dedicated to encode the DNA/protein information in graph representations by the use of the TIs has become an intense research area (Agüero-Chapin et al., 2006; Bielinska-Waz et al., 2007; Liao and Wang, 2004; Liao and Ding, 2005; Randic, 2000; Randic and Basak, 2001; Randic and Balaban, 2003; Randic et al., 2000). The graphic approaches of the biological systems study can provide useful insights in QSAR studies (González-Díaz et al., 2006, González-Díaz et al., 2007c; Prado-Prado et al., 2008), protein folding kinetics (Chou, 1990), enzyme-catalyzed reactions (Chou, 1989; Chou and Forsen, 1980; Chou and Liu, 1981; Kuzmic et al., 1992), inhibition kinetics of processive nucleic acid polymerases and nucleases (Althaus et al., 1993a, Althaus et al., 1993b; Althaus et al., 1994, Althaus et al., 1996; Chou et al., 1994), DNA sequence analysis (Qi et al., 2007), anti-sense strands base frequencies (Chou et al., 1996), analysis of codon usage (Chou and Zhang, 1992; Zhang and Chou, 1994) and in complicated network systems investigations (Diao et al., 2007; Gonzalez-Diaz et al., 2008, González-Díaz et al., 2007a). Recently, the “cellular automaton image” (Wolfram, 1984, Wolfram, 2002) has also been applied to study hepatitis B viral infections (Xiao et al., 2006a), HBV virus gene missense mutation (Xiao et al., 2005b), and visual analysis of SARS–CoV (Gao et al., 2006; Wang et al., 2005), as well as representing complicated biological sequences (Xiao et al., 2005a) and helping to identify protein attributes (Xiao and Chou, 2007; Xiao et al., 2006b). We have chosen the TIs for these QPDR models based on the previous work results with similar QSAR/QPDR models. Even if the TIs cannot be always interpreted, they demonstrate to encode the information that permits to create accurate QSAR/QPDR models.
Other interesting fields to apply the graph theory are the oncology and clinical proteomics. A classification model for discriminating prostate cancer patients from control group with connectivity indices where constructed by González-Díaz et al. (2007b). Vilar's group designed a QSAR model for alignment-free prediction of HBC biomarkers based on electrostatic potentials of protein pseudofolding HP-lattice networks (Vilar et al., 2008).
The actual work is proposing a new cancer/non-cancer classification model based on protein embedded/non-embedded star graph TIs such are the trace of connectivity matrices, Harary number, Wiener index, Gutman index, Schultz index, Moreau–Broto indices, Balaban distance connectivity index, Kier–Hall connectivity indices and Randic connectivity index. This classification can predict two types of cancer: HBC and HCC. The primary protein sequence is transformed in connectivity star graph's TIs that are used by a statistical linear method in order to construct an input-coded multi-target classification model.
2. Materials and methods
2.1. Protein set
Two sets of protein primary sequences are used: a set of 189 HBC/HCC cancer proteins (Sjoblom et al., 2006) and 865 non-cancer proteins (Dobson and Doig, 2005; Dobson et al., 2004). The list of cancer-related proteins in our work is the same with the list obtained by the Sjoblom group after the experimental analysis of 13,023 genes in 11 breast and 11 colorectal cancers.
2.2. Star graph TIs
Each protein sequence was transformed in a star graph, where the amino acids are the vertices (nodes), connected in a specific sequence by the peptide bonds. The star graph is a special case of trees with N vertices where one has got N−1 degrees of freedom and the remaining N−1 vertices have got one single degree of freedom (Harary, 1969). Each of the 20 possible branches (“rays”) of the star contains the same amino acid type and the star centre is a non-amino acid vertex.
A protein can be represented by diverse forms of graphs, which can be associated with distinct distance matrices. The best method to construct a standard star graph is the following: each amino acid/vertex holds the position in the original sequence and the branches are labelled by alphabetical order of the 3-letter amino acid code (Randic et al., 2007). The graph is embedded if the initial sequence connectivity in the protein chain is included. Figs. 1 A and B present the non-embedded/embedded star graphs of PRPS1 using the alphabetical order of one-letter amino acid code. Thus, the primary structure of protein chains are transformed in the correspondent Star graphs invariant TIs. The resulted graphs are not depending on the three-dimensional structure or the shape of the protein.
Fig. 1.
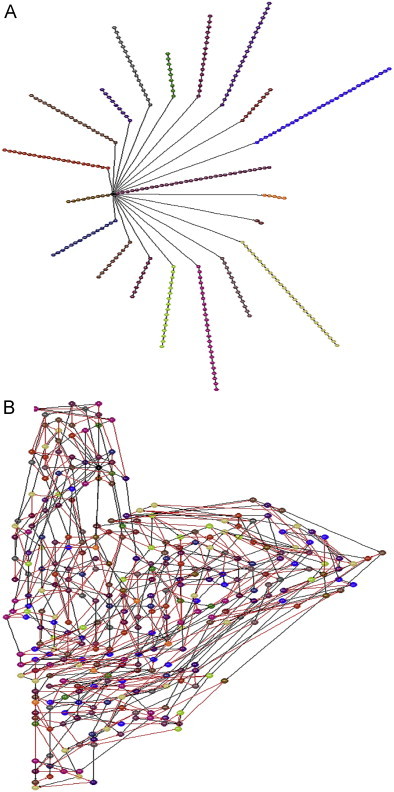
(A) The non-embedded star graphs for PRPS1 and (B) the embedded star graphs for PRPS1.
The comparison of the graphs is made by using the corresponding connectivity matrix, distance matrix and degree matrix. The matrices of the connectivity in the sequence and in the star graph are combined in the case of the embedded graph. These matrices and the normalized ones are the base of the TIs calculation.
The conversion of the amino acid sequences in star graph TIs was made by using sequence to star networks (S2SNet) application, developed by our group (Munteanu and Gonzáles-Diáz, 2008). S2SNet is based on wxPython (Rappin and Dunn, 2006) for the GUI application and has Graphviz (Koutsofios and North, 1993) as a graphics back-end. The present calculations are characterized by embedded and non-embedded TIs, no weights, Markov normalization and power of matrices/indices (n) up to 5. The results file contains the following TIs (Todeschini and Consonni, 2002):
-
•
Trace of the n connectivity matrices (trn) or the spectral moments:
where n=0–power limit, M=graph connectivity matrix (i∗i dimension); ii=ith diagonal element;(1) -
•
Harary number (H) or the reciprocal distance sum index:
where dij are the elements of the distance matrix and mij are the elements of the M connectivity matrix;(2) -
•
Wiener index (W) or the sum of the numbers of edges in the shortest paths in a graph between all pairs of amino acids in a protein:
(3) -
•
Gutman TI (S 6):
where degi are the elements of the degree matrix;(4) -
•
Schultz TI (non-trivial part) (S):
(5) -
•
Balaban distance connectivity index (J) or average distance sum connectivity index (measures the graph ramification):
where nodes+1=AA numbers/node number in the star graph+origin, Σk dik is the node distance degree;(6) -
•
Kier–Hall connectivity indices (n X):
(7) (8) (9) (10) (11) -
•
Randic connectivity index (1 X):
(12)
These TIs and other derivate ones will be used in the next step to construct a cancer/non-cancer classification model by linear statistical methods.
2.3. Statistical analysis
An input-coded multi-target classification model was created with general discriminant analysis (GDA) method (Kowalski and Wold, 1982; Van Waterbeemd, 1995), STATISTICA 6.0 package (StatSoft.Inc., 2002). This model can predict if a protein is HBC or HCC-related using a single equation. For this reason, in addition to the 30 star graph embedded and non-embedded TIs are introduced other two types of continuous predictors (attributes) encoded specific information about each cancer types as following: 30 products of the HBC/HCC cancer probability with the embedded/non-embedded TIs (pTI=probHBC/HCC*TI) and 30 differences between the same TIs and the average of the TIs for each type of cancer [dTI=TI–average(TI)HBC/HCC]. The cancer probabilities represent the fractions of proteins HBC/HCC-related from the entire Sjöblom's proteins (cancer proteins) and have values of 0.639 (HBC) and 0.361 (HCC). For each protein there are two cases corresponding to both types of cancer. The dependent variable (CancerOrNot) takes 1 for cancer and 0 for non-cancer and the cross-validation (CV) variable has two values (train and val). The best CV methods to examine a predictor are the following: independent dataset test, subsampling test, and jackknife test (Chou and Zhang, 1995). Chou and Shen, 2007, Chou and Shen, 2008 have shown that only the jackknife test has the least arbitrariness . Thus, the jackknife test has been increasingly used by investigators to examine the accuracy of various predictors (Chen and Li, 2007a, Chen and Li, 2007b; Diao et al., 2007; Ding et al., 2007; Jiang et al., 2008; Li and Li, 2008; Lin, 2008; Niu et al., 2006; Xiao and Chou, 2007; Zhang et al., 2008; Zhou et al., 2007). In the actual work, the independent data test is used by splitting the data at random in a training series (train, 75%) used for model construction and a prediction one (val, 25%) for model validation (the CV column is filled by repeating 6 train and 2 val). All independent variables are standardized prior to model construction.
The general QPDR formula contains embedded and non-embedded TIs, pTIs and dTIs:
| (13) |
where C/nC−score is the continue score value for the cancer/non-cancer classification (HBC or HCC), c 1–cn are the TIs coefficients (n=number of TIs), cn–cm pTIs coefficients (n<m; m–n=number of pTIs), cm–c 0 dTIs coefficients (m<0; 0–m=number of dTIs) and c 0 is the independent term. We inspected the percentage of good classification and the number of variables to be explored in order to avoid over-fitting or chance correlation. The forward model type was tested for the embedded, non-embedded and both data, including TIs, pTIs, dTIs and all indices.
In addition, the Dobson's set is use to select a subset of 61 non-cancer proteins with cancer probability between 0.3 and 0.5 in order to proceed 17 single amino acid mutations with log-odds PAM250 (Dayhoff, 1978) greater or equal with 2 (see Table 1 ). The best classification model predicted the probability of presence in HBC/HCC cancer for any of these mutated proteins and the results were analysed with two-way joining clustering analysis method (tw-JCA) from STATISTICA (StatSoft.Inc., 2002).
Table 1.
Single amino acid mutations and the corresponding log-odd PAM250 value.
| Original AA | Mutated AA | log-odd PAM250 | Notation |
|---|---|---|---|
| D | N | 2 | D→N/2DN |
| E | Q | 2 | E→Q/2EQ |
| F | L | 2 | F→L /2FL |
| H | N | 2 | H→N/2HN |
| H | R | 2 | H→R/2HR |
| L | I | 2 | L→I/2LI |
| M | I | 2 | M→I/2MI |
| Q | D | 2 | Q→D/2QD |
| V | L | 2 | V→L/2VL |
| V | M | 2 | V→M/2VM |
| W | R | 2 | W→R/2WR |
| E | D | 3 | E→D/3ED |
| H | Q | 3 | H→Q/3HQ |
| K | R | 3 | K→R/3KR |
| M | L | 4 | M→L/4ML |
| V | I | 4 | V→I/4VI |
| Y | F | 7 | Y→F/7YF |
3. Results and discussions
Fifteen classification models were tested with the aim of finding the best GDA equation which is able to discriminate between proteins related with HBC and HCC. The attributes include 30 embedded/non-embedded star graph TIs obtained with S2SNet application and other 60 composed predictors, pTIs and dTIs. The values obtained for the training/predicting accuracies with the forward stepwise method are presented in Table 2 .
Table 2.
Training/predicting accuracies of Cancer (C)/non-cancer (nC) models using embedded (E) and non-embedded (nE) star graph TIs, pTIs and dTIs.
| Star graph type | Attributes | Train |
Cross-validation |
Total |
Eq. vars. | ||||||
|---|---|---|---|---|---|---|---|---|---|---|---|
| nC (%) | C (%) | Total (%) | nC (%) | C (%) | Total (%) | nC (%) | C (%) | Total (%) | |||
| nE | pTI | 90.4 | 69.4 | 88.5 | 91.4 | 66.0 | 89.1 | 90.7 | 68.6 | 88.7 | 4 |
| TI, pTI | 90.4 | 68.1 | 88.3 | 90.8 | 66.0 | 88.5 | 90.5 | 67.5 | 88.4 | 5 | |
| dTI | 86.0 | 79.9 | 85.4 | 87.0 | 74.5 | 85.9 | 86.2 | 78.5 | 85.5 | 2 | |
| TI, dTI | 88.1 | 74.3 | 86.9 | 88.9 | 72.3 | 87.4 | 88.3 | 73.8 | 87.0 | 4 | |
| TI, pTI, dTI | 91.1 | 66.0 | 88.8 | 91.8 | 61.7 | 89.1 | 91.3 | 64.9 | 88.9 | 6 | |
| E | pTIe | 92.3 | 70.1 | 90.3 | 93.1 | 70.2 | 91.0 | 92.5 | 70.2 | 90.5 | 6 |
| TIe, pTIe | 92.7 | 69.4 | 90.6 | 93.3 | 70.2 | 91.2 | 92.8 | 69.6 | 90.7 | 6 | |
| dTIe | 88.1 | 78.5 | 87.3 | 88.3 | 76.6 | 87.2 | 88.2 | 78.0 | 87.3 | 4 | |
| TIe, dTIe | 91.4 | 75.7 | 89.9 | 91.8 | 74.5 | 90.3 | 91.5 | 75.4 | 90.0 | 5 | |
| TIe, pTIe, dTIe | 93.1 | 68.1 | 90.8 | 93.3 | 66.0 | 90.8 | 93.1 | 67.5 | 90.8 | 8 | |
| nE and E | pTI, pTIe | 90.2 | 70.1 | 88.4 | 91.2 | 68.1 | 89.1 | 90.5 | 69.6 | 88.6 | 4 |
| TI, TIe, pTI, pTIe | 92.3 | 68.8 | 90.1 | 92.0 | 66.0 | 89.7 | 92.2 | 68.1 | 90.0 | 8 | |
| dTI, dTIe | 90.3 | 78.5 | 89.2 | 90.6 | 76.6 | 89.3 | 90.4 | 78.0 | 89.2 | 6 | |
| TI, TIe, dTI, dTIe | 90.9 | 72.9 | 89.3 | 91.4 | 72.3 | 89.7 | 91.1 | 72.8 | 89.4 | 7 | |
| TI, TIe, pTI, pTIe, dTI, dTIe | 92.3 | 68.8 | 90.1 | 92.2 | 70.2 | 90.3 | 92.3 | 69.1 | 90.2 | 8 | |
The forward stepwise selection variable method conjugated with the embedded TIs and dTIs provides the best results for our data set with values of correctly classified compounds of 89.9%, 90.3% and 90.0% for the training, CV and full sets, respectively, and using only six/five parameters/variables (Eq. (14)). The embedded TIs have the name of the non-embedded ones plus “e” as suffix. The simple linear mathematical form of the model has been chosen in the absence of prior information.
| (14) |
where N is the number of cases (C and nC), Rc is the canonical regression coefficient, U is the Wilk's statistics, F is the Fisher's statistics and p is the p-level (probability of error).
The above results are typically considered as excellent in the literature for LDA–QPDR/QSAR models (Castillo-Garit et al., 2008; Estrada and Molina, 2001; Marrero-Ponce et al., 2004; Morales et al., 2006; Vilar et al., 2008). In order to check the variation of this model with the training/CV sets, we carried on a CV study by using ten totally random sets, including the initial one from the actual model (with the same 75% training and 25% CV). The classification values are presented in Table S1 from the supplementary material and show an average of 90.2% for training and 89.2% for CV. These values demonstrate the stability of the model with the selection of the classification sets.
In order to illustrate the performance of the approach when applied to a single set of cancer related proteins (e.g. either breast or colon), we obtained two equations, one for HBC and other for HCC. Therefore, we have to consider that the Eq. (14) represents an input-coded multi-target classification model that can evaluate if a protein is HBC or HCC-related by using the HBC or HCC average J e and X2e values (contained in the d J e and d X2 e differences). Eq. (14) can be reduced to two different equations, one for each type of cancer (HBC and HCC):
| (14a) |
| (14b) |
The detailed classification results for each type of cancer obtained with Eqs. (14a), (14b) are presented in Table 3 .
Table 3.
Accuracy of input-coded multi-target and individual HBC and HCC classification models based on the embedded TIs (TIe+dTIe and pTIe).
| Eq. | Cancer | Correct | Incorrect | Accuracy (%) |
|---|---|---|---|---|
| TIe, dTIe | ||||
| 14 | Both | 307 | 1795 | 90.0 |
| 14a | HBC | 168 | 880 | 91.8 |
| 14b | HCC | 139 | 915 | 88.2 |
| pTIe | ||||
| 15 | Both | 277 | 1825 | 90.5 |
| 15a | HBC | 170 | 878 | 91.8 |
| 15b | HCC | 107 | 947 | 89.2 |
A similar input-coded multi-target classification model was obtained by using the forward stepwise method and the embedded pTIs and provides values of correctly classified compounds of 90.3, 91.0 and 90.5 for the training, CV and full sets, respectively (using seven/six parameters/variables) (Eq. (15)).
| (15) |
In order to evaluate if a protein is HBC or HCC-related, it is necessary to use the HBC or HCC probability inside the pTIs products. The classification values obtained for the individual equations are presented in Table 3. The equations obtained are the following:
| (15a) |
| (15b) |
Eqs. (14), (15) show similar results when the input data is containing probability of cancer (products with TIs) or the TIs averages for each type of cancer (differences with TIs). In general, in the case of embedded, non-embedded and both indices, we obtained better results with dTIs compared with the pTIs (not mixed with the original TIs). This difference can be explained by a superior recover of the cancer-related protein sequence information in the case of the differences between the original TIs and the average of them for each type of cancer (dTIs) compared with the products of the original TIs and the cancer type probability (pTIs). Thus, we can conclude that the average of star graph structure for each type of cancer (dTIs) is described better the actual QPDR model compared with the composition of the data sets for each type of cancer that generates the cancer probabilities. In addition, Table 2 shows that better results are obtained using the original TIs and the derived ones (pTIs and dTIs) compared with the isolated TIs/pTIs/dTIs. This difference can be explained be the fact that each set of indices can contains different parts of the protein information that is cancer-related. Therefore, the use of all these indices will sum all this information in a better QPDR model.
Another interesting aspect is the type of the indices (original or derived from the original) that are more frequent in all models presented in Table S2 from supplementary material. Thus, we can observe the importance of the Wiener index (W) and Kier–Hall connectivity index X5 for the models based on the non-embedded TIs. The embedded TIs models contain more frequent the trace of the graph/sequence connectivity matrixes tr 3 and the non-trivial part of the Schultz TI S (W is based on the distance matrix, X5 and S on the degree matrix, and tr 3 on the connectivity matrix). The most important type of index that is present in both embedded and non-embedded TI equations is J, the Balaban distance connectivity index based on the node distance degree information. In order to compare two equations with the same number of TIs, we have chosen the embedded models with pTIe and {TIe, pTIe} that contain six variables and reduced the common terms (based on tr 3, S and J). Thus, we can observe that the addition of the TIe to the pTIe will shift the preference from the low order traces (p tr 0e, p tr 2e) and Kier–Hall index (p X2e) to high order trace (tr 5e), Harary number (He) and Gutman TI (S6e).
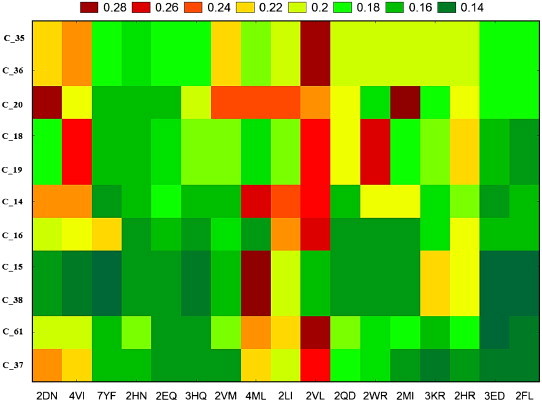
The first embedded TIs & dTIs model was chosen to estimate the cancer probability for proteins mutants of non-cancer-related proteins. These values were analysed with tw-JCA using 61 mutated proteins and 17 types of single amino acid mutations. In the case of HBC, we obtained 215 data groups, called input blocks. To detect the larger variability regions (mutants) we computed a tw-JCA partition of input blocks (rearrange of blocks) setting the threshold value of variability at StDv/2 (see Fig. 2 ). The value obtained was 0.059. The 215 input blocks are regrouped, for similarity, into 11 output blocks (see Tables S3 and S4 in the supplementary material). We can observe that the proteins with number 24 to number 48 are very susceptible to become HBC-related proteins for all studied mutations. The plot corresponding to the reduced values of the reordered data matrix (Table S4) is presented in Fig. 3 . On the other hand, we carried out the same study for the HCC mutated proteins and found different susceptible proteins, with visible lower probability to be HCC-related (Fig. 4 ). The 184 input blocks were regrouped, for similarity, into 11 output blocks (StDv/2=0.050) (see Tables S5 and S6 in the supplementary material). The reduced data from Table S6 are presented as a plot in Fig. 5 . The tw-JCA partition obtained in this way is statistically significant as reported by other authors that used this method to reach similar goals (Ferino et al., 2008).
Fig. 2.
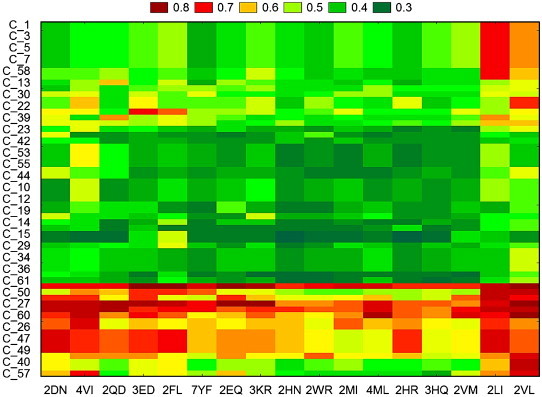
Graphical representation of two-way joining cluster analysis of the HBC probability after the mutations.
Fig. 3.
Graphical representation of reduced values of the reordered data matrix by tw–JCA method for HBC probability after the mutations.
Fig. 4.
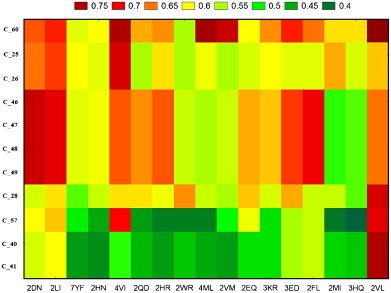
Graphical representation of two-way joining cluster analysis of the HCC probability after the mutations.
Fig. 5.
Graphical representation of reduced values of the reordered data matrix by tw–JCA method for HCC probability after the mutations.
One interesting non-cancer chain protein is 1QRK B, the human coagulation factor XIII with strontium bound in the ion site (Fox et al., 1999), with eight single amino acid mutations that present HBC probability up to 71% as following: 70.8% for V→L, 68.8% for V→I, 62.0% for L→I, 59.3% for D→N, 58.3% for E→Q, 55.9% for F→L, 54.8% for E→D and 51.0% for V→M. The most persistent mutation (log-odd PAM250=4), valine (V) to isoleucine (M), can be considered as the most dangerous one. The main calcium/strontium binding site within each monomer involves the main chain oxygen atom of Ala-457, and also the side chains from residues Asn-436, Asp-438, Glu-485, and Glu-490. The mutations of Glu (E) in Q and D can affect the capacity of binding metals and the normal biological activity. This coagulation factor XIII is a transglutaminase which stabilizes blood clots by covalently cross-linking fibrin, being essential for normal haemostasis. FXIII deficiency due to the genetic mutations results in a life-long bleeding disorder with added complications in wound healing and tissue repair (Anwar et al., 1998). In addition, the abundant fibrinogen present in the tumor connective tissue might contribute to the structural integrity of breast or colon tumor tissues (Costantini et al., 1991; Takahashi et al., 2000; Yee et al., 1994). We can observe that, in general, the natural mutations with higher PAM250 values are less frequent even for 1QRK B (Y→F with PAM250 of 7 is absent) because we cannot create a direct relation between the PAM250 natural amino acid mutation frequency and the influence of the mutations in these types of cancer.
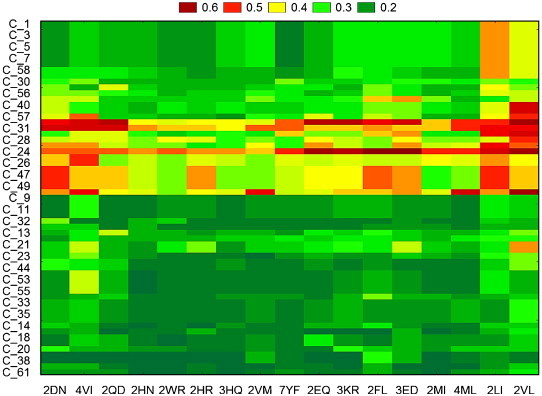
The probability for a cancer-related protein to turn into a non-cancer one was studied too. For each type of cancer, ten HBC/HCC-related proteins where mutated using the same PAM250 values. The tw-JCA plots are presented in Fig. 6 (for HBC) and Fig. 7 (for HCC), and correspond to data in Tables S7 and S8 from the supplementary material. The results did not show important probability to obtain a HBC/HCC-related protein by using single PAM250 natural mutations. Activin beta E (INHBE, C_5) has the highest probability (around 50%) to turn into a HBC-related protein after almost all the mutations (Fig. 6 and Table S7).
Fig. 6.
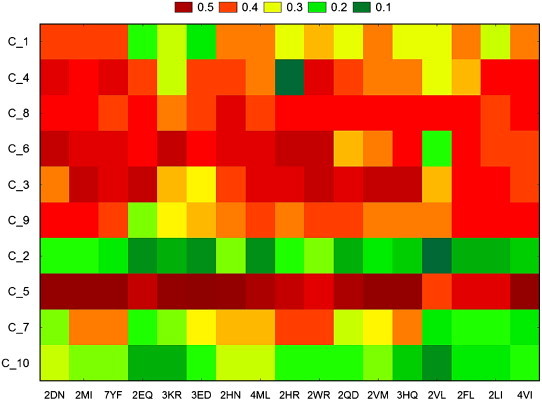
Graphical representation of two-way joining cluster analysis of the probability of the mutated HBC-related proteins to turn into non-cancer proteins.
Fig. 7.
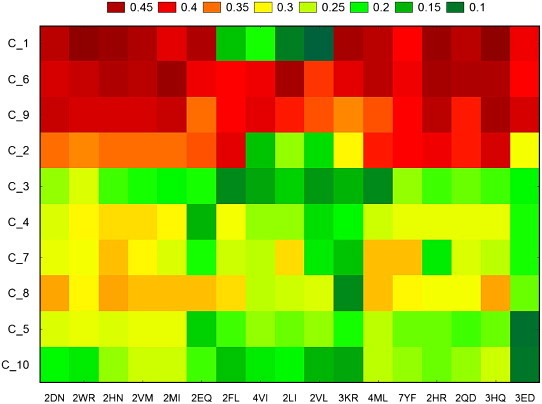
Graphical representation of two-way joining cluster analysis of the probability of the mutated HCC-related proteins to turn into non-cancer proteins.
4. Conclusions
This study is proposing two cancer/non-cancer input-coded multi-target classification models for HBC and HCC using the star network TIs of the protein amino acid sequences. The results prove the excellent predictive ability (90.0%) of the simple and fast star network TIs and GDA statistics linear models in the case of the actual protein model. In addition, the prediction of cancer probability for mutated proteins was calculated. The human coagulation factor XIII (1QRK B), that normally do not generate HBC, if suffer several mutations, can become a HBC-related protein.
This work can help in oncology proteomics or serve as a model for other studies. In addition, S2SNet application is demonstrating his capacity to transform simple protein sequences in TIs and to be the base of numerous protein studies.
Acknowledgments
Cristian R. Munteanu thanks the FCT (Portugal) for support from Grant SFRH/BPD/24997/2005. González-Díaz H. acknowledges program Isidro Parga Pondal of Xunta de Galicia by financial support of a tenure-eligible research position at the Faculty of pharmacy, University of Santiago de Compostela (Spain).
Footnotes
Supplementary data associated with this article can be found in the online version at doi:10.1016/j.jtbi.2008.11.017.
Contributor Information
Cristian Robert Munteanu, Email: muntisa@gmail.com.
Alexandre L. Magalhães, Email: almagalh@fc.up.pt.
Eugenio Uriarte, Email: eugenio.uriarte@usc.es.
Humberto González-Díaz, Email: humberto.gonzales@usc.es, humbertogd@gmail.com.
Appendix A. Supporting Information
Supporting Information A
References
- Agüero-Chapin G., Gonzalez-Diaz H., Molina R., Varona-Santos J., Uriarte E., Gonzalez-Diaz Y. Novel 2D maps and coupling numbers for protein sequences. The first QSAR study of polygalacturonases; isolation and prediction of a novel sequence from Psidium guajava L. FEBS Lett. 2006;580:723–730. doi: 10.1016/j.febslet.2005.12.072. [DOI] [PubMed] [Google Scholar]
- Althaus I.W., Chou J.J., Gonzales A.J., Diebel M.R., Chou K.C., Kezdy F.J., Romero D.L., Aristoff P.A., Tarpley W.G., Reusser F. Steady-state kinetic studies with the non-nucleoside HIV-1 reverse transcriptase inhibitor U-87201E. J. Biol. Chem. 1993;268:6119–6124. [PubMed] [Google Scholar]
- Althaus I.W., Chou J.J., Gonzales A.J., Diebel M.R., Chou K.C., Kezdy F.J., Romero D.L., Aristoff P.A., Tarpley W.G., Reusser F. Kinetic studies with the nonnucleoside HIV-1 reverse transcriptase inhibitor U-88204E. Biochemistry. 1993;32:6548–6554. doi: 10.1021/bi00077a008. [DOI] [PubMed] [Google Scholar]
- Althaus I.W., Chou J.J., Gonzales A.J., LeMay R.J., Deibel M.R., Chou K.C., Kezdy F.J., Romero D.L., Thomas R.C., Aristoff P.A. Steady-state kinetic studies with the polysulfonate U-9843, an HIV reverse transcriptase inhibitor. Experientia. 1994;50:23–28. doi: 10.1007/BF01992044. [DOI] [PubMed] [Google Scholar]
- Althaus I.W., Chou K.C., Lemay R.J., Franks K.M., Deibel M.R., Kezdy F.J., Resnick L., Busso M.E., So A.G., Downey K.M., Romero D.L., Thomas R.C., Aristoff P.A., Tarpley W.G., Reusser F. The benzylthio-pyrimidine U-31, 355, a potent inhibitor of HIV-1 reverse transcriptase. Biochem. Pharmacol. 1996;51:743–750. doi: 10.1016/0006-2952(95)02390-9. [DOI] [PubMed] [Google Scholar]
- Anwar R., Miloszewski K.J., Markham A.F. New splicing mutations in the human factor XIIIA gene, each producing multiple mutant transcripts of varying abundance. Thromb. Haemost. 1998;79:1151–1156. [PubMed] [Google Scholar]
- Bielinska-Waz D., Nowak W., Waz P., Nandy A., Clark T. Distribution moments of 2D-graphs as descriptors of DNA sequences. Chem. Phys. Lett. 2007;443:408–413. [Google Scholar]
- Castillo-Garit J.A., Marrero-Ponce Y., Torrens F., Garcia-Domenech R., Romero-Zaldivar V. Bond-based 3D-chiral linear indices: theory and QSAR applications to central chirality codification. J. Comput. Chem. 2008;29(15):2500–2512. doi: 10.1002/jcc.20964. [DOI] [PubMed] [Google Scholar]
- Costantini V., Zacharski L.R., Memoli V.A., Kisiel W., Kudryk B.J., Rousseau S.M. Fibrinogen deposition without thrombin generation in primary human breast cancer tissue. Cancer Res. 1991;51:349–353. [PubMed] [Google Scholar]
- Chen Y.L., Li Q.Z. Prediction of the subcellular location of apoptosis proteins. J. Theor. Biol. 2007;245:775–783. doi: 10.1016/j.jtbi.2006.11.010. [DOI] [PubMed] [Google Scholar]
- Chen Y.L., Li Q.Z. Prediction of apoptosis protein subcellular location using improved hybrid approach and pseudo amino acid composition. J. Theor. Biol. 2007;248:377–381. doi: 10.1016/j.jtbi.2007.05.019. [DOI] [PubMed] [Google Scholar]
- Chou K.C. Graphical rules in steady and non-steady enzyme kinetics. J. Biol. Chem. 1989;264:12074–12079. [PubMed] [Google Scholar]
- Chou K.C. Review: applications of graph theory to enzyme kinetics and protein folding kinetics. Steady and non-steady state systems. Biophys. Chem. 1990;35:1–24. doi: 10.1016/0301-4622(90)80056-d. [DOI] [PubMed] [Google Scholar]
- Chou K.C., Forsen S. Graphical rules for enzyme-catalyzed rate laws. Biochem. J. 1980;187:829–835. doi: 10.1042/bj1870829. [DOI] [PMC free article] [PubMed] [Google Scholar]
- Chou K.C., Liu W.M. Graphical rules for non-steady state enzyme kinetics. J. Theor. Biol. 1981;91:637–654. doi: 10.1016/0022-5193(81)90215-0. [DOI] [PubMed] [Google Scholar]
- Chou K.C., Shen H.B. Recent progress in protein subcellular location prediction. Anal. Biochem. 2007;370:1–16. doi: 10.1016/j.ab.2007.07.006. [DOI] [PubMed] [Google Scholar]
- Chou K.C., Shen H.B. Cell-PLoc: a package of web-servers for predicting subcellular localization of proteins in various organisms. Nat. Protocols. 2008;3:153–162. doi: 10.1038/nprot.2007.494. [DOI] [PubMed] [Google Scholar]
- Chou K.C., Zhang C.T. Diagrammatization of codon usage in 339 HIV proteins and its biological implication. AIDS Res. Hum. Retroviruses. 1992;8:1967–1976. doi: 10.1089/aid.1992.8.1967. [DOI] [PubMed] [Google Scholar]
- Chou K.C., Zhang C.T. Prediction of protein structural classes. Crit. Rev. Biochem. Mol. Biol. 1995;30:275–349. doi: 10.3109/10409239509083488. [DOI] [PubMed] [Google Scholar]
- Chou K.C., Kezdy F.J., Reusser F. Review: steady-state inhibition kinetics of processive nucleic acid polymerases and nucleases. Anal. Biochem. 1994;221:217–230. doi: 10.1006/abio.1994.1405. [DOI] [PubMed] [Google Scholar]
- Chou K.C., Zhang C.T., Elrod D.W. Do antisense proteins exist? J. Protein Chem. 1996;15:59–61. doi: 10.1007/BF01886811. [DOI] [PubMed] [Google Scholar]
- Dayhoff, M.O., 1978. A model of evolutionary change. In: Dayhoff, M.O. (Ed.), Proteins in Atlas of Protein Sequence and Structure, vol. 5 (Suppl. 3), Georgetown University Medical Center, National Biomedical Research Foundation, pp. 345–358.
- Devillers J., Balaban A.T. Gordon and Breach; The Netherlands: 1999. Topological Indices and Related Descriptors in QSAR and QSPR. [Google Scholar]
- Diao Y., Li M., Feng Z., Yin J., Pan Y. The community structure of human cellular signaling network. J. Theor. Biol. 2007;247:608–615. doi: 10.1016/j.jtbi.2007.04.007. [DOI] [PMC free article] [PubMed] [Google Scholar]
- Ding Y.S., Zhang T.L., Chou K.C. Prediction of protein structure classes with pseudo amino acid composition and fuzzy support vector machine network. Protein. Pept. Lett. 2007;14:811–815. doi: 10.2174/092986607781483778. [DOI] [PubMed] [Google Scholar]
- Dobson P.D., Doig A.J. Predicting enzyme class from protein structure without alignments. J. Mol. Biol. 2005;345:187–199. doi: 10.1016/j.jmb.2004.10.024. [DOI] [PubMed] [Google Scholar]
- Dobson P.D., Cai Y.D., Stapley B.J., Doig A.J. Prediction of protein function in the absence of significant sequence similarity. Curr. Med. Chem. 2004;11:2135–2142. doi: 10.2174/0929867043364702. [DOI] [PubMed] [Google Scholar]
- Estrada E., Molina E. 3D connectivity indices in QSPR/QSAR studies. J. Chem. Inf. Comput. Sci. 2001;41:791–797. doi: 10.1021/ci000156i. [DOI] [PubMed] [Google Scholar]
- Ferino, G., Gonzalez-Diaz, H., Delogu, G., Podda, G., Uriarte, E., 2008. Using spectral moments of spiral networks based on PSA/mass spectra outcomes to derive quantitative proteome-disease relationships (QPDRs) and predicting prostate cancer. Biochem. Biophys. Res. Commun., doi:10.1016/j.bbrc.2008.05.071. [DOI] [PubMed]
- Fox B.A., Yee V.C., Pedersen L.C., Le Trong I., Bishop P.D., Stenkamp R.E., Teller D.C. Identification of the calcium binding site and a novel ytterbium site in blood coagulation factor XIII by X-ray crystallography. J. Biol. Chem. 1999;274:4917–4923. doi: 10.1074/jbc.274.8.4917. [DOI] [PubMed] [Google Scholar]
- Gao L., Ding Y.S., Dai H., Shao S.H., Huang Z.D., Chou K.C. A novel fingerprint map for detecting SARS–CoV. J. Pharm. Biomed. Anal. 2006;41:246–250. doi: 10.1016/j.jpba.2005.09.031. [DOI] [PMC free article] [PubMed] [Google Scholar]
- González-Díaz H., Sanchez-Gonzalez A., Gonzalez-Diaz Y. 3D-QSAR study for DNA cleavage proteins with a potential anti-tumor ATCUN-like motif. J. Inorg. Biochem. 2006;100:1290–1297. doi: 10.1016/j.jinorgbio.2006.02.019. [DOI] [PubMed] [Google Scholar]
- González-Díaz H., Vilar S., Santana L., Uriarte E. Medicinal chemistry and bioinformatics—current trends in drugs discovery with networks topological indices. Curr. Top. Med. Chem. 2007;7:1025–1039. doi: 10.2174/156802607780906771. [DOI] [PubMed] [Google Scholar]
- González-Díaz H., Ferino G., Podda G., Uriarte E. Discriminating prostate cancer patients from control group with connectivity indices. ECSOC. 2007;11 G1:1–10. [Google Scholar]
- González-Díaz H., Bonet I., Terán C., de Clercq E., Bello R., García M., Santana L., Uriarte E. ANN–QSAR model for selection of anticancer leads from structurally heterogeneous series of compounds. Eur. J. Med. Chem. 2007;42:580–585. doi: 10.1016/j.ejmech.2006.11.016. [DOI] [PubMed] [Google Scholar]
- Gonzalez-Diaz H., Gonzalez-Diaz Y., Santana L., Ubeira F.M., Uriarte E. Proteomics, networks and connectivity indices. Proteomics. 2008;8:750–778. doi: 10.1002/pmic.200700638. [DOI] [PubMed] [Google Scholar]
- Jemal A., Siegel R., Ward E., Hao Y., Xu J., Murray T., Thun M.J. Cancer statistics. CA Cancer J. Clin. 2008;58:71–96. doi: 10.3322/CA.2007.0010. [DOI] [PubMed] [Google Scholar]
- Jiang X., Wei R., Zhang T., Gu Q. Using the concept of Chou's pseudo amino acid composition to predict apoptosis proteins subcellular location: an approach by approximate entropy. Protein Pept. Lett. 2008;15:392–396. doi: 10.2174/092986608784246443. [DOI] [PubMed] [Google Scholar]
- Koutsofios E., North S.C. AT&T Bell Laboratories; Murray Hill, NJ, USA: 1993. Drawing Graphs with Dot. [Google Scholar]
- Kowalski R.D., Wold S. Pattern recognition in chemistry. In: Krishnaiah P.R., Kanal L.N., editors. Handbook of Statistic. North-Holland; Amsterdam: 1982. pp. 673–697. [Google Scholar]
- Kuzmic P., Ng K.Y., Heath T.D. Mixtures of tight-binding enzyme inhibitors. Kinetic analysis by a recursive rate equation. Anal. Biochem. 1992;200:68–73. doi: 10.1016/0003-2697(92)90278-f. [DOI] [PubMed] [Google Scholar]
- Li F.M., Li Q.Z. Using pseudo amino acid composition to predict protein subnuclear location with improved hybrid approach. Amino Acids. 2008;34:119–125. doi: 10.1007/s00726-007-0545-9. [DOI] [PubMed] [Google Scholar]
- Liao B., Ding K. Graphical approach to analyzing DNA sequences. J. Comput. Chem. 2005;26:1519–1523. doi: 10.1002/jcc.20287. [DOI] [PubMed] [Google Scholar]
- Liao B., Wang T.M. Analysis of similarity/dissimilarity of DNA sequences based on nonoverlapping triplets of nucleotide bases. J. Chem. Inf. Comput. Sci. 2004;44:1666–1670. doi: 10.1021/ci034271f. [DOI] [PubMed] [Google Scholar]
- Lin H. The modified Mahalanobis discriminant for predicting outer membrane proteins by using Chou's pseudo amino acid composition. J. Theor. Biol. 2008;252:350–356. doi: 10.1016/j.jtbi.2008.02.004. [DOI] [PubMed] [Google Scholar]
- Marrero-Ponce Y., Diaz H.G., Zaldivar V.R., Torrens F., Castro E.A. 3D-chiral quadratic indices of the ‘molecular pseudograph's atom adjacency matrix’ and their application to central chirality codification: classification of ACE inhibitors and prediction of sigma-receptor antagonist activities. Bioorg. Med. Chem. 2004;12:5331–5342. doi: 10.1016/j.bmc.2004.07.051. [DOI] [PubMed] [Google Scholar]
- Morales A.H., Cabrera Perez M.A., Gonzalez M.P. A radial-distribution-function approach for predicting rodent carcinogenicity. J. Mol. Model. 2006;12:769–780. doi: 10.1007/s00894-005-0088-5. [DOI] [PubMed] [Google Scholar]
- Munteanu, C.R. and Gonzáles-Diáz H., 2008. S2SNet—Sequence to Star Network, Reg. No. 03/2008/1338, Santiago de Compostela, Spain.
- Niu B., Cai Y.D., Lu W.C., Li G.Z., Chou K.C. Predicting protein structural class with AdaBoost Learner. Protein Pept. Lett. 2006;13:489–492. doi: 10.2174/092986606776819619. [DOI] [PubMed] [Google Scholar]
- Prado-Prado F.J., González-Díaz H., Martinez de la Vega O., Ubeira F.M., Chou K.C. Unified QSAR approach to antimicrobials. Part 3: first multi-tasking QSAR model for input-coded prediction, structural back-projection, and complex networks clustering of antiprotozoal compounds. Bioorg. Med. Chem. 2008;16:5871–5880. doi: 10.1016/j.bmc.2008.04.068. [DOI] [PubMed] [Google Scholar]
- Qi X.Q., Wen J., Qi Z.H. New 3D graphical representation of DNA sequence based on dual nucleotides. J. Theor. Biol. 2007;249:681–690. doi: 10.1016/j.jtbi.2007.08.025. [DOI] [PMC free article] [PubMed] [Google Scholar]
- Randic M. Condensed representation of DNA primary sequences. J. Chem. Inf. Comput. Sci. 2000;40:50–56. doi: 10.1021/ci990084z. [DOI] [PubMed] [Google Scholar]
- Randic M., Balaban A.T. On a four-dimensional representation of DNA primary sequences. J. Chem. Inf. Comput. Sci. 2003;43:532–539. doi: 10.1021/ci020051a. [DOI] [PubMed] [Google Scholar]
- Randic M., Basak S.C. Characterization of DNA primary sequences based on the average distances between bases. J. Chem. Inf. Comput. Sci. 2001;41:561–568. doi: 10.1021/ci0000981. [DOI] [PubMed] [Google Scholar]
- Randic M., Vracko M., Nandy A., Basak S.C. On 3-D graphical representation of DNA primary sequences and their numerical characterization. J. Chem. Inf. Comput. Sci. 2000;40:1235–1244. doi: 10.1021/ci000034q. [DOI] [PubMed] [Google Scholar]
- Randic M., Zupan J., Vikic-Topic D. On representation of proteins by star-like graphs. J. Mol. Graph Model. 2007:290–305. doi: 10.1016/j.jmgm.2006.12.006. [DOI] [PubMed] [Google Scholar]
- Rappin N., Dunn R. Manning Publications Co.; Greenwich, CT: 2006. wxPython in Action. [Google Scholar]
- Sjoblom T., Jones S., Wood L.D., Parsons D.W., Lin J., Barber T.D., Mandelker D., Leary R.J., Ptak J., Silliman N., Szabo S., Buckhaults P., Farrell C., Meeh P., Markowitz S.D., Willis J., Dawson D., Willson J.K., Gazdar A.F., Hartigan J., Wu L., Liu C., Parmigiani G., Park B.H., Bachman K.E., Papadopoulos N., Vogelstein B., Kinzler K.W., Velculescu V.E. The consensus coding sequences of human breast and colorectal cancers. Science. 2006;314:268–274. doi: 10.1126/science.1133427. [DOI] [PubMed] [Google Scholar]
- StatSoft.Inc., 2002. STATISTICA (data analysis software system), version 6.0 〈www.statsoft.com.Statsoft〉.
- Takahashi H., Isobe T., Horibe S., Takagi J., Yokosaki Y., Sheppard D., Saito Y. Tissue transglutaminase, coagulation factor XIII, and the pro-polypeptide of von Willebrand factor are all ligands for the integrins alpha 9beta 1 and alpha 4beta 1. J. Biol. Chem. 2000;275:23589–23595. doi: 10.1074/jbc.M003526200. [DOI] [PubMed] [Google Scholar]
- Todeschini R., Consonni V. Wiley-VCH; New York: 2002. Handbook of Molecular Descriptors. [Google Scholar]
- Van Waterbeemd H. Discriminant Analysis for Activity Prediction. In: Van Waterbeemd H., editor. vol. 2. Wiley-VCH; New York: 1995. pp. 265–282. (Chemometric Methods in Molecular Design). [Google Scholar]
- Vilar, S., Gonzalez-Diaz, H., Santana, L., Uriarte, E., 2008. QSAR model for alignment-free prediction of human breast cancer biomarkers based on electrostatic potentials of protein pseudofolding HP-lattice networks. J. Comput. Chem. [DOI] [PubMed]
- Wang M., Yao J.S., Huang Z.D., Xu Z.J., Liu G.P., Zhao H.Y., Wang X.Y., Yang J., Zhu Y.S., Chou K.C. A new nucleotide-composition based fingerprint of SARS–CoV with visualization analysis. Med. Chem. 2005;1:39–47. doi: 10.2174/1573406053402505. [DOI] [PubMed] [Google Scholar]
- WHO, 2008. Cancer, World Health Organization, Fact Sheet No. 297 〈http://www.who.int/mediacentre/factsheets/fs297/en/〉.
- Wolfram S. Cellular automation as models of complexity. Nature. 1984;311:419–424. [Google Scholar]
- Wolfram S. Wolfram Media Inc.; Champaign, IL: 2002. A New Kind of Science. [Google Scholar]
- Xiao X., Chou K.C. Digital coding of amino acids based on hydrophobic index. Protein Pept. Lett. 2007;14:871–875. doi: 10.2174/092986607782110293. [DOI] [PubMed] [Google Scholar]
- Xiao X., Shao S., Ding Y., Huang Z., Chen X., Chou K.C. Using cellular automata to generate image representation for biological sequences. Amino Acids. 2005;28:29–35. doi: 10.1007/s00726-004-0154-9. [DOI] [PMC free article] [PubMed] [Google Scholar]
- Xiao X., Shao S., Ding Y., Huang Z., Chen X., Chou K.C. An application of gene comparative image for predicting the effect on replication ratio by HBV virus gene missense mutation. J. Theor. Biol. 2005;235:555–565. doi: 10.1016/j.jtbi.2005.02.008. [DOI] [PubMed] [Google Scholar]
- Xiao X., Shao S.H., Chou K.C. A probability cellular automaton model for hepatitis B viral infections. Biochem. Biophys. Res. Commun. 2006;342:605–610. doi: 10.1016/j.bbrc.2006.01.166. [DOI] [PubMed] [Google Scholar]
- Xiao X., Shao S., Ding Y., Huang Z., Chou K.C. Using cellular automata images and pseudo amino acid composition to predict protein subcellular location. Amino Acids. 2006;30:49–54. doi: 10.1007/s00726-005-0225-6. [DOI] [PMC free article] [PubMed] [Google Scholar]
- Yee V.C., Pedersen L.C., Le Trong I., Bishop P.D., Stenkamp R.E., Teller D.C. Three-dimensional structure of a transglutaminase: human blood coagulation factor XIII. Proc. Natl. Acad. Sci. USA. 1994;91:7296–7300. doi: 10.1073/pnas.91.15.7296. [DOI] [PMC free article] [PubMed] [Google Scholar]
- Zhang C.T., Chou K.C. Analysis of codon usage in 1562 E. Coli protein coding sequences. J. Mol. Biol. 1994;238:1–8. doi: 10.1006/jmbi.1994.1263. [DOI] [PubMed] [Google Scholar]
- Zhang T.L., Ding Y.S., Chou K.C. Prediction protein structural classes with pseudo-amino acid composition: approximate entropy and hydrophobicity pattern. J. Theor. Biol. 2008;250:186–193. doi: 10.1016/j.jtbi.2007.09.014. [DOI] [PubMed] [Google Scholar]
- Zhou X.B., Chen C., Li Z.C., Zou X.Y. Using Chou's amphiphilic pseudo-amino acid composition and support vector machine for prediction of enzyme subfamily classes. J. Theor. Biol. 2007;248:546–551. doi: 10.1016/j.jtbi.2007.06.001. [DOI] [PubMed] [Google Scholar]
Associated Data
This section collects any data citations, data availability statements, or supplementary materials included in this article.
Supplementary Materials
Supporting Information A