

Abstract
Thirty-nine bull calves between 6 and 9 d of age, were assigned to either baseline slaughter or 1 of 4 diets to determine the influence of dietary fat and protein content, at 2 levels of intake, on growth and body composition changes. Calves were assigned to the following diets a 28.5% protein and 16.4% fat milk replacer [MR; 29/16 (n = 9)], 27.3% protein and 33.4% fat MR [27/33 (n = 8)], 20.6% protein and 20.6% fat MR [20/20 (8)], or whole milk [WM (n = 8)]. Calves fed 27/33, 29/16, and WM received 180 g/d of CP to support 650 g of ADG based on predictions from the 2001 NRC. Calves were fed 3 times daily for 4 wk. Weight, hip height, wither height, heart girth, and body length were measured weekly. Weekly plasma samples were analyzed for plasma urea nitrogen, nonesterified fatty acids, and glucose. A subset of calves from each treatment was killed [29/16 (n = 7), 27/33 (n = 6), 20/20 (n = 6), and WM (n = 5)] at the end of wk 4 of treatment; processed for whole-body analysis of fat, protein, ash, and DM; and compared with baseline slaughter calves to estimate composition of empty BW gain. Calves did not differ in average weekly scour score or medication days. Feed efficiency and ADG were greatest for calves fed WM and least for calves fed 20/20; calves fed 29/16 and 27/33 did not differ. Calves fed 27/33 or WM had the greatest % body fat and gained more grams of fat than calves fed other diets. Calves fed 29/16 or 20/20 had similar % fat in empty body as baseline. Differences in % CP, % ash, or % water in empty body and empty BW gain were not detected. Calves fed 27/33 had a trend toward higher NEFA in wk 1 and 2 than calves fed 29/16 or WM. Growth of calves fed 27/33 and 29/16 were similar except that calves fed 29/16 had lower body fat % than calves fed 27/33. Calves on all diets gained less than predicted by the 2001 NRC.
Key words: Jersey calf, milk, body composition, milk replacer
Introduction
Body composition of calves can be altered in a variety of ways. Increasing rate of feeding or altering nutrient composition of the diet alters body composition of calves. Bartlett et al. (2006) and Diaz et al. (2001) reported an increase in body fat, ADG, and feed efficiency when rate of milk replacer feeding was increased. Increasing the percentage of CP in the diet up to 30% resulted in an increase in lean tissue gain, feed efficiency, and ADG compared with diets with lower levels of protein (Donnelly and Hutton, 1976; Gerrits et al., 1996; Diaz et al., 2001). Different sources of energy in milk replacer (MR) also have been reported to alter the body composition of calves. Tikofsky et al. (2001) reported that increasing carbohydrate and decreasing fat in isonitrogenous and isocaloric intakes decreased body fat deposition in calves.
A positive relationship between rate of gain and development of mammary parenchymal tissue during the first 6 wk of life may exist (Sejrsen et al., 1998; R. M. Akers, Virginia Polytechnic Institute and State University, Blacksburg; personal communication). Feeding calves at or near ad libitum intake during the first 6 wk of life increased first lactation milk yield, decreased age at first calving, and increased BW at calving (Foldager et al., 1997). Drackley et al. (2007) also reported calves fed more intensively during early life produced more milk during the first lactation than calves fed conventionally.
The majority of research on the relationship between nutrition and body composition of dairy calves has been conducted on breeds with a large frame size (Donnelly and Hutton, 1976; Gerrits et al., 1996; Diaz et al., 2001; Tikofsky et al., 2001; Bartlett et al., 2006). However, few data have been reported using calves from breeds with a smaller mature size. Therefore, the objectives of this study were to examine the relationships between dietary protein and energy intake on animal growth, body composition, feed efficiency, and general health in Jersey bull calves.
Materials and Methods
Animal Acquisition and Management
Virginia Tech Animal Care and Use Committee approved the experimental protocol used in this study. Male Jersey calves were acquired from the Virginia Tech Dairy herd (n = 10) or a Jersey breeder (n = 32) located 100 km from the university. At birth, calves acquired from the Jersey breeder were fed 1 L of pooled colostrum obtained from cows in the Virginia Tech Dairy herd and 1 L of high quality colostrum from the farm of origin. Calves acquired from Virginia Tech received only colostrum procured from the Virginia Tech dairy. Prior to the study frozen colostrum from the Virginia Tech dairy herd was thawed and warmed to 20°C. A colostrometer was used to determine specific gravity of colostrum and make an indirect assessment of immunoglobulin concentration as described by Fleenor and Stott (1980). Colostrum with a high immunoglobulin concentration (>50 mg/mL) was mixed in a clean, sanitized 189-L container and then transferred to 1-L bags and frozen (−20°C). A supply of frozen colostrum from the Virginia Tech Dairy herd was maintained at the other calf source farm. Calves were fed an additional 2 L of colostrum from the farm of origin at 12 h of age. Three of the purchased calves died after being transported but before being assigned to treatment and were not replaced due to the limited supply of Jersey bull calves.
Immediately after birth, vaccinations were administered for bovine rhinotracheitis and parainfluenza 3 (TSV-2, Pfizer Animal Health, Exton, PA), and rota- and corona virus (Calf Guard, Pfizer Animal Health), and clostridial diseases with a toxoid (Vision Seven, Bayer Corp.). Calves received 1 mL of BoSe s.c. (0.5 mg of selenium, 34 IU of vitamin E; Schering-Plough Animal Health Corp., Union, NJ), and vitamin A and D (250,000 IU of vitamin A, 37,500 IU of vitamin D; Phoenix Pharmaceutical Inc., St. Joseph, MO).
After arrival, calves were housed in a location separate from the Virginia Tech dairy herd to maintain biosecurity. Prior to assignment to treatment all calves were fed a pretreatment diet for 6 to 9 d consisting of 20% CP, 20% fat, MR (Dairy Partners, Winchester, TN) reconstituted to 12.5% DM to allow calves to become accustomed to drinking from an open bucket. During the pretreatment phase calves were fed 454 g of MR at 0600 and 1600 h. Calves with a fecal score >2 were administered 1 L of electrolytes/d (Entrolyte H.E., Pfizer Animal Health). The protocol for managing calves from arrival until assignment to treatment was modified after 15 calves due to death loss of 3 out of 15. The use of Entrolyte was discontinued. In the modified policy, calves were fed 1 L of oral electrolytes (Blue Ribbon Electrolyte, Merricks, Middletown, WI) prior to being transported and calves were fed MR twice daily for at least 5 d after arrival including 1 tablet of Sulfa-Max III (Agri-Labs) dissolved in their MR. All calves were offered 1 L of oral electrolytes (Blue Ribbon Electrolyte, Merricks) at 2200 h until assignment to treatment. Calves acquired from the Virginia Tech herd were 6 to 9 d of age when assigned to treatment diets. Age in days when assigned to treatments differed because all calves were assigned to treatment diets on Monday of each week.
Calf health was monitored daily. Fecal scores (1 to 4; 1 = firm and 4 = watery) were assigned using the method of Diaz et al. (2001) and recorded daily. Body temperature was recorded daily for the first 7 d after arrival and thereafter on Fridays. Respiratory scores were recorded daily (1 = healthy, 2 = abnormal breathing but body temperature <39.8°C, and 3 = abnormal breathing and body temperature >39.8°C).
The following scour treatment protocol was used. When fecal score exceeded 2, or calves were off feed, 50 cc of Gastrocote (Butler, Dublin, OH) was added to milk or MR for 5 consecutive feedings and calves received 1 L of oral electrolytes (Blue Ribbon Electrolyte, Merricks) in an open bucket at 2200 h. If calves had a fecal score greater than 3 they received an additional 1 L of electrolytes at 1300 h. Calves that had 2 consecutive days of fecal scores >3 were fed 20 g of Gammulin (American Proteins Corporation, Ames, IA) for 6 consecutive feedings. One calf on diet 20/20 became weak and could not stand without assistance. The calf was treated with 1 L of warm (39°C) lactated ringers solution administered in 4 locations subcutaneously, and within 12 h the calf was clinically normal.
Diets
Thirty-nine calves were blocked by farm and randomly assigned within block to either baseline slaughter or 1 of 4 dietary treatments at 6 to 9 d of age. Six calves were killed at 6 to 9 d of age to establish baseline body composition. Eight calves were assigned to be fed whole milk that contained 36% fat and 25% true protein on a DM basis (WM). Diet WM was routinely tested for fat and protein at the Virginia Tech DHIA lab to ensure that day to day variation in fat in protein content was minimal. Nine calves were on diet 29/16 (28.5%, CP 16.4% fat MR). Eight calves were assigned to diet 27/33 (27.3% CP, 33.4% fat MR), and 8 calves were fed diet 20/20 (20.6% CP, 20.6% fat MR). Table 1 shows nutrient content of milk replacer diets and an estimate of nutrient content of WM. Table 2 details the nutrient intake and growth performance of calves through d 26 of the feeding trial. Target daily intake of WM, 29/16, and 27/33 provided sufficient CP to support maintenance, plus 650 g of ADG as recommended by NRC (2001). Energy intake differed as shown in Table 1. Intake was adjusted weekly based on change in BW from the previous week for each calf, using the method suggested by Blaxter and Mitchell (1948) as adapted by NRC (2001). Calves fed 20/20 served as a control and were fed MR at 15% of BW, adjusted weekly.
Table 1.
Nutrient content of diets on an equivalent basis1
| Variable | Diet2 |
|||
|---|---|---|---|---|
| 20/20 | 27/33 | 29/16 | WM3 | |
| DM, % | 97.3 | 97.3 | 97.3 | 97.3 |
| Crude protein, % | 20.6 | 27.3 | 28.5 | 24.3 |
| Crude fat, % | 20.6 | 33.4 | 16.4 | 33.4 |
| Lactose+ash, % | 58.8 | 39.3 | 55.1 | 39.6 |
| Gross energy, Mcal/kg | 5.427 | 6.228 | 5.357 | 5.815 |
| Crude fiber, % | 0.15 | 0.15 | 0.15 | |
| Calcium, % | 0.90 | 0.90 | 0.90 | 1.00 |
| Phosphorus, % | 0.70 | 0.70 | 0.70 | 0.75 |
| Iron, ppm | 100 | 100 | 100 | 3.00 |
| Copper, ppm | 10 | 10 | 10 | 1.10 |
| Cobalt, ppm | 0.1 | 0.1 | 0.1 | 0.01 |
| Zinc, ppm | 40 | 40 | 40 | 38.00 |
| Manganese, ppm | 40 | 40 | 40 | 0.40 |
| Iodine, ppm | 1.02 | 1.02 | 1.02 | 0.20 |
| Selenium, ppm | 0.30 | 0.30 | 0.30 | 0.15 |
| Vitamin A, IU/kg | 9,091 | 9,091 | 9,091 | 11,500 |
| Vitamin D3, IU/kg | 2,273 | 2,273 | 2,273 | 307.00 |
| Vitamin E, IU/kg | 45 | 45 | 45 | |
| Thiamine, mg/kg | 6.61 | 6.61 | 6.61 | 3.30 |
| Riboflavin, mg/kg | 6.61 | 6.61 | 6.61 | 12.20 |
| Niacin, mg/kg | 2.64 | 2.64 | 2.64 | 9.50 |
| d-Pantothenic acid, mg/kg | 13.22 | 13.22 | 13.22 | 25.90 |
| Biotin, mg/kg | 0.11 | 0.11 | 0.11 | 0.03 |
| Ascorbic acid, mg/kg | 110 | 110 | 110 | 120 |
| Pyridoxine hydrochloride, mg/kg | 6.61 | 6.61 | 6.61 | 4.40 |
| Folic acid, mg/kg | 0.55 | 0.55 | 0.55 | 0.60 |
| Vitamin B12, mg/kg | 0.07 | 0.07 | 0.07 | 0.05 |
| Choline chloride, mg/kg | 1,322 | 1,322 | 1,322 | 1,080 |
Analytical values for MR represent single batch used in entire trial.
20/20 = 20% protein/20% fat, 27/33 = 27% protein/33% fat, 29/16 = 29% protein/16% fat, WM = whole milk.
Minerals and vitamin values adapted from Toullec (1989); values expressed on a 97.3% DM basis.
Table 2.
Total nutrient intake and performance of calves through d 26
| Variable | Diet1 |
||||
|---|---|---|---|---|---|
| 20/20 | 27/33 | 29/16 | WM | SE | |
| Number of calves | 8 | 8 | 9 | 8 | |
| Liquid fed, kg | 88.1a | 145.8b | 144b | 138.6c | 1.9 |
| DM fed, kg | 11.0a | 18.2b | 18.0b | 19.4c | 0.3 |
| Average daily DMI,2 kg | 0.42a | 0.70b | 0.69b | 0.75c | |
| Protein fed, kg | 2.26a | 4.97b | 5.13bc | 4.90b | 0.10 |
| Fat fed, kg | 2.27a | 6.09b | 2.95b | 6.68c | 0.10 |
| Gross energy intake,3 Mcal/d | 2.343a | 4.480c | 3.799b | 4.482c | |
| Water intake, L | 7.1a | 13.4ab | 16.4b | 11.3ab | 3.0 |
| Average daily gain, g | 110a | 357b | 368b | 496c | 26.0 |
| Weight gained, kg | 3.1a | 10b | 10.3b | 13.9c | 0.7 |
| Feed efficiency, kg of gain/kg of DM fed | 0.282a | 0.549b | 0.567b | 0.721c | 0.041 |
Values in a row with similar superscripts do not differ (P < 0.05).
20/20 = 20% protein/20% fat, 27/33 = 27% protein/33% fat, 29/16 = 29% protein/16% fat, WM = whole milk.
Calculated as kg of DM fed/26 d.
Calculated as kg of DM fed × GE/kg of diet/26 d.
After the pretreatment period, calves were fed 3 times per d (0600, 1200, and 1800 h). Milk or MR was offered in an individual open bucket for 30 min with intakes recorded. Refusals were minimal. Fresh water was available ad libitum, and intake was recorded once daily. No dry feed was offered. Calves were housed in calf hutches located on a bed of coarse gravel.
Digestibility Study
During the fourth week of treatment, a randomly chosen subset of calves from each treatment was housed in metabolism crates (75 cm × 150 cm) for 5 d [29/16 (n = 6), 27/33 (n = 6), 20/20 (n = 5), and WM (n = 5)]. The first 2 d of the collection period were used to adapt calves to the crate. Diets were fed at 0600, 1200, and 1600 h. Fresh water was available at all times. Calves were monitored 5 to 6 times daily, and total collection of feces and urine was conducted on d 4 and 5 of the collection period. Urine was weighed at 6-h intervals, acidified (22 mL of 6 N HCl/kg of urine), pooled, subsampled after 24 h, and stored frozen for later analysis. Feces were collected in palpation sleeves attached to the calves using Velcro. Feces were weighed once daily and frozen for later analysis. Milk and MR were sampled once during each collection week. Calves consumed all of the WM or MR offered with no refusal. Fecal samples were composited, and a subsample was air dried at 60°C in a Wisconsin drying oven for 7 d to >90% DM and ground for later analysis. Fecal samples were ashed at 600°C for 14 h. Dry matter, Kjeldahl N, and ether extract analysis on fecal samples and analysis on urine were conducted by the Virginia Tech forage testing lab.
Growth Measurements
Calves were weighed, blood was sampled, and calves were measured for hip height, wither height, heart girth, and body length at 1400 h each Friday.
Blood Samples
Two blood samples were obtained by jugular venipuncture. One sample was collected into a Vacutainer (Becton Dickinson, Franklin Lakes, MN) treated with potassium EDTA and the second sample into a heparinized Vacutainer (Becton Dickinson). Plasma was isolated by centrifugation at 3,200 × g for 20 min and stored frozen for later analysis. Samples were analyzed for plasma glucose (glucose kit procedure No. 510, Sigma Diagnostics, St. Louis, MO) and NEFA (NEFA C kit, Wako Chemicals GmbH, Neuss, Germany). Samples were analyzed for plasma urea N (PUN) using the urease and indophenol reaction (Chaney and Marbach, 1962; Weatherburn, 1967). Absorbance of samples was read on a Microplate Autoreader (Biotek Instruments, Frederick, MD) at dual wavelengths of 405 and 625 nm.
Harvest Procedure and Body Composition
Calves (n = 6) selected to obtain baseline data were killed at 5 to 7 d of age. A subset of calves from each treatment 29/16 (n = 7), 27/33 (n = 6), 20/20 (n = 6), and WM (n = 5) were killed at the end of the fourth week of treatment. Two or three of the calves from each diet from the digestibility subset, 29/16 (n = 2), 27/33 (n = 2), 20/20 (n = 3), and WM (n = 3), were placed in metabolism crates for 5 d before slaughter, and remaining calves were housed in hutches until slaughter. Body composition of calves housed in hutches or metabolism crates for 5 d before slaughter was evaluated to determine if housing influenced body composition. Calves were slaughtered by captive bolt and exsanguination in the necropsy facility of the Virginia-Maryland Regional College of Veterinary Medicine. Blood was collected into a tared plastic bag. The gastrointestinal tract was removed, weighed, stripped of its contents, and reweighed. The calf was separated into the following components: 1) head, hide, feet, and tail (HHFT); 2) internal organs and blood (BO); and 3) carcass (CAR). The carcass fraction was divided, and the left half was discarded. Each component was weighed, bagged, frozen (−20°C), and later transported to Cornell University for further processing. Each component was ground 7 times in a grinder (model 8016, Autio Co., Astoria, OR; 10-mm screen). Grab samples of each component from each animal were collected, bulked, sub-sampled, weighed, and refrozen at −20°C for later analysis of DM, CP, fat, ash, and gross energy (GE).
Analysis of Tissue Samples
Samples were freeze dried for 72 h with shelf temperature set at −24°C (Virtus 20 SRC-X; The Virtus Co. Inc., Gardiner, NY). Samples were turned after 24 h to ensure drying in 72 h to >90% DM. Freeze dried samples were reground through a 1-mm screen in a Wiley mill (Arthur H. Thomas, Philadelphia, PA) with dry ice prior to further analysis. Nitrogen content, ash, and ether extract were estimated in triplicate by Cumberland Valley Analytical Services, Hagerstown, MD. To determine N, 0.08 g of pelleted tissue was analyzed (Nitrogen Combustion Analyzer, Leco FP-528, Leco, St. Joseph, MI) according to AOAC (1990) standards. Ash was determined by placing 0.5 g of material in a furnace at 550°C for 2 h (AOAC, 1990). Ether extract analysis was conducted by extracting 1 g of material with anhydrous ether in a Soxtet unit for 45 min according to AOAC (1990) standards. Moisture was analyzed according to AOAC (1990); approximately 1 g of sample was dried at 135°C for 2 h. Gross energy was determined by bomb calorimetry (Parr model 1281, Parr Inc., Moline, IL).
Calculations
Empty BW (EBW) was calculated for each individual as
| [1] |
Empty BW gain (EBG) was calculated for each individual as
| [2] |
where RLBW is the ratio of live EBW to BW in baseline calves.
Empty body composition in terms of quantity of fat, CP, ash, and water was calculated for each individual as
| [3] |
.
Body composition as a percentage was calculated for individual animals as
| [4] |
Apparent digestibility of nutrients (fat, CP, and GE) was calculated for individual animals as
| [5] |
Apparent partial efficiency (APE) of use of nutrients (fat, CP, and GE) was calculated for each individual as
| [6] |
.
Retention of N was calculated for individual animals as
| [7] |
Statistical Design and Analysis
Calves were assigned to treatment in a randomized complete block design where farms were blocks. Calves were also blocked by whether they were placed in a metabolism crate, but differences were not detected due to this blocking factor so it was not included in the model. Initial measurements (i.e., BW, girth, wither height, hip height, PUN, NEFA, or glucose) were used as a covariate.
For weekly measurements the following model statement was used:
where B1 () = the covariate term for measurement at time 0; D = diet (i = 1…4); fixed effect F = farm (j = 1, 2); random effect W = week (l = 1…4); fixed effect C = calf (k = 1…8); (total of 33 calves); and random effect E = residual.
The main effect was tested using the diet × farm interaction (DFij) as the error term. Means were separated using a Tukey test.
For statistical analysis variables that were only measured once during the experiment:
where D = diet (i = 1…4); fixed effect F = farm (j = 1, 2); and random effect E = residual (k = 1…33, 1…10).
The interaction between diet and farm (DFij) was not included for analysis of body composition because all of the calves fed diet 20/20 were purchased.
Data measured daily or weekly was analyzed using Proc GLM with repeated measures (SAS Institute, 2002). Data measured only one time during the experiment was analyzed using Proc GLM (SAS Institute, 2002). Health and fecal scores were analyzed using the Proc Freq option in (SAS Institute, 2002). For all comparisons, significance was declared at P < 0.05.
Results and Discussion
Diets
Nutrient content of the milk replacers and milk is in Table 1. Nutrient composition of milk replacer represents guaranteed analysis provided by the manufacturer. Protein, fat, lactose, and ash of whole milk were determined by Foss 4000 MilkoScan (Foss America, Eden Prairie, MN). Mineral and vitamin values for whole milk were adapted from Toullec (1989). Nutrient intake and performance of calves is shown in Table 2. Dry matter intake was as expected with intake by 20/20 calves less than others. The experiment was designed to deliver equivalent amounts of protein to calves fed WM, 27/33, or 29/16 and to deliver equivalent amounts of fat to calves fed WM or 27/33 milk replacer diet. However, calves fed WM consumed more DM and approximately 10% more fat than calves fed 27/33 milk replacer diet (Table 2). Gross energy intake was not different between calves receiving WM or 27/33 diets due to higher fat percentage of 27/33 diet.
Growth
Calves fed WM had higher ADG, BW gain, and feed efficiency than calves fed other diets (Table 2), whereas calves fed 20/20 had the lowest ADG, weight gain, and feed efficiency. Calves fed 29/16 and 27/33 were intermediate, although calves fed 27/33 consumed more energy than calves fed 29/16, but ADG, total weight gained, and feed efficiency were not different. Calves fed WM consumed similar amounts of protein as calves fed 27/33 or 29/16, but they consumed more fat, had greater ADG, greater total weight gains, and were the most efficient in conversion of feed to gain. Given that calves fed WM and 27/33 consumed similar grams of protein and that calves on both diets consumed more grams of fat than calves fed 29/16, it seems reasonable to expect calves fed 27/33 would exceed growth of calves fed 29/16 and show similar patterns of growth as the calves fed WM. The source of fat in MR formulations was edible lard and the nutrient content of MR was similar to WM in nutrient content (Table 1) and the MR met or exceeded (NRC, 2001) requirements. There are several possible reasons for unexpected responses. Superior growth and feed efficiency of calves fed whole milk may be due to coagulation of milk proteins in the abomasum, which delays digestion, allowing for absorption of amino acids and fatty acids to match insulin release (Bartlett et al., 2006). In addition, milk fat contains a greater proportion of medium-chain length fatty acids as compared with fats composed of long-chain fats typically found in lard and tallow commonly used in milk replacers. Medium-chain length fatty acids are hydrolyzed more rapidly and completely than long-chain fatty acids found in most milk replacers (Odie, 1997). They are also oxidized more rapidly than long-chain fatty acids probably leading to differences in energetic efficiency of the utilization of dietary fat.
By wk 3 and 4, calves fed 20/20 were lighter than calves fed the other diets and the difference in weight between calves fed 20/20 and other diets increased. These calves gained 110 g per day, indicating that feeding Jersey bull calves a 20/20 MR at 15% of BW is adequate to maintain BW but supports only a modest rate of gain. Feeding MR at 8 to 10% of BW is a common recommendation (Davis and Drackley, 1998). In this study, calves were not offered starter, which could account at least partially for the low rates of gain of calves fed 20/20. Jones et al. (2004) fed Jersey calves MR (20% CP, 20% fat) at 31% of metabolic weight (about 10% of BW as fed) and reported weight gains of 3 kg. The NRC (2001) predicts these calves would gain >7 kg. Results reported by Jones et al. (2004) and those of this study suggest that feeding Jersey calves a 20% CP, 20% fat MR at 8 to 10% of BW supports only modest rates of ADG. Therefore, current NRC recommendations for small breed calves may be inadequate to support desired growth.
No differences in hip height, withers height, body length, or heart girth were detected between diets. A week × diet interaction was detected in wither height (Figure 1 ). Calves fed 20/20 appeared to have had a slower rate of increase in wither height between wk 2 and 3 and then gain at a faster rate in the last week of the study. However, conclusions based upon this data should be made with caution given the limited animal numbers and inherent variability of the withers height measurement.
Figure 1.
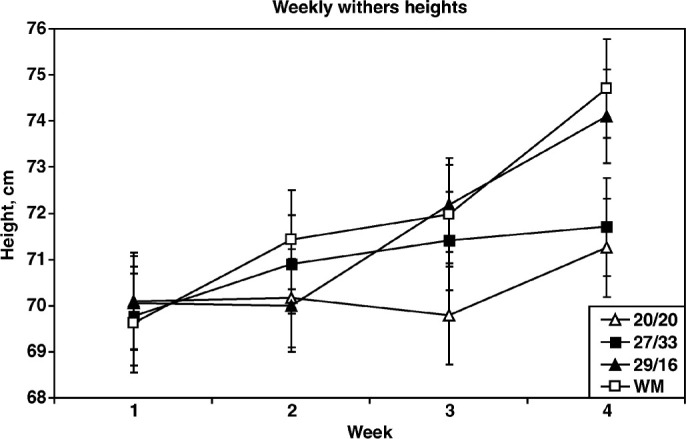
Weekly withers height of calves fed a 20% protein/20% fat (20/20) milk replacer to supply 90 g of CP/d or fed sufficient grams of CP/d from a 27% protein/33% fat (27/33), 29% protein/16% fat (29/16), or whole milk for 650 g of ADG. Week × diet interaction was significant (P < 0.04), indicating that calves fed a 29/16 diet grew faster after wk 2.
Plasma Indications of Protein and Energy Metabolism
Feeding a diet that supplies more protein than the calf can utilize should result in elevated PUN. Calves fed 29/16 had PUN similar to other diets in wk 1 to 4 (data not shown) indicating that feeding 180 g of CP/d did not greatly exceed protein needs. Calves fed 20/20 showed a propensity toward lower PUN in wk 1 to 3, which would be expected because these calves received only 90 g of CP/d. Values for PUN varied between 8 and 12 mg/dL. Diets varied in amount of lactose fed, but calves had a similar level of blood glucose among diets ranging from 90 to 120 mg/dL. This is in agreement with Attebery and Colvin (1963) who found blood glucose is tightly modulated in the young calf.
Calves fed 27/33 showed a tendency toward elevated NEFA than calves fed the other diets. Elevated NEFA was unexpected because it frequently indicates mobilization of fat. However, these calves were gaining BW and depositing body fat similar to calves fed WM. Source of fat in the MR was edible lard, which has a slightly lower digestibility than milk fat (Toullec et al., 1980), which may be due to the greater percentage of medium and short chain fatty acids in milk fat (Raven, 1970). Short and medium chain fatty acids (<C16:0) make up approximately 35% of the fatty acids in butterfat (Jenness, 1985), whereas less than 2% of the fatty acids in the edible lard in the MR fed are shorter than C16:0 (M. Fowler, Land O’Lakes, St. Paul, MN; personal communication). However, apparent digestibility of fat in diets 27/33 and WM was not different (Table 3 ). Tikofsky et al. (2001) and Bartlett et al. (2006) also reported elevated NEFA when Holstein bull calves were fed high fat MR.
Table 3.
Daily water intake (mL) by week
| Item | Diet1 |
|||||
|---|---|---|---|---|---|---|
| 20/20 | 27/33 | 29/16 | WM | SE | P-value | |
| Week 1 | 310 | 573 | 380 | 234 | 170 | 0.60 |
| Week 2 | 218 | 835 | 567 | 414 | 274 | 0.53 |
| Week 3 | 313 | 539 | 733 | 603 | 138 | 0.35 |
| Week 4 | 256a | 492b | 610b | 274ab | 46 | 0.03 |
Values in the same row with the same superscripts are not different (P < 0.10).
20/20 = 20% protein/20% fat, 27/33 = 27% protein/33% fat, 29/16 = 29% protein/16% fat, WM = whole milk.
Health and Water Intake
Water intake varied considerably but few differences among diets were detected (Table 2). However, at wk 4 calves fed 29/16 consumed more water than calves fed 20/20 and showed a tendency for greater consumption than WM and 27/33 (P = 0.10). It is unclear why calves fed 29/16 had greater water intake than the other diets in wk 4 (Table 3).
Average days scouring (days with fecal score >2, data not shown) were highest for calves fed 29/16 (6.1 d) and 27/33 (5.8 d) and were lowest for 20/20 (4.1 d). When fecal scores were averaged by week, the interaction between diet and week was significant (P < 0.01) indicating that in wk 3 and 4, calves fed WM had an increase in fecal score, whereas calves fed the other diets had a slightly decreased fecal score. Calves fed WM tended to have a higher average fecal score in wk 4 than calves fed 20/20, 27/33, or 29/16 (P < 0.10), but no other differences were detected. However, the average fecal score for calves fed WM was less than 2 in wk 4, indicating that the calves had looser feces but were not clinically scouring due to enteric disease. No differences were detected between treatments in days medicated. Overall, health of the calves was similar among diets.
Apparent Digestibility and Apparent Efficiency of Gain
Differences in apparent digestion of N or fat were not observed among diets (Table 4 ). Retention of N was similar among treatments with no differences observed in grams of dietary N/kilogram of gain. These data indicate that apparent digestibly of fat and N was similar among diets and that apparent digestibility of fat and N in WM was similar to the digestibility of these nutrients in other diets. Diaz et al. (2001) reported digestibility of 93% for protein and 94% for fat in Holstein calves gaining 1,100 g/d. The apparent digestibility for N was similar in the current study, but the total tract apparent digestibility of fat was higher.
Table 4.
Nutrient retention and digestion
| Variable | Diet1 |
|||||
|---|---|---|---|---|---|---|
| 20/20 | 27/33 | 29/16 | WM | SE | P-value | |
| Nitrogen retention, g/kg gained | 33.4 | 43.8 | 47.9 | 46.2 | 6.4 | 0.36 |
| Nitrogen retained,2 % | 39.1 | 56.1 | 40.4 | 56.9 | 5.3 | 0.12 |
| Nitrogen digested, % | 83.2 | 90.0 | 89.6 | 92.6 | 1.3 | 0.12 |
| Fat digested, % | 97.3 | 96.9 | 98.8 | 97.8 | 0.6 | 0.20 |
| APE fat,3 % | 10.8a | 27.1b | 30.3b | 37.0b | 5.7 | 0.02 |
| APE protein,3 % | 79.6 | 48.5 | 59.1 | 71.7 | 27.3 | 0.80 |
| APE total energy,3,4 % | 22.7 | 32.2 | 37.3 | 30.3 | 8.5 | 0.56 |
Values in the same row with the same superscripts are not different (P < 0.05).
20/20 = 20% protein/20% fat, 27/33 = 27% protein/33% fat, 29/16 = 29% protein/16% fat, WM = whole milk.
Calculated from balance trial.
Apparent partial efficiency (APE) calculated as (intake-gain)/(intake × digestibility).
Total energy in milk replacer by bomb calorimeter, total energy in whole milk calculated using formula: (9.21 × g of fat) + (5.86 × g of protein) + (3.95 × g of lactose and ash; Brisson et al., 1957; Lister, 1971).
Apparent partial efficiency of use of fat, protein, and energy was calculated for each diet. Total amount of fat, protein, or energy in EBG was divided by the total dietary intake of apparently digestible fat, protein, or energy, respectively. No differences were observed in APE of protein or energy among diets. However, the APE for fat was lower for calves fed 20/20. Tikofsky et al. (2001) fed Holstein calves isocaloric and isonitrogenous diets of MR containing 14.8, 21.6, or 30.6% fat on a DM basis. The APE for protein and energy were similar to the current study, but the APE of fat was 45 to 51% in Holstein calves, whereas the APE for fat was less than 40% in our study. The lower APE for fat in Jersey calves may indicate that Jersey calves have a higher maintenance energy requirement than Holstein calves per unit of metabolic weight.
Body Composition
Composition of CAR, HHFT, BO, and EBW are shown in Table 5 . The CAR as a percentage of EBW was similar for calves on all diets and baseline calves, but calves fed WM had more GE per gram of carcass than baseline calves and calves fed 20/20. Energy density of BO did not differ among diets or baseline calves, but the BO as % of EBW was greater for calves fed 27/33 than for baseline calves. The calves fed 20/20 had a lower EBW, and the HHFT was a smaller percentage of the EBW in baseline calves than calves fed 27/33, 29/16, or WM (Table 5). Calves fed WM had a greater energy density in the HHFT than baseline calves or calves fed 20/20. Calves fed 20/20 or 29/16 had less GE in the EBW after 4 wk of treatment than calves fed other diets (Table 6 ). Calves fed 20/20 gained less GE in their EBW than calves fed other diets. Calves fed 27/33 and WM had the highest EBW energy content and greatest GE gains. Whereas we did not use linear contrasts to our data, it appears that there is a linear relationship between fat intake and % fat in EBW. Tikofsky et al. (2001) observed similar results in Holstein calves fed isocaloric diets. Calves gained more GE as the proportion of energy in the diet from fat increased.
Table 5.
Composition of body components1
| Variable | Diet2 |
||||||
|---|---|---|---|---|---|---|---|
| Baseline | 20/20 | 27/33 | 29/16 | WM | SE | P-value | |
| CAR, % EBW | 30.0 | 31.1 | 31.4 | 31.3 | 31.9 | 1.5 | 0.89 |
| GE CAR, kcal/g of DM | 4.3a | 4.5a | 4.8ab | 4.7ab | 5.1b | 0.2 | 0.01 |
| BO, % EBW | 16.6a | 18.6ab | 20.8b | 19.3ab | 20.4ab | 1.1 | 0.07 |
| GE BO, kcal/g DM | 5.3 | 5.2 | 6.0 | 5.3 | 5.2 | 0.3 | 0.07 |
| HHFT, % EBW | 53.4a | 50.2ab | 47.8b | 49.4b | 47.7b | 1.0 | <0.01 |
| GE HHFT, kcal/g of DM | 4.0a | 4.0a | 4.5ab | 4.4ab | 4.9b | 0.1 | <0.01 |
Values in the same row with the same superscripts are not different (P < 0.05).
CAR = carcass; BO = blood and organs; HHFT = head, hide, feet, and tail.
Baseline = calves killed prior to assignment to treatment, 20/20 = 20% protein/20% fat, 27/33 = 27% protein/33% fat, 29/16 = 29% protein/16% fat, WM = whole milk.
Table 6.
Composition of the empty body
| Variable | Diet1,2 |
||||||
|---|---|---|---|---|---|---|---|
| Baseline | 20/20 | 27/33 | 29/16 | WM | SE | P-value | |
| Water, % EBW | 65.4 | 58.4 | 58.8 | 58.7 | 57.6 | 3.6 | 0.44 |
| CP, % EBW | 24.5 | 27.5 | 24.2 | 25.8 | 24.2 | 2.7 | 0.85 |
| Ether extract, % EBW | 2.8a | 3.6a | 6.8b | 4.7a | 8.2b | 0.6 | <0.01 |
| Crude ash, % EBW | 6.0 | 7.0 | 6.3 | 6.1 | 5.4 | 0.6 | 0.45 |
| EBW, kg | 24.9a | 29.3b | 37.1c | 35.8c | 35.5c | 1.2 | <0.01 |
| GE EB initial, Mcal | 37.5 | 40.2 | 41.9 | 40.5 | 36.0 | 2.0 | 0.19 |
| GE EB final, Mcal | 45.8a | 66.6b | 59.6a | 69.0b | 5.9 | 0.02 | |
| GE gained, Mcal | 6.9a | 25.6b | 20.1b | 33.3b | 5.9 | 0.02 | |
Values in the same row with the same superscripts are not different (P < 0.05).
Baseline = calves harvested prior to assignment to treatment, 20 = 20% protein/20% fat, 27/33 = 27% protein/33% fat, 29/16 = 29% protein/16% fat, WM = whole milk, EBW = empty body weight, and EB = empty body.
For whole milk gross energy (GE) calculated; GE = (9.21 × g of fat) + (5.86 × g of protein) + (3.95 × g of lactose and ash) (Brisson et al., 1957; Lister, 1971).
Whereas energy gains were not different in calves fed 29/16, WM, or 27/33, fat % in EBW was higher in calves fed high fat diets (Table 6). No other differences were detected in composition of gain. However, the higher percentage body fat in calves fed WM or 27/33 indicates that increasing fat percentage in the diet of Jersey bull calves resulted in an increased deposition of body fat. It is important to note that calves fed 29/16 or 20/20 had similar body fat percentage as baseline calves, indicating that these calves did not have any more body fat reserves, as a proportion of EBW, after 4 wk of treatment than they did on the first week of treatment. Scibilia et al. (1986) reported that calves housed in environments below −4°C had lower ADG and required higher fat diets to maintain similar rates of gain as calves housed in warmer environments. Calves on this trial were not subjected to temperatures below −4°C, but if they had been, then differences in body composition of calves may have been more pronounced between those fed higher vs. lower levels of dietary fat. Quigley et al. (1991) and Quigley (1996) reported that calves have elevated NEFA at weaning due to stress, which results in mobilization of body fat. Therefore, the low body fat percentage of calves fed 29/16 or 20/20 is a concern. More research is needed to determine the importance of body fat reserves to health and performance of the preweaned calf.
Changes in body composition during the trial are shown in Table 7 . Differences in composition of EBG, as a percentage of EBG, were not detected, but calves fed higher fat diets gained more fat (Table 7). Calves fed 20/20 had modest gains in BW (3.1 kg; Table 1), and it is possible that our test lacked the necessary power to detect differences in composition of gain when EBG are modest.
Table 7.
Changes in body composition
| Variable | Diet1 |
|||||
|---|---|---|---|---|---|---|
| 20/20 | 27/33 | 29/16 | WM | SEM | P-value | |
| Water gained, kg | 1.32 | 4.37 | 4.75 | 5.48 | 1.53 | 0.16 |
| Protein gained, kg | 1.43 | 1.98 | 2.54 | 2.93 | 1.06 | 0.69 |
| Fat gained, kg | 0.16a | 1.69b | 0.83a | 2.38b | 0.24 | <0.01 |
| Ash gained, kg | 0.46 | 0.62 | 0.57 | 0.54 | 0.23 | 0.95 |
Values in the same row with the same superscripts are not different (P < 0.05).
20/20 = 20% protein/20% fat, 27/33 = 27% protein/33% fat, 29/16 = 29% protein/16% fat, WM = whole milk.
Conclusions
Calves fed WM showed superior performance (i.e., feed efficiency, ADG, and total weight gain) to other diets. Although calves fed 29/16 and 27/33 showed similar EBG, calves fed 29/16 did not increase body fat percentage. If one assumes that whole milk represents the desired standard optimum percentage of fat in a MR for Jersey calves fed 660 g of powder per d, the concentration should be greater than 16%, but less than 33%. Feeding Jersey bull calves a 20/20 MR at 15% of BW is not advisable given that growth of these calves was inferior to other diets in feed efficiency, ADG, and total weight gain. That all calves grew less than expected in near thermoneutral conditions suggests that nutrient requirements and, more specifically, maintenance requirements for small breed calves may be underestimated.
Acknowledgments
The authors would like to thank Stacy Wampler, C. Shai Huffard, and Curtis Caldwell for their assistance in feeding and caring for calves and Debbie Ross of Cornell University for help in laboratory preparation of samples for body composition determination. Support for this project was provided by the John Lee Pratt Foundation and Land O’Lakes Animal Milk Products.
Supplementary data
References
- Association of Official Analytical Chemists . 15th ed. Vol. I (or Vol. II.) AOAC; Arlington, VA: 1990. (Official Methods of Analysis). [Google Scholar]
- Attebery J.T., Colvin H.W., Jr. Effect of diet on fasting blood glucose levels in dairy calves 1 – 13 weeks old. J. Appl. Physiol. 1963;18:1221–1232. doi: 10.1152/jappl.1963.18.6.1221. [DOI] [PubMed] [Google Scholar]
- Bartlett K.S., McKeith F.K., Vandehaar M.J., Dahl G.E., Drackley J.K. Growth and body composition of dairy calves fed milk replacers containing different amounts of protein at two feeding rates. J. Anim. Sci. 2006;84:1454–1467. doi: 10.2527/2006.8461454x. [DOI] [PubMed] [Google Scholar]
- Blaxter K.L., Mitchell H.H. The factorization of the protein requirements of ruminants and of the protein value of feeds, with particular reference to the significance of the metabolic fecal nitrogen. J. Anim. Sci. 1948;7:351–372. [Google Scholar]
- Brisson G.J., Cunningham H.M., Haskell S.R. The protein and energy requirements of young calves. Can. J. Anim. Sci. 1957;37:157–167. [Google Scholar]
- Chaney A.L., Marbach E.P. Modified reagents for determination of urea and ammonia. Clin. Chem. 1962;8:130–132. [PubMed] [Google Scholar]
- Davis C.L., Drackley J.K. Iowa State Univ. Press; Ames: 1998. The Development, Nutrition, and Management of the Young Calf. [Google Scholar]
- Diaz M.C., Van Amburgh M.E., Smith J.M., Kelsey J.M., Hutten E.L. Composition of growth of Holstein calves fed milk replacer from birth to 105-kilogram body weight. J. Dairy Sci. 2001;84:830–842. doi: 10.3168/jds.S0022-0302(01)74541-9. [DOI] [PubMed] [Google Scholar]
- Donnelly P.E., Hutton J.B. Effects of dietary protein and energy on the growth of Friesian bull calves. I. Food intake, growth, and protein requirements. N.Z. J. Agric. Res. 1976;19:289–297. [Google Scholar]
- Drackley J.K., Pollard B.C., Dann H.M., Stamey J.A. First-lactation milk production for cows fed control or intensified milk replacer programs as calves. J. Dairy Sci. 2007;90(Suppl. 1):614. Abstr. [Google Scholar]
- Fleenor W.A., Stott G.H. Hydrometer test for estimation of immunoglobulin concentration in bovine colostrum. J. Dairy Sci. 1980;63:973–977. doi: 10.3168/jds.S0022-0302(80)83034-7. [DOI] [PubMed] [Google Scholar]
- Foldager, J., C. C. Krohn, and L. Mogensen. 1997. Level of milk for female calves affects their milk production in first lactation. Pages 1–5 in 48th Annu. Meet. Eur. Assoc. Anim. Prod. Paper No.C3.77.
- Gerrits W.J.J., Tolman G.H., Schrama S., Tamminga S., Bosch M.W., Verstegen W.A. Effect of protein and protein-free energy intake on protein and fat deposition rates in pre-ruminant calves of 80 to 240 kg live weight. J. Anim. Sci. 1996;74:2129–2139. doi: 10.2527/1996.7492129x. [DOI] [PubMed] [Google Scholar]
- Jenness R. Iowa State Univ. Press; Ames: 1985. Lactation. [Google Scholar]
- Jones C.M., James R.E., Quigley J.D., III, McGilliard M.L. Influence of pooled colostrum or colostrum replacement on IgG and evaluation of animal plasma in milk replacer. J. Dairy Sci. 2004;87:1806–1814. doi: 10.3168/jds.S0022-0302(04)73337-8. [DOI] [PMC free article] [PubMed] [Google Scholar]
- Lister E.E. Effects of heat treatment of skim-milk powder and levels of fat and protein in milk replacer diets on growth of calves. Can. J. Anim. Sci. 1971;51:735–742. [Google Scholar]
- National Research Council . Natl. Acad. Sci.; Washington, DC: 2001. Nutrient Requirements of Dairy Cattle. [Google Scholar]
- Odie J. New insights into the utilization of medium-chain triglycerides by the neonate: Observations from a piglet model. J. Nutr. 1997;127:1061–1067. doi: 10.1093/jn/127.6.1061. [DOI] [PubMed] [Google Scholar]
- Quigley J.D., III Influence of weaning method on growth, intake and selected blood metabolites in Jersey calves. J. Dairy Sci. 1996;79:2255–2260. doi: 10.3168/jds.S0022-0302(96)76602-X. [DOI] [PubMed] [Google Scholar]
- Quigley J.D., III, Caldwell G.D.S.L.A., Heitmann R.N. Changes in blood glucose, nonesterified fatty acids, and ketones in response to weaning and feed intake in young calves. J. Dairy Sci. 1991;74:250–257. doi: 10.3168/jds.S0022-0302(91)78167-8. [DOI] [PubMed] [Google Scholar]
- Raven A.M. Fat in milk replacers for calves. J. Sci. Food Agric. 1970;21:352–359. [Google Scholar]
- SAS Institute . SAS Institute Inc.; Cary, NC: 2002. SAS System for Windows, release 8.2. [Google Scholar]
- Scibilia L.S., Muller L.D., Kensinger R.S., Sweeney T.F., Shellenberger P.R. Effect of environmental temperature and dietary fat on growth and physiological response of newborn calves. J. Dairy Sci. 1986;70:1426–1433. doi: 10.3168/jds.S0022-0302(87)80165-0. [DOI] [PubMed] [Google Scholar]
- Sejrsen K., Purup S., Martinussen H., Vestergaard M. Effect of feeding level on mammary growth in calves and prepubertal heifers. J. Dairy Sci. 1998;81(Suppl. 1):1471. (Abstr.) [Google Scholar]
- Tikofsky J.N., Van Amburgh M.E., Ross D.A. Effect of varying carbohydrate and fat content of milk replacer on body composition of calves. J. Anim. Sci. 2001;79:2260–2267. doi: 10.2527/2001.7992260x. [DOI] [PubMed] [Google Scholar]
- Toullec R. Veal calves. In: Jarrige R., editor. Ruminant Nutrition Recommended Allowances and Feed Tables. John Libbey; London, UK: 1989. pp. 109–120. [Google Scholar]
- Toullec R., Theriez M., Thivend P. Milk replacers for calves and lambs. World Anim. Rev. 1980;33:32–42. [Google Scholar]
- Weatherburn M.W. Phenol-hypochlorite reaction for determination of ammonia. Anal. Chem. 1967;39:971–974. [Google Scholar]
Associated Data
This section collects any data citations, data availability statements, or supplementary materials included in this article.