

Abstract
The dimeric interface of severe acute respiratory syndrome coronavirus main protease is a potential target for the anti-SARS drug development. We have generated C-terminal truncated mutants by serial truncations. The quaternary structure of the enzyme was analyzed using both sedimentation velocity and sedimentation equilibrium analytical ultracentrifugation. Global analysis of the combined results showed that truncation of C-terminus from 306 to 300 had no appreciable effect on the quaternary structure, and the enzyme remained catalytically active. However, further deletion of Gln-299 or Arg-298 drastically decreased the enzyme activity to 1–2% of wild type (WT), and the major form was a monomeric one. Detailed analysis of the point mutants of these two amino acid residues and their nearby hydrogen bond partner Ser-123 and Ser-139 revealed a strong correlation between the enzyme activity loss and dimer dissociation.
Keywords: SARS coronavirus, Protease, Mutation, Dimer interface, Quaternary structure, Analytical ultracentrifuge
The severe acute respiratory syndrome coronavirus (SARS-CoV) 1 replicase gene encodes two overlapping polyproteins, polyprotein 1a and polyprotein 1ab. These polyproteins are cleaved by two internally encoded proteases (the main protease and a papain-like protease). Because of the functional significance of these two enzymes in the viral life cycle, these proteases represent attractive targets for the development of novel antiviral agents [1], [2], [3], [4], [5], [6].
Crystal structure of the main protease (3C-like protease) indicates an dimeric form [2], [7], [8]. Each subunit contains a catalytic dyad defined by His41 and Cys145 in the active site (Fig. 1 A). However, the enzyme is catalytically competent only after dimer formation [9], [10], [11], [12], [13], [14], [15], [16], [17], [18], [19], [20]. Molecular dynamic simulations provide some reasons for activation of the enzyme after association [7], [18], [21].
Fig. 1.
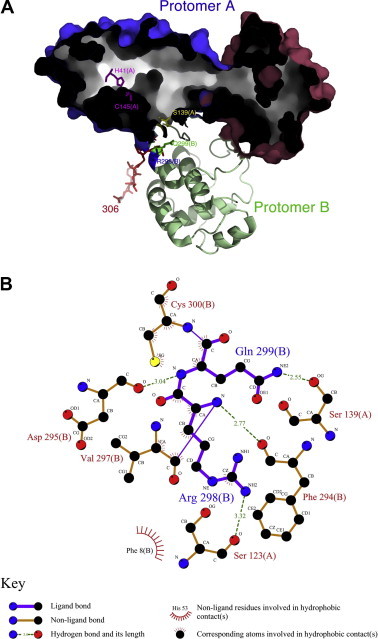
Structural features of the dimeric SARS-CoV main protease. (A) The enzyme structure (PDB code: 1z1j) is presented as a hollow surface model for protomer A and a ribbon model for protomer B. The catalytic dyad His-41 and Cys-145 (alanine in 1z1j) are shown with stick model in magenta in protomer A. The blue surface region represents the chymotrypsin-like fold. The red surface region indicates the helical domain III. The truncated C-terminal region is also shown with stick in protomer B for residues 300–306 in red, 299 in green, and 298 in blue. Figure generated with MacPyMol [29]. (B) LigPlot [30] of the interfacial region showing the hydrogen bonding of Arg-298 and Gln-299 in protomer B with Ser-123 and Ser-139 in protomer A. The subunit origin is enclosed in parentheses. The symbol keys are shown under the plot.
In this article, we have studied the functional role of C-terminal by serial truncations. The effect of mutation on the essential residues is then investigated. We have narrowed down the critical amino acid residues to two residues, Gln-299 and Arg-298, which are involved in dimerization and provide the correct conformation of the active site.
Materials and methods
Construction of WT, truncated, and mutated SARS-CoV main proteases
The genes of the full-length SARS-CoV main protease were amplified by polymerase chain reaction (PCR) with appropriate primers. The forward primer for the full-length WT SARS-CoV main protease was 5′-GGTGGTCATATGAGTGGTTTTAGG, and the reverse primer was 5′-AACTCGAGGGTAACACCAGAG. After digestion with BglII and XhoI, the PCR product was cut into two fragments, 168 bp and 747 bp. The 168 bp fragment was then digested with NdeI. Finally, the 168 bp NdeI–BglII and 747 bp BglII−XhoI fragments were coligated to the NdeI and XhoI sites of the vector pET-29a(+) (Novagen, Madison, WI).
The C-terminal truncated proteases were made by PCR. The forward and reverse mutagenic primers are listed in Table 1, Table 2 . The pET-SARS-CoV main protease vector was used as the template. The DNA polymerase Pfu (Promega, Madison, WI) extended and incorporated the mutagenic primers in the process of PCR. After 16–18 temperature cycles, the C-terminal truncated plasmid containing staggered nicks was generated. The PCR products were then treated with DpnI (New England Biolabs, Beverly, MA) to digest the template. Finally, the vector containing the protease cDNA with the desired mutation was transformed into Escherichia coli. The DNA sequences of the full-length, C-terminal truncated, and various mutant SARS-CoV main proteases were checked by autosequencing.
Table 1.
Primers for C-terminally truncated and single mutated SARS-CoV main protease
| Mutants | Sequences | |
|---|---|---|
| Δ(306) | Forward primer: | 5′-GGTGTTACCTTCCTCGAGCACCACCAC-3′ |
| Reverse primer: | 5′-GTGGTGGTGCTCGAGGAAGGTAACACC-3′ | |
| C-terminus⁎: | -FTPFDVVRQCSGVTFKEHHHHHH | |
| Δ(305–306) | Forward primer: | 5′-TCTGGTGTTACCCTCGAGCACCACCAC-3′ |
| Reverse primer: | 5′-GTGGTGGTGCTCGAGGGTAACACCAGA-3′ | |
| C-terminus: | -FTPFDVVRQCSGVTKEHHHHHH | |
| Δ(304–306) | Forward primer: | 5′-TGCTCTGGTGTTCTCGAGCACCACCAC-3′ |
| Reverse primer: | 5′-GTGGTGGTGCTCGAGAACACCAGAGCA-3′ | |
| C-terminus: | -FTPFDVVRQCSGVKEHHHHHH | |
| Δ(303–306) | Forward primer: | 5′-CAATGCTCTGGTCTCGAGCACCACCAC-3′ |
| Reverse primer: | 5′-GTGGTGGTGCTCGAGACCAGAGCATTG-3′ | |
| C-terminus: | -FTPFDVVRQCSGKEHHHHHH | |
| Δ(302–306) | Forward primer: | 5′-AGACAATGCTCTCTCGAGCACCACCAC-3′ |
| Reverse primer: | 5′-GTGGTGGTGCTCGAGAGAGCATTGTCT-3′ | |
| C-terminus: | -FTPFDVVRQCSKEHHHHHH | |
| Δ(301–306) | Forward primer: | 5′-GTTGTTAGACAATGCCTCGAGCACCACCAC-3′ |
| Reverse primer: | 5′-GTGGTGGTGCTCGAGGCATTGTCTAACAAC-3′ | |
| C-terminus: | -FTPFDVVRQCKEHHHHHH | |
| Δ(300–306) | Forward primer: | 5′-GATGTTGTTAGACAACTCGAGCACCACCAC-3′ |
| Reverse primer: | 5′-GTGGTGGTGCTCGAGTTGTCTAACAACATC-3′ | |
| C-terminus: | -FTPFDVVRQKEHHHHHH | |
| Δ(299–306) | Forward primer: | 5′-TTTGATGTTGTTAGACTCGAGCACCACCAC-3′ |
| Reverse primer: | 5′-GTGGTGGTGCTCGAGTCTAACAACATCAAA-3′ | |
| C-terminus: | -FTPFDVVRKEHHHHHH | |
| Δ(298–306) | Forward primer: | 5′-CCATTTGATGTTGTTCTCGAGCACCACCAC-3′ |
| Reverse primer: | 5′-GTGGTGGTGCTCGAGAACAACATCAAATGG-3′ | |
| C-terminus: | -FTPFDVVKEHHHHHH | |
| Δ(297–306) | Forward primer: | 5′-ACACCATTTGATGTTCTCGAGCACCACCAC-3′ |
| Reverse primer: | 5′-GTGGTGGTGCTCGAGAACATCAAATGGTGT-3′ | |
| C-terminus: | -FTPFDVKEHHHHHH | |
| S123A | Forward primer: | 5′-AATGGTTCACCAGCTGGTGTTTATCAG-3′ |
| Reverse primer: | 5′-CTGATAAACACCAGCTGGTGAACCATT-3′ | |
| C-terminus: | -FTPFDVVRQCSGVTFQKEHHHHHH | |
| S123C | Forward primer: | 5′- AATGGTTCACCATGTGGTGTTTATCAG-3′ |
| Reverse primer: | 5′-CTGATAAACACCACATGGTGAACCATT-3′ | |
| C-terminus: | -FTPFDVVRQCSGVTFQKEHHHHHH | |
| S139A | Forward primer: | 5′-ACCATTAAAGGTGCTTTCCTTAATGGA-3′ |
| Reverse primer: | 5′-TCCATTAAGGAAAGCACCTTTAATGGT-3′ | |
| C-terminus: | -FTPFDVVRQCSGVTFQKEHHHHHH | |
| R298A | Forward primer: | 5′-TTTGATGTTGTTGCACAATGCTCTGGT-3′ |
| Reverse primer: | 5′-ACCAGAGCATTGTGCAACAACATCAAA-3′ | |
| C-terminus: | -FTPFDVVAQCSGVTFQKEHHHHHH | |
| R298K | Forward primer: | 5′-TTTGATGTTGTTAAACAATGCTCTGGT-3′ |
| Reverse primer: | 5′-ACCAGAGCATTGTTTAACAACATCAAA-3′ | |
| C-terminus: | -FTPFDVVKQCSGVTFQKEHHHHHH | |
| R298L | Forward primer: | 5′-TTTGATGTTGTTTTACAATGCTCTGGT-3′ |
| Reverse primer: | 5′-ACCAGAGCATTGTAAAACAACATCAAA-3′ | |
| C-terminus: | -FTPFDVVLQCSGVTFQKEHHHHHH | |
| Q299A | Forward primer: | 5′-GATGTTGTTAGAGCATGCTCTGGTGTT-3′ |
| Reverse primer: | 5′-AACACCAGAGCATGCTCTAACAACATC-3′ | |
| C-terminus: | -FTPFDVVRACSGVTFQKEHHHHHH | |
| Q299E | Forward primer: | 5′-GATGTTGTTAGAGAATGCTCTGGTGTT-3′ |
| Reverse primer: | 5′-AACACCAGAGCATTCTCTAACAACATC-3′ | |
| C-terminus: | -FTPFDVVRECSGVTFQKEHHHHHH | |
| Q299K | Forward primer: | 5′-GATGTTGTTAGAAAATGCTCTGGTGTT-3′ |
| Reverse primer: | 5′-AACACCAGAGACTTTTCTAACAACATC-3′ | |
| C-terminus: | -FTPFDVVRKCSGVTFQKEHHHHHH | |
| Q299N | Forward primer: | 5′-GATGTTGTTAGAAACTGCTCTGGTGTT-3′ |
| Reverse primer: | 5′-AACACCAGAGCAGTTTCTAACAACATC-3′ | |
| C-terminus: | -FTPFDVVRNCSGVTFQKEHHHHHH | |
The N-terminus amino acid sequence is the same for all constructs and is identical to the authentic enzyme: N-SGFRKMAFPSGKVEGCMVQV-.
Table 2.
Primers for double mutated SARS-CoV main protease
| Mutants | Sequences | |
|---|---|---|
| S123A/R298A | Forward primer: | 5′-AATGGTTCACCAGCTGGTGTTTATCAG-3′ |
| Reverse primer: | 5′-CTGATAAACACCAGCTGGTGAACCATT-3′ | |
| Template: | pET-SARS main protease R298A vector | |
| S139A/Q299A | Forward primer: | 5′-ACCATTAAAGGTGCTTTCCTTAATGGA-3′ |
| Reverse primer: | 5′-TCCATTAAGGAAAGCACCTTTAATGGT-3′ | |
| Template: | pET-SARS main protease Q299A vector | |
| R298A/Q299A | Forward primer: | 5′-TTTGATGTTGTTGCACAATGCTCTGGT-3′ |
| Reverse primer: | 5′-ACCAGAGCATTGTGCAACAACATCAAA-3′ | |
| Template: | pET-SARS main protease Q299A vector | |
Preparation of recombinant SARS-CoV main proteases
The modified plasmids of the recombinant proteases were transformed into the E. coli strain BL21 (DE3) competent cells. The cells were grown at 37 °C in Luria–Bertani medium with 50 μg/ml Kanamycin until absorbance at 600 nm reached 0.8. The cells were then induced overnight by 1 mM isopropyl-1-thio-β-d-galactoside at 18 °C. The following operations were performed at 4 °C. The cells were centrifuged at 5000g for 10 min. The supernatant was removed and the pelleted cells were then suspended in Buffer A (20 mM Tris–HCl, 300 mM NaCl, and 2 mM 2-mercaptoethanol, pH 7.6) and sonicated for 10 min at 10-s burst cycle at 300 W with a 10-s cooling period between each burst. The cell debris was removed by centrifugation (10,000g; 25 min). One milliliter Buffer A-equilibrated Ni–NTA slurry (Qiagen, Hilden, Germany) was then added to the soluble lysate, and the solution was mixed gently for 50 min to reach the equilibrium. The lysate–Ni–NTA mixture was then loaded into a column and was washed with the washing buffer (20 mM imidazole in Buffer A). Finally, the protease was eluted with elution buffer (400 mM imidazole in Buffer A). The purified enzyme was concentrated and the buffer was replaced with 10 mM phosphate-buffered saline (PBS) (containing 10 mM sodium phosphate buffer, 150 mM NaCl, 2 mM 2-mercaptoethanol, pH 7.6) using Amicon Ultra-4 centrifugal filter units (Millipore, Bedford, MA) with molecular mass cutoff at 10 kDa. Sample from the purification step was subjected to sodium dodecyl sulfate–polyacrylamide gel electrophoresis to check the homogeneity.
Circular dichroism and fluorescence analyses
CD experiments were performed in a Jasco J-810 spectropolarimeter (Tokyo, Japan) equipped with a Neslab RTE-111 water-circulated thermal controller (Newington, NH). The samples were prepared in 10 mM PBS solution at pH 7.6 with a protein concentration of 0.5 mg/ml. Far-UV CD spectra from 250 to 190 nm were collected using a 0.01 cm path-length cuvette with a 0.1 nm spectral resolution at 25 °C. Ten independent scans were averaged for each sample. All spectra were corrected for buffer contributions and were converted to mean residue ellipticity ([Θ]). The [Θ] at each wavelength (θ λ) was calculated from Eq. (1),
| (1) |
where MRW is the mean residue weight (a value of 111.3 was used for the WT), θλ is the measured ellipticity in degree at wavelength λ, l is the cuvette path length (0.01 cm), and c is the protein concentration in g/ml. The secondary structure analysis was performed by DICHROWEB, which provides an interactive web site server allowing the deconvolution of data from circular dichroism spectroscopy experiments (website: http://www.cryst.bbk.ac.uk/cdweb/html/home.html).
Fluorescence experiments were performed in a Perkin-Elmer LS 50B luminescence spectrometer (Beaconsfield, Backinghamshire, England). The sample was prepared in 10 mM PBS solution at pH 7.6 with a protein concentration of 8 μg/ml. The fluorescence emission spectra from 300 to 400 nm were collected after excitation at 280 nm. Fluorescence spectra of proteins were determined with a 1 cm-path quartz cuvette at 25 °C. The spectral bandwidth was 5 nm for excitation and 10 nm for emission.
Analytical ultracentrifugation analysis
Analytical ultracentrifugation (AUC) was performed on a Beckman XL-A analytical ultracentrifuge (Fullerton, CA). All experiments were carried out at 20 °C with an An50 rotor. Sedimentation velocity (SV) was performed in a double-sector centerpiece at a speed of 42,000 rpm. The protein profiles were measured by UV absorbance at 280 nm in a continuous mode with time interval of 480 s. The recorded scans at various time points were collected and analyzed using the continuous size distribution model with the SEDFIT program [22]. The partial specific volume of the protease, solvent density, and viscosity were calculated by SEDNTERP (http://www.jphilo.mailway.com/).
Sedimentation equilibrium (SE) was performed in six-channel centerpieces at 8000, 12,000, and 16,000 rpm, each for 12 h. The WinMatch program (University of Connecticut, USA) can be used to check the equilibrium. The SV results at three protein concentrations and SE data at three rotor speeds were globally analyzed using a monomer–dimer equilibrium model by the SEDPHAT program [23], which gives a precise measurement of the dissociation constant (K d) and the dissociation rate constant (k off).
| (2) |
This global fitting method, successfully implemented in apolipoprotein [24] and polyA cleavage stimulating factor [25], provides the most reliable estimation of the dissociation constant and is recommended by many AUC experts [26].
Enzymatic activity assay of the SARS-CoV main protease using a fluorogenic substrate
The enzymatic activity of the SARS-CoV main protease was measured by a fluorescence-based peptide cleavage assay of the 11-mer peptide substrate, ortho-aminobenzoic acid (ABZ)-TSAVLQSGFRK-2,4-dinitrophenyl amide (DNP). The SARS-CoV main protease was cut at the Q↓S site of the internally quenched substrate and resulted in a fluorescence enhancement. When excited at 362 nm, the increase of fluorescence emission at 420 nm was continuously monitored with a Perkin Elmer 50B luminescence spectrometer. The calibration curve was constructed from equal amounts of N-terminal peptide (ABZ-TSAVLQ) and C-terminal peptide (SGFRK-DNP).
The protease activity assay was performed in PBS contained 1 to 49 μM substrate at 30 °C. In the routine assay, the concentration of WT was 0.29 μM and the concentrations of mutants were varied from 0.29 to 6.67 μM. Steady state enzyme kinetic parameters were obtained by fitting the initial velocity (vo) data to the Michaelis–Menten Eq. (3)
| (3) |
where k cat is the catalytic constant, [E] is the enzyme concentration, [S] is the substrate concentration, and K m is the Michaelis constant of the substrate. Commercial available program SigmaPlot (Jandel, San Rafael, CA, USA) was used in the data fitting.
Results and discussion
Purification of recombinant SARS-CoV main proteases
The recombinant WT, truncated, and mutated SARS-CoV main protease were successfully cloned and expressed in E. coli cells. These recombinant proteases were purified to homogeneity with yields in the range of 4–10 mg/ml. All these recombinant proteases had Mr ∼30 kDa that was nearly equal to the theoretical values. The CD spectra of these recombinant enzymes had no significant difference between 190 and 250 nm. The fluorescence emission spectra of the recombinant protease indicated that the overall structure had negligible difference after truncation or mutation (Fig. 2 ).
Fig. 2.
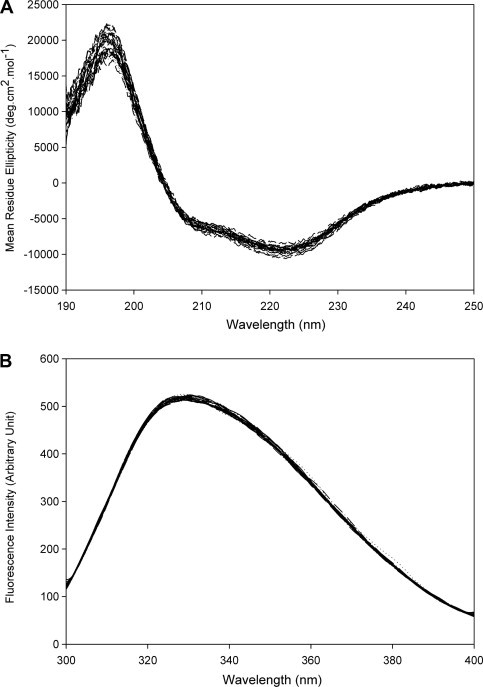
CD and fluorescence spectra of the full-length WT and truncated SARS-CoV main proteases. Far-UV CD and fluorescence emission spectra of all recombinant proteases were monitored at 0.5 mg/ml and 8 μg/ml, respectively, in 10 mM PBS buffer (pH 7.6) at 25 °C.
The recombinant proteases in this study had a His6-tag at the C-terminus. Huang et al. [27] had reported that the C-terminal His-tag did not have effects on the enzyme activity. Xue et al. [28] showed that additional residues at the N-terminus, but not at the C-terminus, of the main protease are detrimental to enzyme activity. However, Bacha et al. [15] showed that the N-terminal His-tag affected the K d. The N-His6- and C-His6-cleaved WT had K d of 0.35 and 5.6 μM, respectively [8], whereas the uncleaved N-His6- and C-His6-WT had K d of 0.19 μM [10] and 0.08 μM, respectively. As shown in Fig. 1A, His6 tag at the C-terminus is pointed away from the dimer interfacial region. It is reasonable to assume that it will not affect the quaternary structure of the C-terminal truncation mutants; but for those mutations at the inner site, it might create problems. However, with proper WT control, these mutants may still provide useful information about the critical amino acids. Considering these caveats, an attempt has been made to interpret the biological implications of the results obtained in this study.
The C-terminus was first approached by series truncations. The kinetic parameters of these proteases are summarized in Table 3 . The catalytic constant (k cat) and specificity constant (k cat/K m) of the proteases were significantly decreased in the Δ(299–306), Δ(298–306), and Δ(297–306). To obtain the entire picture of the involvement of the C-terminal in enzyme activity and dimerization, a complete AUC analysis was performed (Table 3).
Table 3.
Kinetic and dissociation parameters of the dimeric SARS-CoV main protease
| Recombinant SARS-CoV Main Protease | Kinetic parameters |
Dissociation parameters |
||||
|---|---|---|---|---|---|---|
| Kma (μM) | kcatb (10−3 s−1) | kcat/Kmc (nM−1 s−1) | Kdd (μM) | koffe (s−1) | ΔGo′f(kcal mol−1) | |
| WT | 11 ± 3 | 32 ± 3 | 3.0 ± 1 | 0.08 ± 0.005 | 0.01 ± 0.001 | −1.5 ± 0.09 |
| Δ(306) | 21 ± 7 | 43 ± 6 | 2.1 ± 0.7 | 0.1 ± 0.004 | 0.6 ± 0.03 | −1.3 ± 0.05 |
| Δ(305−306) | 14 ± 3 | 39 ± 0.4 | 2.7 ± 0.5 | 0.08 ± 0.005 | 0.14 ± 0.01 | −1.5 ± 0.09 |
| Δ(304–306) | 6 ± 1 | 27 ± 1 | 4.6 ± 0.9 | 0.007 ± 0.001 | 0.01 ± 0.001 | −2.9 ± 0.2 |
| Δ(303–306) | 4 ± 2 | 22 ± 3 | 5.9 ± 3 | 0.34 ± 0.02 | 0.08 ± 0.004 | −0.6 ± 0.04 |
| Δ(302–306) | 22 ± 7 | 30 ± 4 | 1.4 ± 0.6 | 0.6 ± 0.02 | 0.01 ± 0.001 | −0.3 ± 0.01 |
| Δ(301–306) | 30 ± 14 | 25 ± 6 | 0.8 ± 0.4 | 0.3 ± 0.01 | 0.1 ± 0.003 | −0.7 ± 0.02 |
| Δ(300–306) | 15 ± 5 | 17 ± 3 | 1.1 ± 0.4 | 0.07 ± 0.003 | 0.05 ± 0.002 | −1.6 ± 0.07 |
| Δ(299–306) | 13 ± 3 | 1 ± 0.1 | 0.08 ± 0.02 | 49 ± 4 | 2.3 ± 0.1 | 2.3 ± 0.2 |
| Δ(298–306) | 30 ± 12 | 0.6 ± 0.1 | 0.02 ± 0.01 | 313 ± 22 | 36 ± 2.2 | 3.4 ± 0.2 |
| Δ(297–306) | 21 ± 5 | 0.04 ± 0.004 | 0.002 ± 0.001 | 393 ± 39 | 123±9.8 | 3.5 ± 0.3 |
| R298A | 11 ± 4 | 3.4 ± 0.7 | 0.3 ± 0.1 | 193 ± 10 | 63 ± 3 | 3.1 ± 0.2 |
| R298K | 16 ± 6 | 17 ± 3 | 1.1 ± 0.5 | 1.5 ± 0.01 | 4.6 ± 0.02 | 0.2 ± 0.001 |
| R298L | 13 ± 4 | 4.8 ± 0.7 | 0.4 ± 0.1 | 45 ± 6 | 1.1 ± 0.1 | 2.2 ± 0.3 |
| R298A/Q299A | 10 ± 5 | 0.21 ± 0.1 | 0.02 ± 0.01 | 218 ± 9 | 61 ± 2.4 | 3.1 ± 0.1 |
| Q299A | 18 ± 7 | 0.7 ± 0.1 | 0.04 ± 0.02 | 61 ± 9 | 8.7 ± 0.9 | 2.4 ± 0.4 |
| Q299E | 5 ± 2 | 2.2 ± 0.2 | 0.4 ± 0.1 | 90 ± 14 | 0.2 ± 0.02 | 2.6 ± 0.4 |
| Q299K | 37 ± 24 | 2.1 ± 0.7 | 0.06 ± 0.04 | 19 ± 1 | 5.1 ± 0.2 | 1.7 ± 0.1 |
| Q299N | 5 ± 1 | 1.7 ± 0.1 | 0.4 ± 0.01 | 52 ± 6 | 1.2 ± 0.1 | 2.2 ± 0.1 |
| S123A | 13 ± 7 | 33 ± 7 | 2.6 ± 1.4 | 0.8 ± 0.04 | 0.02 ± 0.001 | −0.1 ± 0.01 |
| S123A/R298A | 12 ± 9 | 6.9 ± 2 | 0.6 ± 0.5 | 24 ± 2 | 3.0 ± 0.2 | 1.9 ± 0.2 |
| S123C | 13 ± 5 | 35 ± 3 | 2.7 ± 1.0 | 0.9 ± 0.1 | 0.1 ± 0.01 | −0.06 ± 0.03 |
| S139A | 10 ± 4 | 33 ± 3 | 3.2 ± 1.2 | 0.4 ± 0.01 | 0.2 ± 0.002 | −0.5 ± 0.01 |
| S139A/Q299A | 21 ± 9 | 4.8 ± 1 | 0.2 ± 0.1 | 22 ± 1 | 1.1 ± 0.04 | 1.8 ± 0.1 |
Michaelis constant for the 11-mer peptide ABZ-TSAVLQSGFRK-DNP.
Catalytic constant for the 11-mer peptide ABZ-TSAVLQSGFRK-DNP.
Specificity constant for the 11-mer peptide ABZ-TSAVLQSGFRK-DNP.
Dissociation equilibrium constant of the system.
Dissociation rate constant of the system.
Dissociation Gibb’s free energy of the system.
C-terminal truncated mutants of the recombinant SARS-CoV main protease
The monomeric and dimeric SARS-CoV main protease was sedimented at 2.4 S and 4.2 S, respectively (Fig. 3 ). Wild type and Δ(300–306) proteases existed with dimer as the major form (Fig. 3A and E). However, the major form became monomeric in Δ(299–306) (Fig. 3F), Δ(298–306) (Fig. 3G), and Δ(297–306) (Fig. 3H). To obtain a quantitative measurement, the dissociation constants (K d) of these proteases were calculated by the global analysis of the combined SE and SV data by fitting to a monomer–dimer self-association model using the SEDPHAT program (Fig. 4 ). The K d values of Δ(299–306) and Δ(298–306) were 600- and 3900-fold larger than that of WT and the Gibb’s free energy became positive (Table 3). Our previous studies indicated that the last α-helix in the SARS-CoV main protease participated in the dimerization [12]. In this article, the critical region of two amino acid residues, Arg-298 and Gln-299, were further narrowed down.
Fig. 3.
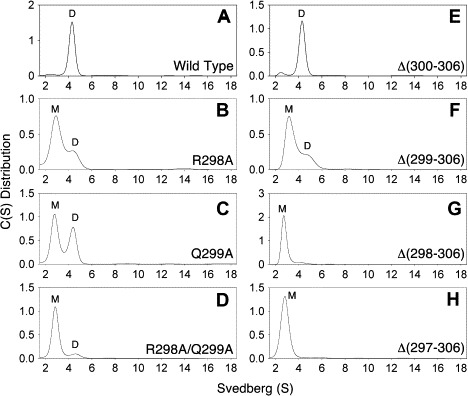
Continuous sedimentation coefficient distribution of the recombinant SARS-CoV main protease. All enzyme preparations used a concentration of 1 mg/ml in 10 mM PBS buffer (pH 7.6). (A) WT; (B) R298A; (C) Q299A; (D) R298A/Q299A; (E) Δ(300–306); (F) Δ(299–306); (G) Δ(298–306); (H) Δ(297–306). The peaks corresponding to monomer and dimer are indicated.
Fig. 4.
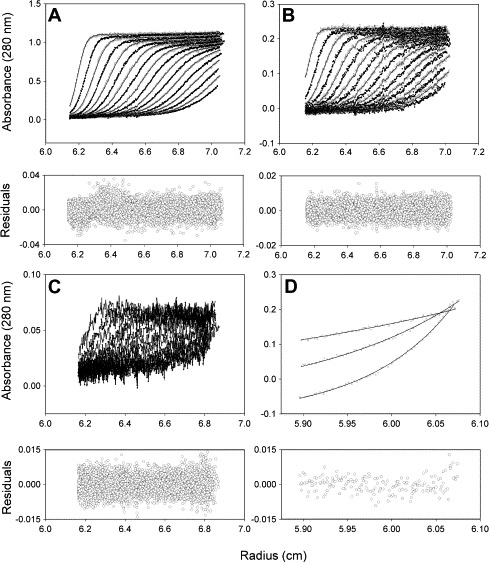
Global analysis of the sedimentation velocity and sedimentation equilibrium data of WT SARS-CoV main protease. (A–C) Sedimentation velocity at three protein concentrations: 1.0, 0.2, and 0.04 mg/ml, respectively. (D) Sedimentation equilibrium of 0.2 mg/ml enzyme at three rotor speeds: 8000; 10,000; and 12,000 rpm, each for 12 h. The sedimentation profiles were monitored with the absorbance optical system at wavelength of 280 nm. All spectral data were globally fitted to a monomer–dimer equilibrium model with Lamm equation implemented in the software SEDPHAT [23]. The symbols are the raw sedimentation data and the lines are the theoretical fitted data. The fitting residuals are under each panel.
Arg-298 and Gln-299 mutants of the recombinant SARS-CoV main protease
To delineate the essential role of these two residues, each or both of them were replaced with other amino acid residues by site-specific mutagenesis. In the alanine-substituted mutants, the quaternary structures of R298A and Q299A were found to exist in a mixture of monomeric and dimeric forms (Fig. 3B and C). These data were complementary to the earlier-mentioned truncated proteases data. Yet, we found the double mutant, R298A/Q299A, was present almost exclusively in the monomeric form (Fig. 3D). This finding indicated that both residues were crucial to dimerization. Arg-298 that was changed to leucine also destroyed 85% of the enzyme activity (k cat) (Table 3), whereas Arg-298 that was changed to lysine had no significant difference to WT in k cat. Gln-299 that changed to glutamate, lysine, or asparagine also ruined more than 90% of the enzyme activity (Table 3).
Ser-123 and Ser-139 mutants of the recombinant SARS-CoV main protease
Structural studies of the main protease indicate two interfacial S123-R298 and S139-Q299 hydrogen-bonding pairs (Fig. 1B). To further characterize the role of these two residues in the activity and the dimeric stability of the enzyme, several single mutants (S123A, S123C, and S139A) and two double mutants (S123A/R298A and S139A/Q299A) were constructed. Mutation at S123 to Ala and Cys did not destroy the enzyme activity, and the dimeric structure remained intact. Mutation at S139 to Ala could destroy neither the enzyme activity nor the dimeric structure (Table 3). Significant difference with WT in enzyme activity and dimeric stability were found only in the double mutants, S123A/R298A and S139A/Q299A. The functional role of these serine residues was not clear. Similar results on S139A were reported by Barrila et al. [17].
It is interesting to note that the dimer association in S123A/R298A (K d, 24 μM) and S139A/Q299A (K d, 22 μM) double mutants is actually tighter than those in the R298A (K d, 193 μM) and Q299A (K d, 61 μM) single mutants. Increased hydrophobic interactions between the subunits of the double mutants might be accounted for these seem odd results. We have no further structural evidence to prove this speculation yet. However, we have a large number of mutants in hand that allow us to evaluate the correlation between the kinetic and dimerization properties of the enzyme.
Correlation between kinetic parameters and dissociation constant or dissociation rate constant
This study demonstrated that the secondary or tertiary structure of these proteases was not significantly different from those of WT (Fig. 2). The kinetic and dissociation parameters of these proteases implied that the enzyme activity was related only to quaternary structure. On the basis of the database established in the previous sections, the correlation between enzyme kinetic parameters and AUC-determined subunit dissociation parameters was found.
The relationship of kinetic determined specificity constant (K m/k cat), Michaelis constant (K m), and catalytic constant (k cat); AUC-determined dimer–monomer dissociation constant (K d), and dissociation rate constant (k off) are summarized in Fig. 5 . Although K d increased as the K m/k cat and k cat decreased, K m did not. This data suggested that K d was related to the catalysis but not to the apparent binding ability between substrate and proteases. Similar observations were found for the relationship between K m/k cat, K m, k cat, and k off. The k off also affected only the catalytic rate but not the substrate binding ability. The increase of K d and k off correlated with the increase of monomeric form protease, which also correlated directly with the decrease of enzyme activity. All these results indicated that the monomeric SARS-CoV main protease was enzymatically inactive and this enzyme provides an ideal model system to study an enzyme activity regulated through quaternary structure.
Fig. 5.
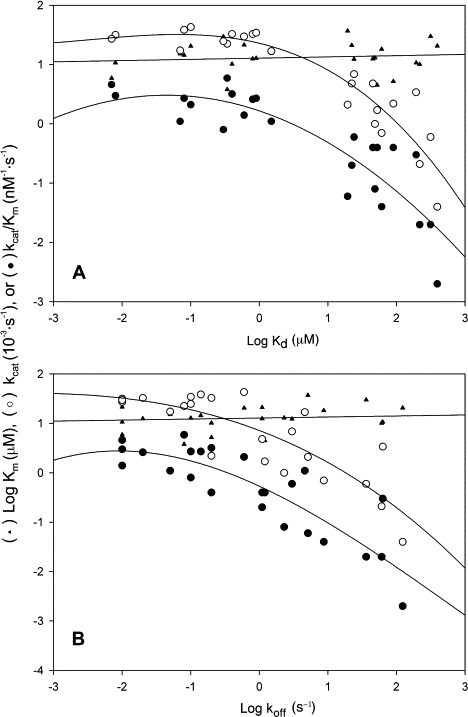
Correlation between the enzyme activity loss and subunit dissociation of SARS-CoV main protease. Double logarithmic plot showing the correlation between kinetic parameters and equilibrium dissociation constant (A) or dissociation rate constant (B).
Acknowledgments
This work was supported by the National Science Council, ROC. A preliminary report had been presented at the 22nd Joint Annual Conference of Biomedical Sciences (Taipei) and was awarded poster of the year (2007) by the Taiwan Biochemical and Molecular Biology Society to P.Y.L. and C.Y.C. Portions of this work were submitted by P.Y.L. in partial fulfillment of a M.S. degree, National Yang-Ming University, Taipei.
Footnotes
Abbreviations used: SARS, severe acute respiratory syndrome; CoV, coronavirus; WT, wild type; Δ(n1-n2), deletion mutant of the SARS-CoV main protease with the amino acid residues from n1 to n2 deleted; PBS, phosphate-buffered saline; ABZ, ortho-aminobenzoic acid; DNP, 2,4-dinitrophenyl amide; CD, circular dichroism; AUC, analytical ultracentrifugation; SV, sedimentation velocity; SE, sedimentation equilibrium.
References
- 1.Anand K., Ziebuhr J., Wadhwani P., Mesters J.R., Hilgenfeld R. Science. 2003;300:1763–1767. doi: 10.1126/science.1085658. [DOI] [PubMed] [Google Scholar]
- 2.Yang H., Yang M., Ding Y., Liu Y., Lou Z., Zhou Z., Sun L., Mo L., Ye S., Pang H., Gao G.F., Anand K., Bartlam M., Hilgenfeld R., Rao Z. Proc. Natl. Acad. Sci. USA. 2003;100:13190–13195. doi: 10.1073/pnas.1835675100. [DOI] [PMC free article] [PubMed] [Google Scholar]
- 3.Shi J., Wei Z., Song J. J. Biol. Chem. 2004;279:24765–24773. doi: 10.1074/jbc.M311744200. [DOI] [PMC free article] [PubMed] [Google Scholar]
- 4.Liang P.H. Curr. Top. Med. Chem. 2006;6:361–376. doi: 10.2174/156802606776287090. [DOI] [PubMed] [Google Scholar]
- 5.Ratia K., Saikatendu K.S., Santarsiero B.D., Barretto N., Baker S.C., Stevens R.C., Mesecar A.D. Proc. Natl. Acad. Sci. USA. 2006;103:5717–5722. doi: 10.1073/pnas.0510851103. [DOI] [PMC free article] [PubMed] [Google Scholar]
- 6.C.Y. Chou, C.H. Chien, Y.S. Han, M.T. Prebanda, H.P. Hsieh, B. Turk, G.G. Chang, X. Chen, Biochem. Pharmacol., in press. [DOI] [PMC free article] [PubMed]
- 7.Tan J., Verschueren K.H., Anand K., Shen J., Yang M., Xu Y., Rao Z., Bigalke J., Heisen B., Mesters J.R., Chen K., Shen X., Jiang H., Hilgenfeld R. J. Mol. Biol. 2005;354:25–40. doi: 10.1016/j.jmb.2005.09.012. [DOI] [PMC free article] [PubMed] [Google Scholar]
- 8.Hsu M.F., Kuo C.J., Chang K.T., Chang H.C., Chou C.C., Ko T.P., Shr H.L., Chang G.G., Wang A.H., Liang P.H. J. Biol. Chem. 2005;280:31257–31266. doi: 10.1074/jbc.M502577200. [DOI] [PMC free article] [PubMed] [Google Scholar]
- 9.Anand K., Palm G.J., Mesters J.R., Siddell S.G., Ziebuhr J., Hilgenfeld R. EMBO J. 2002;21:3213–3224. doi: 10.1093/emboj/cdf327. [DOI] [PMC free article] [PubMed] [Google Scholar]
- 10.Chou C.Y., Chang H.C., Hsu W.C., Lin T.Z., Lin C.H., Chang G.G. Biochemistry. 2004;43:14958–14970. doi: 10.1021/bi0490237. [DOI] [PubMed] [Google Scholar]
- 11.Fan K., Wei P., Feng Q., Chen S., Huang C., Ma L., Lai B., Pei J., Liu Y., Chen J., Lai L. J. Biol. Chem. 2004;279:1637–1642. doi: 10.1074/jbc.M310875200. [DOI] [PMC free article] [PubMed] [Google Scholar]
- 12.Hsu W.C., Chang H.C., Chou C.Y., Tsai P.J., Lin P.I., Chang G.G. J. Biol. Chem. 2005;280:22741–22748. doi: 10.1074/jbc.M502556200. [DOI] [PMC free article] [PubMed] [Google Scholar]
- 13.Chang H.P., Chou C.Y., Chang G.G. Biophys. J. 2007;92:1374–1383. doi: 10.1529/biophysj.106.091736. [DOI] [PMC free article] [PubMed] [Google Scholar]
- 14.Ding L., Zhang X.X., Wei P., Fan K., Lai L. Anal. Biochem. 2005;343:159–165. doi: 10.1016/j.ab.2005.04.027. [DOI] [PMC free article] [PubMed] [Google Scholar]
- 15.Bacha U., Barrila J., Velazquez-Campoy A., Leavitt S.A., Freire E. Biochemistry. 2004;43:4906–4912. doi: 10.1021/bi0361766. [DOI] [PubMed] [Google Scholar]
- 16.Chen S., Chen L., Tan J., Chen J., Du L., Sun T., Shen J., Chen K., Jiang H., Shen X. J. Biol. Chem. 2005;280:164–173. doi: 10.1074/jbc.M408211200. [DOI] [PMC free article] [PubMed] [Google Scholar]
- 17.Barrila J., Bacha U., Freire E. Biochemistry. 2006;45:14908–14916. doi: 10.1021/bi0616302. [DOI] [PMC free article] [PubMed] [Google Scholar]
- 18.Chen H., Wei P., Huang C., Tan L., Liu Y., Lai L. J. Biol. Chem. 2006;281:13894–13898. doi: 10.1074/jbc.M510745200. [DOI] [PMC free article] [PubMed] [Google Scholar]
- 19.Graziano V., McGrath W.J., Yang L., Mangel W.F. Biochemistry. 2006;45:14632–14641. doi: 10.1021/bi061746y. [DOI] [PubMed] [Google Scholar]
- 20.Shi J., Song J. FEBS J. 2006;273:1035–1045. doi: 10.1111/j.1742-4658.2006.05130.x. [DOI] [PMC free article] [PubMed] [Google Scholar]
- 21.Zheng K., Ma G., Zhou J., Zen M., Zhao W., Jiang Y., Yu Q., Feng J. Proteins. 2007;66:467–479. doi: 10.1002/prot.21160. [DOI] [PMC free article] [PubMed] [Google Scholar]
- 22.Schuck P. Biophys. J. 2000;78:1606–1619. doi: 10.1016/S0006-3495(00)76713-0. [DOI] [PMC free article] [PubMed] [Google Scholar]
- 23.Schuck P. Anal. Biochem. 2003;320:104–124. doi: 10.1016/s0003-2697(03)00289-6. [DOI] [PubMed] [Google Scholar]
- 24.Chou C.Y., Jen W.P., Hsieh Y.H., Shiao M.S., Chang G.G. J. Biol. Chem. 2006;281:13333–13344. doi: 10.1074/jbc.M511077200. [DOI] [PubMed] [Google Scholar]
- 25.Bai Y., Auperin T.C., Chou C.Y., Chang G.G., Manley J.L., Tong L. Mol. Cell. 2007;25:863–875. doi: 10.1016/j.molcel.2007.01.034. [DOI] [PubMed] [Google Scholar]
- 26.Howlett G.J., Minton A.P., Rivas G. Curr. Opin. Chem. Biol. 2006;10:430–436. doi: 10.1016/j.cbpa.2006.08.017. [DOI] [PubMed] [Google Scholar]
- 27.Huang C., Wei P., Fan K., Liu Y., Lai L. Biochemistry. 2004;43:4568–4574. doi: 10.1021/bi036022q. [DOI] [PubMed] [Google Scholar]
- 28.Xue X., Yang H., Shen W., Zhao Q., Li J., Yang K., Chen C., Jin Y., Bartlam M., Rao Z. J. Mol. Biol. 2007;366:965–975. doi: 10.1016/j.jmb.2006.11.073. [DOI] [PMC free article] [PubMed] [Google Scholar]
- 29.DeLano W.L. DeLano Scientific; San Carlos, CA, USA: 2007. Pymol manual. [Google Scholar]
- 30.Wallace A.C., Laskowski R.A., Thornton J.M. Protein Eng. 1995;8:127–134. doi: 10.1093/protein/8.2.127. [DOI] [PubMed] [Google Scholar]