

Abstract
Visibility in Hong Kong has deteriorated significantly over 40 years with visibility below 8 km in the absence of fog, mist, or precipitation, increasing from 6.6 days in 1968 to 54.1 days in 2007. We assessed the short-term mortality effects of daily loss of visibility. During 1996–2006, we obtained mortality data for non-accidental and cardiorespiratory causes, visibility recorded as visual range in kilometers, temperature, and relative humidity from an urban observatory, and concentrations of four criteria pollutants. A generalized additive Poisson regression model with penalized cubic regression splines was fitted to control for time variant covariates. For non-accidental mortality, an interquartile range (IQR) of 6.5 km decrease in visibility at lag 0–1 days was associated with an excess risk (ER%) [95% CI] of 1.13 [0.49, 1.76] for all ages and 1.37 [0.65, 2.09] for ages 65 years and over; for cardiovascular mortality of 1.31 [0.13, 2.49] for all ages, and 1.72 [0.44, 3.00] for ages 65 years and over; and for respiratory mortality of 1.92 [0.49, 3.35] for all ages and 1.76 [0.28, 3.25] for ages 65 years and over. The estimated ER% for daily mortality derived from both visibility and air pollutant data were comparable in terms of magnitude, lag pattern, and exposure–response relationships especially when using particulate matter with aerodynamic diameter ≤10 μm to predict the mortality associated with visibility. Visibility provides a useful proxy for the assessment of environmental health risks from ambient air pollutants and a valid approach for the assessment of the public health impacts of air pollution and the benefits of air quality improvement measures in developing countries where pollutant monitoring data are scarce.
Keywords: Visibility, Mortality, Air pollution, Time series, Hong Kong
Abbreviations: Ages ≥65 years, ages 65 years and over; CI, confidence interval; df, degrees of freedom; ER%, excess risk in percent in daily mortality for a decrease in visibility; km, kilometer; ICD-10, tenth revision of the international classification of diseases; ICD-9, ninth revision of the international classification of diseases; IQR, interquartile range; NO2, nitrogen dioxide; O3, ozone; PM10, particulate matter with aerodynamic diameter less than or equal to (≤) 10 micrometers; PM2.5, particulate matter with aerodynamic diameter less than or equal to (≤) 2.5 micrometers; SO2, sulfur dioxide; TEOM, tapered element oscillating microbalance; μg m−3, microgram per cubic meter; μm, micrometer
1. Introduction
Loss of visibility is an easily measured manifestation of air pollution, arising from a loss of contrast between the object and the background and attenuation of the light signal from the object due to scattering and absorption of light by fine particulates and gaseous pollutants (Sloane and White, 1986). In urban areas, it is regarded as a primary index of ambient air quality (Watson, 2002).
Visibility in Hong Kong has deteriorated significantly over 40 years and the number of days with visibility below 8 km in the absence of fog, mist, or precipitation has substantially increased from 6.6 days in 1968 to 54.1 days in 2007 (Hong Kong Observatory, 2009). Hong Kong is located in the Pearl River Delta region in southern China where increasing fossil fuel consumption has resulted in a rapid growth of anthropogenic emissions and thereby has led to an increase in air pollution and degradation in visibility (Streets and Waldhoff, 2000). This is attributed to increase in the concentrations of fine particulate matter (PM2.5) and photochemical pollutants, which increase the scattering of light (Sequeira and Lai, 1998a, Ho et al., 2003).
In Hong Kong, ambient air pollution is associated with a wide range of adverse health effects in children and adults including respiratory illness (Peters et al., 1996), impaired lung function (Wong et al., 1998), increased consultations with physicians (Wong et al., 2002a), hospital admissions, and premature deaths from cardiopulmonary disease (Wong et al., 2001, Wong et al., 2002b, Wong et al., 2008a, Hedley et al., 2002), mostly at levels well below the currently adopted air quality objectives in Hong Kong (Hong Kong EPD, 2010). Air pollution has been identified as a major cause of increasing community costs due to health care utilization and lost productivity (Hedley et al., 2008). Previous studies, which assessed the association between fine particulates and mortality used various measures as indicators of air pollution, including coefficient of extinction, coefficient of haze, and airport visibility to estimate PM2.5 and PM10 (Ozkaynak et al., 1985, Abbey et al., 1995, Ostro, 1995, Vajanapoom et al., 2001, Jerrett et al., 2004). However, apart from two studies, one showing that visibility loss was directly associated with sudden infant death syndrome in Taiwan (Knobel et al., 1995) and a second on the relationship between visibility and population mortality in Shanghai (Huang et al., 2009), no other reports have shown links between visibility and ill health or mortality. We aimed to assess the associations between variations in daily visibility and mortality in Hong Kong for the period 1996–2006 using several sensitivity analyses based on the mean visibility recorded at 10:00, 14:00, and 16:00 h, 24 h maximum visibility, different cut-off limits for humidity, and adjustments for air pollutants.
2. Materials and methods
2.1. Mortality
Daily mortality data for the eleven year period from January 1996 to December 2006 were obtained from the Hong Kong Census and Statistics Department including date of death and underlying cause of death coded according to the International Classification of Diseases, ninth revision (ICD-9) or tenth revision (ICD-10). The main health outcome of this study comprised all known non-accidental deaths of Hong Kong residents (ICD-9:1-799; ICD-10: A00-R99), as well as cardiovascular (ICD-9:390-459; ICD-10:I00-I99), respiratory (ICD-9:460-519; ICD-10:J00-J98), and accidental mortalities (ICD-9: 800-999; ICD-10: S00-T98). We chose two age groups for analyses: all ages and a subgroup aged 65 years and over. An assessment of the discrepancy between the classification of causes of deaths using ICD-9 and ICD-10 showed that agreement between the two coding systems was over 90% (Hong Kong Department of Health, 2005).
2.2. Visibility and meteorological conditions
For the period 1996–2006, visibility data measured at the Hong Kong Observatory were recorded as the visual range in kilometers. The hourly observations of horizontal visibility were made by naked eye from 0:00 to 23:00 h by specially trained observers using suitable targets at various distances in accordance with procedures established by the World Meteorological Organization guidelines (Pueschel, 1983, World Meteorological Organization, 2010). Visibility observations were averaged to provide 24 hour mean visibility. Hourly meteorological conditions were also available at the Hong Kong Observatory including mean temperature in Celsius and mean relative humidity in percent. There were no missing visibility and meteorological observations during the period of study. The average numbers of hazy days were estimated by the hourly visibility and humidity data. They were calculated by the annual proportion of hours with visibility ≤8 km and humidity ≤80%, and then multiplied by 365 or 366 days.
2.3. Concentrations of air pollutants
Air pollutant data from the Environmental Protection Department’s eight monitoring stations included daily 24 h average concentrations of particulate matter with aerodynamic diameter ≤10 μm (PM10), nitrogen dioxide (NO2), sulfur dioxide (SO2), and 8 hour (10:00–18:00 hours) mean concentrations of ozone (O3). Measurements of PM10, NO2, SO2, and O3 were, respectively, made by tapered element oscillating microbalance (TEOM), chemiluminescence, fluorescence, and ultra violet absorption. Daily concentrations were valid if more than 17/24 h or 5/8 h (in the case of O3) were available (U.S. EPA, 1999, Wong et al., 2008a). The eight monitoring stations considered in this study are stations situated at an average of 20 m above ground level with no roadside stations included. Concentrations of pollutants from all stations providing data were averaged to provide daily estimates across the city. There were no missing values for the four pollutants during the period of study.
2.4. Statistical analysis
We developed core models with a generalized additive Poisson regression allowing for over-dispersion in the model (Wood, 2006). For each mortality outcome, variations in seasonality, trends, mean temperature, and mean humidity of current and previous days (lag 0–1) were fitted with penalized cubic regression splines. Dummy variables were used to control the variations for days of the week, holidays, and influenza epidemics. We added a dummy variable for the 2003 severe acute respiratory syndrome (SARS) epidemic. We chose 4 degrees of freedom (df) per year for smoothing function of the trends and 3 df for temperature and humidity. The choice of df for each smoothing function in the core models was made on the basis of observed residual autocorrelations using partial autocorrelation function (PACF). For the core models fitted to the mortality data, time variant confounding factors were considered as adequately controlled if absolute values of PACF coefficients were <0.1 for the first two lag days and there were no systematic patterns in the PACF plots (Wong et al., 2008a).
Following the construction of an adequate core model for each mortality outcome, we entered visibility as a linear term into the regression model and examined the effects of visibility on mortality for single day lags 0–5 days, lag 0–1, and distributed lag 0–4 days (Schwartz, 2000, Zanobetti et al., 2000). The distributed lag effect take into account the possibility that visibility can affect deaths occurring on the same day and on several subsequent days. The net effect of visibility was the sum of the effect estimates for all six days. We expressed the effect of visibility as the percentage change in daily mortality with a decrease in the interquartile range (IQR) of visibility as 100%×IQR×β, where β is the estimated Poisson regression coefficient, and referred to as the excess risk (ER%).
We conducted sensitivity analyses to examine the robustness of the effect estimates for non-accidental mortality at all ages as follows:
-
1.
Degrees of freedom for trends: using 3 and 5 df per year for smoothing the time trends in the core model.
-
2.
Exclusion of visibility with cut-off limit for humidity: we screened hourly visibility readings and excluded those associated with humidity >80% or >90% or wet conditions including fog, mist, and precipitation and calculated 24 h mean visibility on this basis.
-
3.
Metric used for visibility: We used the mean visibility based on the three measurements recorded at 10:00, 14:00, and 16:00 hours, and the 24 h maximum visibility in place of 24 h mean visibility.
-
4.
Exclusion of extreme visibility range: we excluded readings of visibility less than 8 km; less than the 25th percentile; or less than the 5th percentile of visibility, by regarding them as missing.
-
5.
Adjustment for air pollutants: we adjusted for each of the four pollutants PM10, NO2, O3, or SO2 in turn at lag 0–1 in the models.
-
6.
Average lag 0–2 days for temperature and humidity: we substituted average of current day and previous two days (lag 0–2 days) for temperature and humidity in the core models in place of lag 0–1 days.
-
7.
Natural cubic regression splines: We fitted natural cubic regression splines in place of penalized cubic regression splines.
All analyses were performed using the statistical software package R version 2.9.1 (R Development Core team, 2009) with mgcv package version 1.5–5.
3. Results
3.1. Mortality, visibility, air pollutants, and meteorology
There were about 360,000 deaths during the period of study. For non-accidental mortality, the number of daily deaths at all ages ranged from 48 to 153 per day; 6 to 56 for cardiovascular mortality, and 3 to 41 for respiratory mortality. Air pollutant mean values in μgm−3 were PM10: 53.7; NO2: 59.0; O3: 38.4; and SO2: 19.6 ( Table 1). The Spearman correlations between pollutants were positive ranging from r=0.29 to 0.80, with the exception of the correlation between O3 and SO2 (r=−0.06).
Table 1.
Distribution of daily visibility, mortality counts, and meteorological measurements in Hong Kong, 1996–2006 (N=4018 days).
| Mean | SD | Percentiles | IQR | |||||
|---|---|---|---|---|---|---|---|---|
| Min | 25th | 50th | 75th | Max | ||||
| Visibilitya (km) | 13.3 | 5.3 | 1.2 | 9.6 | 12.4 | 16.1 | 31.3 | 6.5 |
| Pollutant (μg m−3) | ||||||||
| PM10 | 53.7 | 27.0 | 13.7 | 32.4 | 47.9 | 69.9 | 210.7 | 37.5 |
| NO2 | 59.0 | 20.8 | 10.3 | 44.8 | 56.5 | 70.4 | 169.0 | 25.6 |
| O3 | 38.4 | 24.3 | 0.7 | 19.3 | 32.7 | 53.1 | 195.0 | 33.8 |
| SO2 | 19.6 | 14.1 | 1.4 | 10.4 | 16.0 | 24.4 | 143.5 | 14.0 |
| Temperatures (°C) | 23.6 | 5.0 | 6.9 | 19.6 | 24.8 | 27.7 | 31.8 | 8.1 |
| Humidity (%) | 78.1 | 9.9 | 27.5 | 73.6 | 79.3 | 84.7 | 98.1 | 11.0 |
| Non-accidental | ||||||||
| All ages | 89.0 | 14.4 | 48.0 | 79.0 | 88.0 | 98.0 | 153.0 | 19.0 |
| Ages ≥65 years | 69.9 | 13.4 | 35.0 | 60.0 | 68.0 | 78.0 | 131.0 | 18.0 |
| Cardiovascular | ||||||||
| All ages | 24.8 | 6.8 | 6.0 | 20.0 | 24.0 | 29.0 | 56.0 | 9.0 |
| Ages ≥65 years | 21.2 | 6.3 | 3.0 | 17.0 | 21.0 | 25.0 | 50.0 | 8.0 |
| Respiratory | ||||||||
| All ages | 16.8 | 5.4 | 3.0 | 13.0 | 16.0 | 20.0 | 41.0 | 7.0 |
| Ages ≥65 years | 15.4 | 5.1 | 3.0 | 12.0 | 15.0 | 18.0 | 38.0 | 6.0 |
| Accidental | ||||||||
| All ages | 4.3 | 2.3 | 0.0 | 3.0 | 4.0 | 6.0 | 14.0 | 3.0 |
| Ages ≥65 years | 1.4 | 1.2 | 0.0 | 1.0 | 1.0 | 2.0 | 8.0 | 1.0 |
The visibility is based on the 24 h mean at lag 0–1 days. Higher values of visibility correspond to better visibility. Abbreviations: IQR: interquartile range, Min: minimum; Max: maximum; SD: standard deviation.
The average number of hazy days per year increased from 6 days in 1970 to 32 days in 2006 ( Fig. 1). Mean visibility (13.3 km) was higher than the median (12.4 km), indicating the distribution was mildly positively skewed (Table 1). The Spearman correlations between daily visibility and the concentrations of the four pollutants were negative ranging from r=−0.64 to −0.04. The Spearman correlations were high between visibility and PM10 (r=−0.64) and NO2 (r=−0.54) and low between visibility and O3 (r=−0.23) and SO2 (r=−0.04). Visibility increased with temperature (r=0.47), but the correlation between visibility and humidity was low (r=−0.17).
Fig. 1.
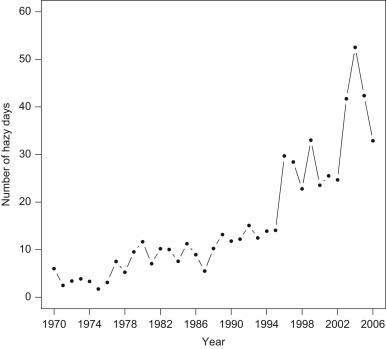
The average number of hazy days for each year defined according to the proportion of hours with visibility ≤8 km and relative humidity ≤80% observed at the Hong Kong Observatory, 1970–2006.
Concentrations of pollutants were generally highly correlated with monitoring stations. The ranges of Spearman correlations for concentrations of the four pollutants at eight monitoring stations were PM10: r=0.91–0.97, NO2: r=0.67–0.92, O3: r=0.62–0.89, and SO2: r=0.46–0.83 (data not shown). The means and standard deviations (SD) for the four pollutants in μg m−3 were, for PM10: 50.1–59.6 (SD: 26.5–32.8), NO2: 46.8–69.0 (SD: 20.9–23.6), O3: 27.5–56.3 (SD: 21.5–29.7) and, SO2: 15.0–25.1 (SD: 12.7–20.6) (data not shown). Humidity and visibility exhibited a marked seasonal variation with humidity highest in the warm season, but with visibility lowest in the cool season (October–March) and highest in the warm season (April–September), corresponding to the zenith and nadir of the annual seasonal pattern of concentrations for PM10, NO2, and O3 (data not shown).
3.2. Lag effect of visibility
We report the results using lag 0, lag 0–1, and the distributed lag for lag 0–4 days for an IQR (6.5 km) decrease in visibility. The largest effect at lag 0–4 was estimated for respiratory mortality followed by cardiovascular and non-accidental mortalities, ranging from 1.13 to 1.92 with ER% all statistically significant. The effects for the distributed lag 0–4 days were lower than for lag 0 and lag 0–1, with estimates ranging from −0.04 to 1.99 except for the respiratory mortality, which showed stronger effects. No statistically significant associations were found with accidental mortality ( Table 2). The lag pattern of the visibility effects was similar to PM10 with maximum effect at lag 0–1 for both visibility and PM10 (data not shown). The effect estimates of visibility were sensitive to lag specifications ( Fig. 2).
Table 2.
Estimated excess risks (ER%) for daily mortality and associated 95% confidence intervals (CI) per interquartile range decrease in visibility (6.5 km) under different lag models.
| Models |
||||||
|---|---|---|---|---|---|---|
| Lag 0 |
Lag 0–1 |
Distributed lag (lag 0–4) |
||||
| ER% | 95% CI | ER% | 95% CI | ER% | 95% CI | |
| Non-accidental | ||||||
| All ages | 0.92 | 0.38 to 1.47 | 1.13 | 0.49 to 1.76 | –0.04 | –0.90 to 0.81 |
| Ages ≥65 years | 1.21 | 0.59 to 1.83 | 1.37 | 0.65 to 2.09 | 0.21 | –0.76 to 1.18 |
| Cardiovascular | ||||||
| All ages | 1.21 | 0.20 to 2.22 | 1.31 | 0.13 to 2.49 | –0.09 | –1.67 to 1.49 |
| Ages ≥65 years | 1.55 | 0.45 to 2.65 | 1.72 | 0.44 to 3.00 | 0.42 | –1.30 to 2.13 |
| Respiratory | ||||||
| All ages | 1.19 | –0.05 to 2.42 | 1.92 | 0.49 to 3.35 | 1.99 | 0.09 to 3.90 |
| Ages ≥65 years | 1.18 | –0.10 to 2.47 | 1.76 | 0.28 to 3.25 | 1.88 | –0.11 to 3.86 |
| Accidental | ||||||
| All ages | 0.48 | –1.96 to 2.93 | 0.43 | –2.39 to 3.26 | 2.64 | –1.08 to 6.35 |
| Ages ≥65 years | 0.13 | –3.93 to 4.19 | –0.49 | –5.10 to 4.13 | –3.41 | –9.27 to 2.43 |
Fig. 2.
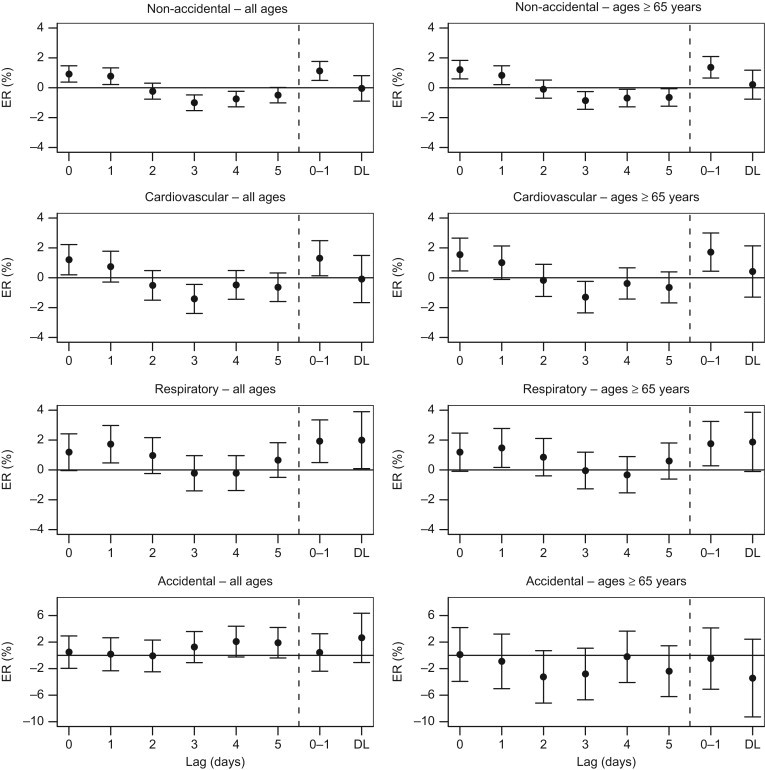
Estimated excess risks (ER%) for daily mortality and associated 95% confidence intervals per interquartile range decrease in visibility (6.5 km) at single lags 0–5, mean lag 0–1 (0–1) and distributed lag (DL) for lag 0–4 days.
3.3. Sensitivity analyses
We report the results of sensitivity analyses only for non-accidental mortality at all ages. In general, the effect estimates were statistically significant for all analyses with the exception of adjustments for air pollutants, which resulted in non-significant effect estimates. The effect estimates, which ranged from 0.91 to 1.18 were reduced by less than 20% from those in the main analysis, when we changed degrees of freedom for trends, excluded visibility observations with a cut-off limits for humidity >90%, excluded visibility observations falling below the 5th percentile, fitted average lag 0–2 days for temperature and humidity, and used natural cubic regression splines for smoothing. However, in other cases the effect estimates were reduced by more than 20%, ranging from 0.65 to 0.90 ( Table 3). The full set of results on other mortality outcomes is available in the Supplementary Material.
Table 3.
Estimated excess risks (ER%) for daily mortality and associated 95% confidence intervals (CI) per interquartile range decease in visibility (6.5 km) at lag 0–1days for non-accidental mortality at all ages compared with sensitivity analyses.
| ER% | 95% CI | |
|---|---|---|
| Main analysis with 4 degrees of freedom for trends per year | 1.13 | 0.49 to 1.76 |
| 1. Degrees of freedom for trends | ||
| a. 5 | 0.92 | 0.29 to 1.54 |
| b. 3 | 0.92 | 0.30 to 1.55 |
| 2. Exclusion of visibility with cut-off limit for humidity (%) | ||
| a.>90 | 1.11 | 0.49 to 1.73 |
| b.>80 | [0.70] | 0.08 to 1.33 |
| 3. Metric used for visibility | ||
| a. Mean based on the three measurements recorded at 10:00, 14:00 and 16:00 h | [0.72] | 0.19 to 1.24 |
| b. 24 h maximum | [0.90] | 0.40 to 1.39 |
| 4. Exclusion of extreme visibility range | ||
| a.<8 km | [0.85] | 0.11 to 1.58 |
| b.<The 25th percentile | [0.86] | 1.70 to 0.02 |
| c.<The 5th percentile | 0.91 | 0.24 to 1.58 |
| 5. Adjustment for air pollutants | ||
| a. PM10 | [0.65] | −1.57 to 0.27 |
| b. NO2 | [0.43] | −0.29 to 1.15 |
| c. O3 | [0.83] | 0.11 to 1.55 |
| d. SO2 | [0.65] | −0.02 to 1.31 |
| 6. Average lag 0–2 days for temperature and humidity | 1.18 | 0.56 to 1.80 |
| 7. Natural cubic regression splines | 1.14 | 0.49 to 1.78 |
Note: ER% in squared brackets when it changed >20% from the main analysis.
4. Discussion
In Hong Kong’s heavily polluted environment, we found that a decrease in visibility at lag 0–1 days was associated with increase in daily mortality, which was the largest for respiratory mortality followed by cardiovascular mortality and all non-accidental mortality. We found that the visibility effect estimates for mortality were comparable to those derived from specific air pollutants with respect to the magnitude, lag pattern, and the shape of exposure–response curves especially compared to the results derived from PM10 concentrations. The strongest association between visibility and mortality was for respiratory causes. In Hong Kong, fine particulate matter was the main contributor to the reduction in visibility with ammonium sulfate from regional sources being the largest component (51%) (Wang, 2003) and based on our limited data on PM2.5 for one station from 1998 to 2006, the Spearman correlation between visibility and PM2.5 was −0.78 (data not shown). This high correlation suggests that the use of the visual range as a measure of fine respirable particulates is a good proxy for estimating the effects of combustion particulates on mortality outcomes. The strongest effects on mortality were those associated with NO2 concentrations (data not shown), consistent with our previous analyses (Wong et al. 2008a). It is noteworthy that PM10 was strongly correlated with other pollutants, particularly with NO2, and the strong PM10 correlation with NO2 may have contributed to the ability to detect the effects of visibility on mortality.
The size of the effects and the cause-specific pattern of mortality indicate that some susceptible groups in the population may benefit more from improvements in the visibility range particularly among individuals with cardiovascular and respiratory diseases. The linear effect seen in all mortality outcomes and age groups suggests that there is no clear threshold value and the effect estimates from this study are consistent with a linear model without threshold for PM10 demonstrated in studies from Asia, West Europe, and North America (Daniels et al., 2000, Samoli et al., 2006, Pope and Dockery, 2006, Wong et al., 2008a). Further evidence on linear relationships between daily visibility and daily deaths in vulnerable subgroups, compared to the general population, would be provided by further cohort studies with both short- and long-term outcomes.
It is well recognized that meteorological conditions, in particular humidity, are strong determinants of visibility in urban settings. Malm and Day (2001) examined the association between reduction in visibility and humidity in the United States and argued that at 90% humidity the light scattering cross-section of ammonium sulfate particles may be increased by a factor of five or more times above that of dry particles. Sequeira and Lai (1998b) suggested a cut-off limit of 80% in humidity for assessing the visibility in Hong Kong, which lies close to the coast. This limit might remove measurements in which high levels of particulate matter were also associated with high humidity conditions; however, sensitivity analyses with these more stringent cut-off limits and excluding periods of fog and precipitation have not significantly affected our estimates of associations between visibility and mortality. They did not alter the conclusion that improved visibility leads to health benefits and that the estimation of low visibility is an effective surrogate for air pollutants in this region.
Previous studies on atmospheric visibility, including the estimation of fine particulates, suggested that midday visibility values were appropriate measures. They are more representative of regional visibility levels because daytime and nighttime visibilities are often incompatible and early morning fogs and high humidity, which may affect local conditions, are dispersed by midday (Ozkaynak et al., 1985, Abbey et al., 1995). Sensitivity analyses showed that different measures of visibility such as taking the mean visibility based on the three measurements recorded at 10:00, 14:00, and 16:00 h led to substantial decreases in the estimates by more than 20% compared to those from 24 h mean visibility. We used 24 h mean visibility, which yielded the mortality effect estimates most comparable to those derived from air pollutants.
Reduction in daily visibility is a widespread and increasing problem associated with deterioration in air quality in many East Asian and South Asian countries (Wang et al., 2009). One major problem has been the inadequate data on the ambient mass concentrations of the criteria air pollutants, but good visibility measurements are routinely recorded at most meteorological stations and at airfields, and often available over several years. In the absence of air pollutant data, the use of visibility measures can be deployed quickly by environmental health authorities for estimating the health effects of air pollution including the shape of exposure–response curves for mortality. This locally generated evidence can provide important support for public health through air quality improvement policies, particularly because of its potential to protect the health of susceptible subgroups in the population, including those who are socioeconomically deprived (Ou et al., 2008, Wong et al., 2008b).
4.1. Study strengths and limitations
Our study has several unique features. It covered eleven years of data with a large sample size of about 360,000 deaths and had high statistical power to detect significant associations in visibility associated mortality. The analytic method used in this study follows the current standard approach adopted in the assessment the of short-term effects of air pollution on mortality in daily time series studies (Samet et al., 2000). An important feature of this method is that the likelihood of confounding effects of visibility is minimized by removing other factors, which may be associated with variations in mortality. Once the core models were determined, visibility was entered to identify associations between visibility and mortality. So all potential observable time variant and unobservable confounding effects would have been reduced. Our data on visibility, air pollutants, mortality, and meteorology are reliable in that they have undergone rigorous quality control procedures performed independently by several government departments.
Some limitations were present in our study. First, even though our conclusion has internal consistency, it needs to be replicated in other jurisdictions because of different methodologies, which may be adopted for visibility and air pollutant measurements and the properties of air pollutant mixtures, which, especially for particulates, could be different from Hong Kong. Second, it must include recognition that visibility observations are surrogate measures of pollutants and not a measure of exposure, and that they could be misclassified because of the inherently subjective nature of visibility measurements, but these errors would ultimately bias the outcomes towards the null effect. Finally, as in all time series studies, data on mortality and covariates are collected at the aggregated level and caution should be exercised in drawing a causal association between the underlying effects of poor visibility and mortality.
5. Conclusions
The use of validated and robust methods suggests that decreased visibility was associated with increased risk for non-accidental, cardiovascular, and respiratory mortalities. Visibility measures, with face validity, can provide a useful tool for environmental health impact assessment in regions where air pollutant monitoring data are limited or absent. There is scope for further research to elucidate the role of visibility in the assessment of health effects associated with air pollution. From a public health viewpoint, our findings provide an effective means to support the development of risk perception and to communicate to policy makers, government officials, law makers, the general public and the media, the relevance of poor visibility to impaired quality of life, lost productivity, and environmental health problems.
Acknowledgments
The authors wish to thank the Environmental Protection Department for providing air pollutant data, the Hong Kong Observatory for visibility and meteorological data and the Census and Statistics Department for mortality data for this study.
Footnotes
Supplementary data associated with this article can be found in the online version at doi:10.1016/j.envres.2010.05.005.
Appendix A. Supplementary materials
Appendices.
References
- Abbey D.E., Ostro B.E., Fraser G., Vancuren T., Burchette R.J. Estimating fine particulates less than 2.5 microns in aerodynamic diameter (PM2.5) from airport visibility data in California. J. Expo. Anal. Environ. Epidemiol. 1995;5:161–180. [PubMed] [Google Scholar]
- Daniels M.J., Dominici F., Samet J.M., Zeger S.L. Estimating particulate matter-mortality dose–response curves and threshold levels: an analysis of daily time-series for the 20 largest US cities. Am. J. Epidemiol. 2000;152:397–406. doi: 10.1093/aje/152.5.397. [DOI] [PubMed] [Google Scholar]
- Hedley A.J., Wong C.M., Thach T.Q., Ma S., Lam T.H., Anderson H.R. Cardiorespiratory and all-cause mortality after restrictions on sulphur content of fuel in Hong Kong: an intervention study. Lancet. 2002;360:1646–1652. doi: 10.1016/s0140-6736(02)11612-6. [DOI] [PubMed] [Google Scholar]
- Hedley A.J., McGhee S.M., Barron B., Chau P., Chau J., Thach T.Q., Wong T.W., Loh C., Wong C.M. Air pollution: costs and paths to a solution in Hong Kong—understanding the connections among visibility, air pollution, and health costs in pursuit of accountability, environmental justice, and health protection. J. Toxicol. Environ. Health A. 2008;71:544–554. doi: 10.1080/15287390801997476. [DOI] [PubMed] [Google Scholar]
- Ho K.F., Lee S.C., Chan C.K., Yu J.C., Chow J.C., Yao X.H. Characterization of chemical species in PM2.5 and PM10 aerosols in Hong Kong. Atmos. Environ. 2003;37:31–39. [Google Scholar]
- Hong Kong Department of Health, 2005. Comparability of cause-of-death coding between ICD-9 and ICD-10. Available at 〈http://www.chp.gov.hk/files/pdf/grp-Com_of_CoD_Cod_Bet_ICD9-10-en-20051222.pdf〉. Accessed February 23, 2010.
- Hong Kong EPD, 2010. Air Quality Objectives. Available at 〈http://www.epd-asg.gov.hk/english/backgd/hkaqo.php〉. Accessed February 23, 2010.
- Hong Kong Observatory, 2009. Numbers of hours of reduced visibility observed at the Hong Kong Observatory since 1968. Available at 〈http://www.weather.gov.hk/cis/statistic/hko_redvis_statistic_e.htm〉. Accessed February 23, 2010.
- Huang W., Tan J., Kan H., Zhao N., Song W., Song G., Chen G., Jiang L., Jiang C., Chen R., Chen B. Visibility, air quality and daily mortality in Shanghai, China. Sci. Total Environ. 2009;407:3295–3300. doi: 10.1016/j.scitotenv.2009.02.019. [DOI] [PubMed] [Google Scholar]
- Jerrett M., Burnett R.T., Brook J., Kanaroglou P., Giovis C., Finkelstein N., Hutchison B. Do socioeconomic characteristics modify the short term association between air pollution and mortality? Evidence from a zonal time series in Hamilton, Canada. J. Epidemiol. Commun. Health. 2004;58:31–40. doi: 10.1136/jech.58.1.31. [DOI] [PMC free article] [PubMed] [Google Scholar]
- Knobel H.H., Chen C.J., Liang K.Y. Sudden infant death syndrome in relation to weather and optimetrically measured air-pollution in Taiwan. Pediatrics. 1995;96:1106–1110. [PubMed] [Google Scholar]
- Malm W., Day D.E. Estimates of aerosol species scattering characteristics a function of relative humidity. Atmos. Environ. 2001;35:2845–2860. [Google Scholar]
- Ostro B. Fine particulate air pollution and mortality in two southern California counties. Environ. Res. 1995;70:98–104. doi: 10.1006/enrs.1995.1053. [DOI] [PubMed] [Google Scholar]
- Ou C.Q., Hedley A.J., Chung R.Y., Thach T.Q., Chau Y.K., Chan K.P., Yang L., Ho S.Y., Wong C.M., Lam T.H. Socioeconomic disparities in air pollution-associated mortality. Environ. Res. 2008;107:237–244. doi: 10.1016/j.envres.2008.02.002. [DOI] [PubMed] [Google Scholar]
- Ozkaynak H., Schatz A.D., Thurston G.D. Relationship between aerosol extinction coefficients derived from airport visual range observations and alternative measures of airborne particle mass. J. Air Pollut. Control Assoc. 1985;35:1176–1185. [Google Scholar]
- Peters J., Hedley A.J., Wong C.M., Lam T.H., Ong S.G., Liu J., Spiegelhalter D.J. Effects of an ambient air pollution intervention and environmental tobacco smoke on children's respiratory health in Hong Kong. Int. J. Epidemiol. 1996;25:821–828. doi: 10.1093/ije/25.4.821. [DOI] [PubMed] [Google Scholar]
- Pope C.A., 3rd, Dockery D.W. Health effects of fine particulate air pollution: lines that connect. J. Air Waste Manag. Assoc. 2006;56:709–742. doi: 10.1080/10473289.2006.10464485. [DOI] [PubMed] [Google Scholar]
- Pueschel R.F., 1983. Effects of sulphur compounds and other air pollutants on visibility. WMO Environmental Pollution Monitoring Progamme Report No. 14.
- R Development Core Team . R: A Language and Environment for Statistical Computing. R Foundation for Statistical Computing; Vienna, Austria: 2009. [Google Scholar]
- Samet J.M., Zeger S.L., Dominici F., Curriero F., Coursac I., Dockery D.W., Schwartz J., Zanobetti A. The National Morbidity, Mortality, and Air Pollution Study. Part II: Morbidity and Mortality from Air Pollution in the United States. Health Effects Institute; Cambridge MA: 2000. [PubMed] [Google Scholar]
- Samoli E., Aga E., Touloumi G., Nisiotis K., Forsberg B., Lefranc A., Pekkanen J., Wojtyniak B., Schindler C., Niciu E., Brunstein R., Dodic Fikfak M., Schwartz J., Katsouyanni K. Short-term effects of nitrogen dioxide on mortality: an analysis within the APHEA project. Eur. Respir. J. 2006;27:1129–1138. doi: 10.1183/09031936.06.00143905. [DOI] [PubMed] [Google Scholar]
- Schwartz J. The distributed lag between air pollution and daily deaths. Epidemiology. 2000;11:320–326. doi: 10.1097/00001648-200005000-00016. [DOI] [PubMed] [Google Scholar]
- Sequeira R., Lai C.C. An analysis of the representative composition of rainwater at six locations in Hong Kong. Water Air Soil Pollut. 1998;107:289–301. [Google Scholar]
- Sequeira R., Lai K.H. The effect of meteorological parameters and aerosol constituents on visibility in urban Hong Kong. Atmos. Environ. 1998;32:2865–2871. [Google Scholar]
- Sloane C.S., White W.H. Visibility—an evolving issue. Environ. Sci. Technol. 1986;20:760–766. doi: 10.1021/es00150a600. [DOI] [PubMed] [Google Scholar]
- Streets D.G., Waldhoff S.T. Present and future emissions of air pollutants in China: SO2, NOx, and CO. Atmos. Environ. 2000;34:363–374. [Google Scholar]
- U.S. EPA, 1999. Guideline on data handling conventions for the PM NAAQS. Prepared by the office of air quality planning and standards, Research Triangle Park, North Carolina. EPA-454/R-99-008. April. Available at 〈http://www.epa.gov/ttn/oarpg/t1/memoranda/pmfinal.PDF〉. Accessed February 23, 2010.
- Vajanapoom N., Shy C.M., Neas L.M., Loomis D. Estimation of particulate matter from visibility in Bangkok, Thailand. J. Expos. Anal. Environ. Epidemiol. 2001;11:97–102. doi: 10.1038/sj.jea.7500148. [DOI] [PubMed] [Google Scholar]
- Wang T. Study of visibility reduction and its causes in Hong Kong. Air Services Group, The Environmental Protection Department of HKSAR.; 2003. Available at 〈 http://www.epd.gov.hk/epd/english/environmentinhk/air/studyrpts/files/study_of_visibility_reduction_and_its_causes_in_hk.pdf〉. Accessed February 23. [Google Scholar]
- Wang K., Dickinson R.E., Liang S. Clear sky visibility has decreased over land globally from 1973 to 2007. Science. 2009;323:1468–1470. doi: 10.1126/science.1167549. [DOI] [PubMed] [Google Scholar]
- Watson J.G. Visibility: science and regulation. J. Air Waste Manag. Assoc. 2002;52:628–713. doi: 10.1080/10473289.2002.10470813. [DOI] [PubMed] [Google Scholar]
- Wong C.M., Lam T.H., Peters J., Hedley A.J., Ong S.G., Tam A.Y.C., Liu J., Spiegelhalter D.J. Comparison between two districts of the effects of an air pollution intervention on bronchial responsiveness in primary school children in Hong Kong. J. Epidemiol. Commun. Health. 1998;52:571–578. doi: 10.1136/jech.52.9.571. [DOI] [PMC free article] [PubMed] [Google Scholar]
- Wong C.M., Ma S., Hedley A.J., Lam T.H. Effect of air pollution on daily mortality in Hong Kong. Environ. Health Perspect. 2001;109:335–340. doi: 10.1289/ehp.01109335. [DOI] [PMC free article] [PubMed] [Google Scholar]
- Wong T.W., Wun Y.T., Yu T.S., Tam W., Wong C.M., Wong A.H.S. Air pollution and general practice consultations for respiratory illnesses. J. Epidemiol. Commun. Health. 2002;56:949–950. doi: 10.1136/jech.56.12.949. [DOI] [PMC free article] [PubMed] [Google Scholar]
- Wong C.M., Atkinson R.W., Anderson H.R., Hedley A.J., Ma S., Chau P.Y.K., Lam T.H. A tale of two cities: effects of air pollution on hospital admissions in Hong Kong and London compared. Environ. Health Perspect. 2002;110:67–77. doi: 10.1289/ehp.0211067. [DOI] [PMC free article] [PubMed] [Google Scholar]
- Wong C.M., Vichit-Vadakan N., Kan H., Qian Z. Public health and air pollution in Asia (PAPA): a multicity study of short-term effects of air pollution on mortality. Environ. Health Perspect. 2008;116:1195–1202. doi: 10.1289/ehp.11257. [DOI] [PMC free article] [PubMed] [Google Scholar]
- Wong C.M., Ou C.Q., Chan K.P., Chau Y.K., Thach T.Q., Yang L., Chung R.Y.N., Thomas G.N., Peiris J.S.M., Wong T.W., Hedley A.J., Lam T.H. The effects of air pollution on mortality in socially deprived urban areas in Hong Kong, China. Environ. Health Perspect. 2008;116:1189–1194. doi: 10.1289/ehp.10850. [DOI] [PMC free article] [PubMed] [Google Scholar]
- Wood S.N. Generalized Additive Models: An Introduction with R. Chapman and Hall/CRC; Boca Raton, FL: 2006. [Google Scholar]
- World Meteorological Organization 2010. Measurement of visibility. Available at 〈http://www.wmo.int/pages/prog/www/IMOP/publications/CIMO-Guide/CIMO%20Guide%207th%20Edition,%202008/Part%20I/Chapter%209.pdf〉. Accessed February 23, 2010.
- Zanobetti A., Wand M.P., Schwartz J., Ryan L.M. Generalized additive distributed lag models: quantifying mortality displacement. Biostatistics. 2000;3:279–292. doi: 10.1093/biostatistics/1.3.279. [DOI] [PubMed] [Google Scholar]
Associated Data
This section collects any data citations, data availability statements, or supplementary materials included in this article.
Supplementary Materials
Appendices.