

Abstract
Study objectives:
Little is known of the nature of the recovery period after severe acute respiratory syndrome (SARS) infection. We hypothesized that structural changes of the lung might correlate with symptoms and pulmonary function. To answer this question, we correlate findings of high-resolution CT (HRCT) with dyspnea scores and results of pulmonary function tests in patients during recovery from SARS.
Design:
Retrospective follow-up cohort study.
Setting:
University hospital.
Patients:
Nineteen patients who recovered from SARS-related hospitalization.
Measurements:
The study included HRCT scores (0 to 100), dyspnea scores (1 to 4), static and dynamic lung volumes, and diffusing capacity of the lung for carbon monoxide (Dlco).
Results:
The interval between hospital discharge and HRCT study or functional assessment was 31.2 ± 4.8 days (range, 25 to 38 days) [mean ± SD]. All patients had HRCT abnormalities and were assigned to two groups: ground-glass opacity (GGO) only (n = 7, 36.8%) and GGO with fibrosis (GGO+F) [n = 12, 63.2%]. Most patients (16 of 19, 84.2%) had no zonal predominance. HRCT scores correlated well with dyspnea scores (r = 0.78, p < 0.01) and with a variety of pulmonary functional variables, with Dlco being the most significant (r = − 0.923, p < 0.001). Compared with the GGO group, the GGO+F group showed significantly lower FEV1, FVC, total lung capacity, residual volume, and Dlco.
Conclusions:
HRCT findings correlate well with functional studies and clinical symptoms during recovery from SARS. Longer-term follow-up studies in a larger cohort of patients should be performed to investigate the clinical outcome of recovered SARS patients.
Key words: ARDS, follow-up studies, high-resolution CT, pulmonary function tests, severe acute respiratory syndrome
Abbreviations: CDC, Centers for Disease Control and Prevention; Dlco, diffusing capacity of the lung for carbon monoxide; FEF50, forced expiratory flow at 50% of FVC; FRC, functional residual capacity; GGO, ground-glass opacity; GGO+F, ground-glass opacity with fibrosis; HRCT, high-resolution CT; NPS, nonpulse steroid; PFT, pulmonary function test; PS, pulse steroid; RT-PCR, reverse transcriptase-polymerase chain reaction; RV, residual volume; SARS, severe acute respiratory syndrome; SARS-CoV, severe acute respiratory syndrome-associated coronavirus; TLC, total lung capacity
A worldwide outbreak of severe acute respiratory syndrome (SARS) has been identified as a new clinical entity that often results in significant morbidity and mortality.1, 2, 3, 4 A novel virus, the mutated coronavirus, has been implicated as the causative pathogen.5, 6 In the Taiwan SARS epidemic, 671 patients who met the diagnosis of SARS based on the US Centers for Disease Control and Prevention (CDC) criteria7 were hospitalized, 84 of whom died.8 The clinical, radiologic, and other investigative findings at initial presentation and progression of SARS have been described previously.1, 2, 3, 4, 9, 10, 11 To date, investigations of outcome of patients during the recovery stage, focusing on those with persistent respiratory symptoms, have been limited.12, 13, 14 Among them, a recent report by Antonio et al12 described that fibrosis was present in 62% of their symptomatic patients with SARS after discharge, and suggested that fibrosis was more likely to develop in patients with more severe disease. However, the extent of disease evaluated by CT and its relationship to functional studies and symptoms in patients during recovery from SARS have not yet been reported. It is therefore important to have a more comprehensive insight into possible clinical outcome of patients with SARS during the recovery period to enable identification of patients who are not recovering at the expected rate.
We hypothesized that structural changes detected by high-resolution CT (HRCT) might correlate with symptoms and pulmonary function. A retrospective study was performed to examine the relationships among HRCT findings, pulmonary symptoms, and lung function in patients with persistent pulmonary symptoms during early recovery from SARS.
Materials and Methods
From June 1, 2003, to July 25, 2003, 52 patients with SARS who met specified discharge criteria12 were discharged from our hospital. The diagnosis leading to their original hospitalization was established based on the CDC definition of SARS.7 From a review of medical records for discharged patients with SARS, we identified patients who exhibited dyspnea with strenuous activity. All patients who remained symptomatic to this extent underwent HRCT and pulmonary function tests (PFTs) as part of their clinical evaluation. Patients who were not symptomatic could not be scanned for clinical purposes because the National Insurance Policy would not pay for the scans. Along with HRCT scans, patients underwent PFTs during follow-up to evaluate various degrees of persistent respiratory symptoms and form the basis of this study, while the other 33 patients did not have subjective respiratory complaints.
Confirmation of Clinical Diagnosis of SARS
Diagnoses of probable cases of SARS in all patients were based on the CDC criteria,7 and were confirmed by a positive reverse transcriptase- polymerase chain reaction (RT-PCR) test results for SARS-associated coronavirus (SARS-CoV) in either of the following samples as throat swab, serum, or urine collected from the patients. Samples from SARS patients in our institute were sent to the CDC in Taiwan, where RT-PCR was performed using a protocol described in a report by Hsueh et al.15 As an adjunct for confirming the diagnosis, IgG antibody to the SARS-CoV detected by a standard indirect fluorescence antibody assay with titers > 1:25 in serum was used to test the samples. This laboratory work was developed later than RT-PCR by the CDC in Taiwan, and was applied to 12 of our 19 patients. Among them, 8 of 12 patients undergoing this test had positive results.
CT Evaluation
HRCT examinations were performed with a Somatom Plus 4 CT scanner (Siemens; Erlangen, Germany). The scanning parameters were as follows: 2-mm collimation, 140 kilovolt peak, 129 mA, a scanning time of 1 s, and a 350-mm field of view. Images were reconstructed with a high-spatial-resolution algorithm for parenchymal analysis. Scans were obtained at the suspended end-inspiratory volume. All patients were scanned in the supine position, with additional scans obtained in the prone position to avoid physiologic-dependent areas of attenuation in the posterior lung. CT scans were reviewed for this study by two radiology specialists (H.H.H., W.C.C.), who were not aware of the identity of the patients or clinical findings.
Each individual section on the HRCT scans was assessed for the presence, distribution, and extent of pulmonary abnormalities such as ground-glass opacity (GGO), airspace consolidation, and fibrosis. The findings of irregular linear opacities, parenchymal bands, irregular interfaces, lung distortion, and traction bronchiectasis were considered to reflect fibrosis.16, 17 The distribution of each finding was classified as follows: predominantly in the upper, middle, or lower lung zone, or random; predominantly peripheral, peribronchovascular, or random; and patchy, diffuse, or random. The anatomic distribution was noted to be peripheral if there was a predominance of abnormalities in the outer third of the lung, peribronchovascular if the abnormalities had a close relationship to the bronchovascular bundles, and random if the abnormalities did not clearly fit into either of these categories.
HRCT Scoring
Employing a scoring method similar to one described previously,18 the extent of involvement was assessed for each of the three lung zones that corresponded to approximately one third of the images from the lung apex to 1 cm below the domes of the diaphragm. The CT score in upper, middle, and lower lung zones was determined by visual estimation of the extent of disease in each zone. The score represented the percentage of lung parenchyma that showed evidence of abnormalities, mainly areas of GGO and fibrosis, estimated to the nearest 10% of parenchymal involvement. The overall percentage of involvement was obtained by averaging the six lung zones by each individual observer. Reproducibility or intraobserver variability of HRCT scoring was determined by correlating readings at the same images twice by two individual observers not aware of any clinical information. Final scores were determined by an average of scores assessed by two observers with a difference within 5%. Readings were repeated when the difference of scores between two observers exceeded 5% until a consensus was reached.
Evaluation of Clinical Symptoms
By reviewing the degree of shortness of breath described in the medical records, we graded them into different scores according to a description by Staples et al.18 The dyspnea score was graded from 1 to 4: 1 = dyspnea with strenuous activity such as climbing three flights of stairs or heavy housework, 2 = dyspnea with mild activity such as climbing one flight of stairs or light housework, 3 = dyspnea with minimal activity such as walking 20 to 50 feet, and 4 = dyspnea at rest or while eating or talking.
Pulmonary Function Testing
PFTs were performed in our pulmonary function laboratory using standard procedures19 with the patient sitting in an upright position. The flow volume curve was observed during the maximal FVC maneuver until an accurate flow volume curve was obtained by coaching the patients. Spirometry and lung volumes were measured using a Jaeger Bodyscreen II-Bodybox (Jaeger, Germany) with Masterlab software (ML3; Jaeger). The following parameters were recorded: FEV1, FVC with the largest sum of FVC used for analysis, their ratio (FEV1/FVC), forced expiratory flow at 50% (FEF50) of FVC, total lung capacity (TLC), and functional residual capacity (FRC). Diffusing capacity of the lung for carbon monoxide (Dlco) was determined by the single-breath carbon monoxide technique using an infrared analyzer (Model 66200; SensorMedics; Yorba Linda, CA).
Statistical Analysis
The Pearson correlation test was used to determine the correlation between two readings of HRCT scores by each observer to determine the reproducibility as well as correlation between HRCT scores and pulmonary function measurements. The correlation between dyspnea and HRCT scores was examined with the Spearman correlation test. One-way analysis of variance was used to compare results of PFTs with dyspnea scores and with different CT patterns.
Results
There were 19 patients who remained symptomatic after discharge (6 men and 13 women; age range, 22 to 65 years; mean ± SD age, 42.5 ± 12.4 years). Each of these patients underwent HRCT scans and PFTs on the same day at follow-up, with an interval ranged from 25 to 38 days (mean ± SD, 31.2 ± 4.8 days) from discharge. There were six patients who progressed to ARDS. All patients were treated with a therapeutic regimen recommended by So et al,20 including 11 patients with pulse steroid (PS) and 8 patients with nonpulse steroid (NPS). Demographic, clinical data including smoking status, and information of HRCT study are summarized in Table 1 . It was noted that patients who progressed to ARDS had longer hospital stays than those who did not have ARDS (59.2 ± 30.5 days vs 18.4 ± 13.7 days, respectively; p = 0.0007).
Table 1.
Demographic, Clinical Data, and Information of Follow-up HRCT of 19 Patients With SARS
| Patient No. | Sex | Age, yr | Smoking Status, Pack-Years* | Hospital Stay, d | Mechanical Ventilation, d | Progress to ARDS | Steroid Regimen | Dyspnea Score | HRCT | ||
|---|---|---|---|---|---|---|---|---|---|---|---|
| Interval, d† | Patterns | Score | |||||||||
| 1 | Male | 37 | No | 15 | 0 | No | PS | 1 | 26 | GGO | 8 |
| 2 | Female | 33 | No | 16 | 0 | No | NPS | 1 | 37 | GGO | 4 |
| 3 | Female | 27 | No | 18 | 0 | No | NPS | 1 | 25 | GGO | 3 |
| 4 | Male | 45 | 13 | 33 | 5 | Yes | PS | 1 | 33 | GGO | 12 |
| 5 | Female | 60 | No | 21 | 0 | No | NPS | 1 | 38 | GGO | 6 |
| 6 | Female | 26 | No | 28 | 0 | No | PS | 2 | 36 | GGO | 28 |
| 7 | Female | 37 | No | 23 | 0 | No | NPS | 2 | 34 | GGO | 20 |
| 8 | Female | 47 | No | 48 | 14 | Yes | PS | 3 | 28 | GGO+F | 60 |
| 9 | Male | 46 | 21 | 19 | 0 | No | NPS | 1 | 29 | GGO+F | 9 |
| 10 | Male | 38 | 12 | 25 | 0 | No | NPS | 3 | 37 | GGO+F | 20 |
| 11 | Female | 22 | No | 34 | 9 | Yes | PS | 4 | 29 | GGO+F | 48 |
| 12 | Female | 42 | No | 28 | 0 | No | PS | 2 | 32 | GGO+F | 42 |
| 13 | Male | 65 | No | 31 | 10 | No | PS | 2 | 31 | GGO+F | 24 |
| 14 | Female | 24 | No | 17 | 0 | No | NPS | 2 | 25 | GGO+F | 5 |
| 15 | Female | 55 | No | 48 | 18 | Yes | PS | 2 | 35 | GGO+F | 50 |
| 16 | Female | 55 | No | 34 | 14 | No | PS | 2 | 28 | GGO+F | 40 |
| 17 | Female | 46 | No | 27 | 0 | No | NPS | 2 | 38 | GGO+F | 30 |
| 18 | Male | 52 | 20 | 53 | 22 | Yes | PS | 4 | 25 | GGO+F | 90 |
| 19 | Female | 50 | No | 62 | 21 | Yes | PS | 4 | 26 | GGO+F | 95 |
All patients with a smoking history were current smokers at the time they became ill.
Interval between hospital discharge and HRCT scan (same as that of PFT).
HRCT Study
HRCT findings consisted of bilateral patchy areas of GGO alone or accompanied by septal thickening (Fig 1 , top) in 7 patients (36.8%), or associated with superimposed areas of fibrosis (Fig 1, bottom) in 12 patients (63.2%). Based on the above-described description, we classified patients into two groups: GGO and GGO with fibrosis (GGO+F). Six of seven patients (85.7%) who had areas of GGO without fibrosis did not show zonal predominance, and predominant involvement in the middle lung zones was observed in only one patient (14.3%). A random distribution without any central or peripheral predominance was evident in five patients (71.4%), whereas peripheral and peribronchovascular distribution was present in one patient (14.3%). In the GGO+F group, fibrosis predominantly involved all three lung zones in 10 patients (83.3%), with a random distribution in both central and peripheral regions in 11 of 12 patients (91.7%). A peripheral distribution was observed in only one patient, and one patient had middle and lower lung zone predominance. With regards to results of HRCT score, a high reproducibility of HRCT scoring was supported by a good correlation between readings for two times at the same films by observer 1 (r = 0.994, p < 0.001) and observer 2 (r = 0.996, p < 0.001), respectively. Results of HRCT scoring for each patient were shown in Table 1. HRCT scores were significantly higher in patients who progressed to ARDS as compared with those who did not have ARDS: 46.3 ± 11.2 vs 23.2 ± 6.1, p < 0.0001, respectively.
Figure 1.
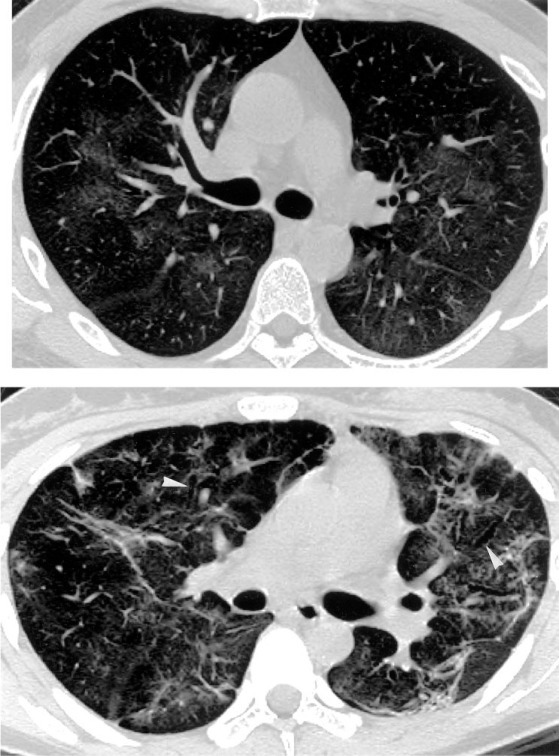
Top: HRCT scan of a 37-year-old man obtained 26 days after discharge from SARS-related hospitalization shows bilateral patchy areas of GGO without evidence of fibrosis, with random distribution in the transverse plane. Bottom: HRCT scan of a 22-year-old female SARS patient obtained 29 days after discharge shows random distribution of fibrosis consists of irregular linear opacities, traction bronchiectasis (arrowheads), and lung distortion. Concomitant presence of GGO is also visible.
Dyspnea Scoring and Pulmonary Function Testing
Dyspnea score correlated well with measurements of a panel of pulmonary function parameters, providing validation for the scoring system used in this study (Fig 2 ). HRCT scores correlated well with dyspnea scores (r = 0.78, p < 0.001) and various pulmonary function variables (Fig 3 ). Results of mean values of all measured functional parameters for the GGO and the GGO+F groups were listed in Table 2 . Compared with the GGO group, the GGO+F group showed significantly lower mean values for FEV1, FVC, TLC, RV, and Dlco (Fig 4 ).
Figure 2.
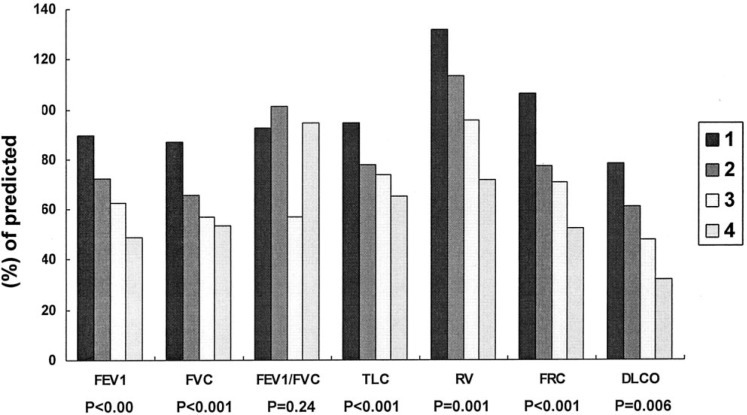
Comparison of pulmonary function measurements among four different grades of dyspnea scores.
Figure 3.
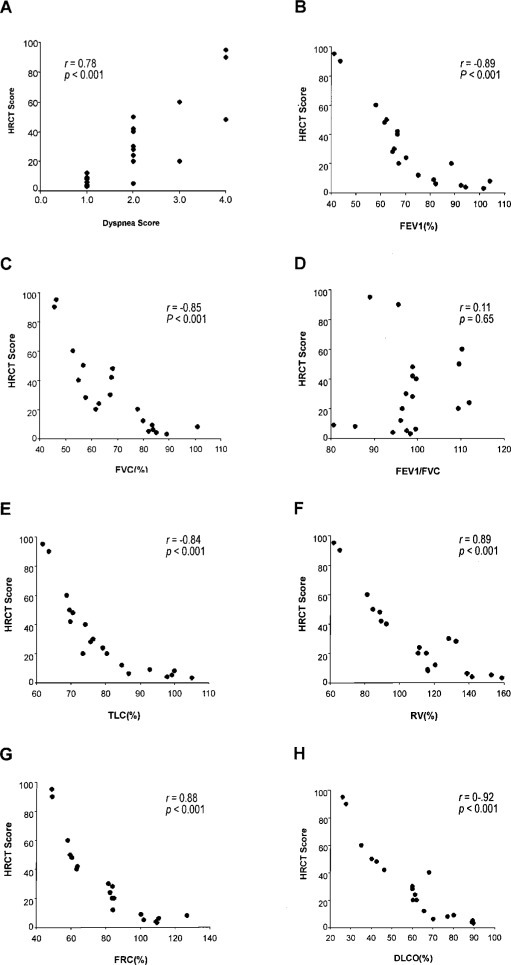
Correlation of HRCT scores with dyspnea scores (top left, A) and pulmonary function parameters (top right, B, through bottom right, H).
Table 2.
Comparison of Measurements of PFTs Between the GGO and the GGO+F Groups*
| Groups | FEV1 % Predicted | FVC % Predicted | FEV1/FVC Ratio | TLC % Predicted | RV % Predicted | FRC % Predicted | Dlco % Predicted | FEF50 % Predicted |
|---|---|---|---|---|---|---|---|---|
| GGO | 87.1 ± 14.1† | 81.9 ± 13.1† | 95.6 ± 4.7 | 89.9 ± 10.9† | 132.0 ± 15.8† | 101.0 ± 17.0 | 73.3 ± 12.2† | 106.1 ± 14.1 |
| GGO+F | 64.7 ± 13.9 | 62.3 ± 12.1 | 99.9 ± 9.3 | 75.3 ± 10.9 | 98.57 ± 26.3 | 68.18 ± 18.3 | 53.0 ± 20.1 | 87.26 ± 14.3 |
Data are presented as mean ± SD.
Significant difference vs GGO+F group at p ≤ 0.05.
Figure 4.
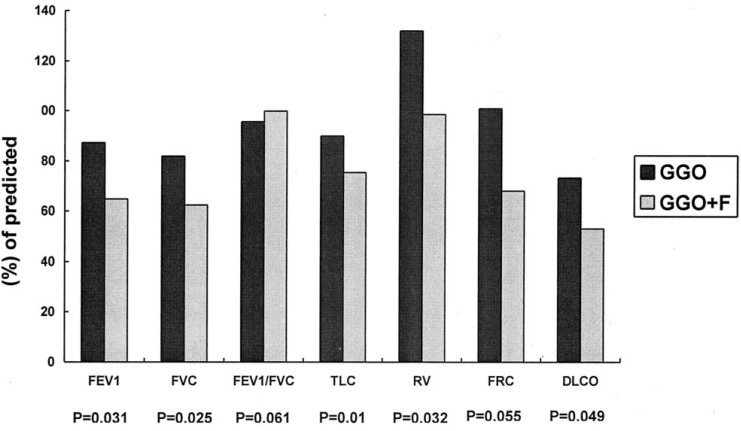
Comparison of pulmonary function measurements between the GGO and GGO+F groups.
Discussion
SARS was first reported in southern China in November 2002,21 and has spread rapidly to many countries over the world.1, 2, 3, 4 As of late July 2003, the 26 countries affected by SARS reported a cumulative total of 8,439 cases of SARS, 812 of which had resulted in death.22 In Taiwan, an outbreak began during late April 2003 at a hospital in the city of Taipei and soon spread throughout the whole island. We treated 68 patients at our institution during the Taiwan epidemic, 52 of whom were discharged and are now followed up at our hospital. Recent reports1, 11, 12, 13, 14 have demonstrated that CT is a highly sensitive imaging study for the diagnosis SARS, and its patterns have been well described in the acute and early recovery phases. To date, investigation of functional changes that might correlate with structural changes depicted by CT, focusing on those who experience persistent respiratory symptoms during recovery from SARS, has not been reported. We performed a retrospective study correlating pulmonary function and clinical symptoms in a cohort of SARS patients after discharge to develop a more comprehensive insight into their clinical outcomes during the early recovery phase.
Similar to results reported by Antonio et al,12 patients in this study represented 37% of all discharged SARS patients (19 of 52 patients). Both of these studies have the same limitation as to investigate structural changes of the lung by HRCT only for symptomatic patients of SARS during recovery. It would be interesting to compare symptomatic patients with asymptomatic patients to see whether symptomatic patients have more severe HRCT abnormalities than those of asymptomatic patients. In our study, major findings on HRCT were bilateral patchy areas of GGO with or without fibrosis. These findings were in general agreement with those of Antonio and colleagues.12 Similar to their finding of fibrosis in 62% of patients, we identified fibrosis in more than half of our patients (12 of 19 patients, 63%). It is difficult to know how many of these structural changes will resolve by time. In patients with evidence of fibrosis at HRCT, the importance of concomitant presence of ground-glass opacification is not clear. Presumably, areas of ground-glass opacification may represent either residual inflammation that may resolve or may evolve to fibrosis over time. To address this speculation, a longer term of follow-up may be needed. It is believed that pulmonary fibrosis observed at the recovery phase would at least in part account for the respiratory symptoms. Compared with CT findings as a predominant lower lobe and peripheral distribution during the acute phase of SARS reported by Wong et al,11 we and Antonio et al12 observed generally no predominance in distribution of parenchymal abnormalities. This difference in patterns of CT abnormalities suggests either that structural changes related to SARS evolve over time, or that the underlying pathophysiologic process may resolve at varying rates.
Dyspnea scoring for the evaluation of symptoms was validated by a good correlation with values of pulmonary function parameters. Furthermore, dyspnea scores correlated well with HRCT scores, indicating that pronounced symptoms may be attributed to a more extensive parenchymal involvement. This was further supported by a significant correlation between HRCT scores with a number of pulmonary function parameters that reflects reliably the severity of loss of the functioning lung.
Two groups of patients were identified based on HRCT findings of GGO only or GGO+F in our study and the study by Antonio et al.12 We were interested to investigate whether these two groups of patients differed in terms of their functional impairment. Both groups demonstrated reduced mean values for Dlco, FVC, TLC, and FRC, findings that typically reflect restrictive functional impairment, with GGO+F group the more severe group. The identification of significantly higher-than-normal mean values for residual volume (RV) in the GGO group may indicate air trapping within the areas of GGO. In contrast, a more pronounced reduction of Dlco combined with a significant restrictive functional impairment in the GGO+F group was consistent with functional loss that characterizes parenchymal fibrosis. Interestingly, the significantly elevated RV but normal FEF50 observed in the GGO group may imply a component of small airway obstruction suggested by previous reports23, 24, 25 that demonstrated a number of patients with early airway disease or resolving reversible airway dysfunction despite normal mid-flow values.
A recent autopsy study of patients with SARS by Franks et al26 suggested that the predominant feature of lung injury was diffuse alveolar damage with varying degrees of fibrin deposition within the peripheral airways. They concluded that the lung histology varied according to duration of illness. In their studies, cases with a time course > 10 days showed an organizing phase of diffuse alveolar damage and type II pneumocyte hyperplasia. CT findings of bronchiolitis obliterans organizing pneumonia are well characterized,27, 28, 29 and are similar to those of SARS.11 Taken together, results from previous pathologic and image studies, we speculate that a possible small airway dysfunction reflected by our pulmonary function study may be attributed to a possible presence of small airway obstruction within the area of GGO. In addition, GGO+F may reflect a repair process accompanying the parenchymal inflammation at varying phases of SARS, or may be a more extensive form of SARS-related lung injury reflected by a more pronounced functional impairment, as we have demonstrated.
The lung damage in SARS is believed to be associated with a cytokine storm elicited by viral antigen of the SARS-CoV, which may share a common pathogenesis of acute lung injury as part of systemic inflammatory response syndrome.12 The need of corticosteroid to treat SARS reflects the nature of SARS-related lung injury elicited by a cytokine storm. A recent report by Ho et al30 showed that PS therapy appeared to be a more efficacious and equally safe steroid regimen as compared with low-dose NPS in the acute stage of SARS. In contrast, we and Antonio et al12 employed a standard treatment protocol for SARS for adults recommended by So et al.20 All of our patients were treated with methylprednisolone in addition to the use of ribavirin and broad-spectrum antibiotics as diagnosis of SARS was confirmed. Unlike study reported by Ho et al,30 who divided their regimens of corticosteroid therapy into PS and NPS at the beginning of treatment for SARS, we administered PS only if the clinical condition worsened with deteriorating chest radiographic findings and decreasing oxygenation saturation. In our study, patients who had more pronounced HRCT abnormalities or worse PFTs results were virtually treated with PS because of a rapid deterioration of their clinical condition. It is therefore difficult to determine whether PS therapy was more efficacious than NPS based on our results. A prospective randomized trial and long-term follow-up of structural and functional changes of the lung is needed to determine whether PS is indeed superior to NPS in treating patients with SARS.
Recent reports3, 5 have shown that approximately 25 to 38% of patients with SARS progressed to ARDS. ARDS reflects the most severe form of SARS, which leads to a mortality rate of 48%, similar to that of ARDS in patients with other types of pneumonia, and in patients with SARS who required critical care.31 Notably, the medical response to SARS-related ARDS extends well beyond intensive care for ARDS caused by other etiology, as it involves an overwhelming public health issue.32 Viral pneumonia usually resolves without any clinical or radiologic sequelae,33 whereas SARS-related respiratory sequelae appeared to be quite common among its survivors as observed by us and others.12, 14 Intriguingly, follow-up CT scans of ARDS survivors other than SARS tend to be limited in extent, and usually show a predominance in ventral distribution of fibrosis and parenchymal opacification,34, 35 whereas pulmonary abnormalities of SARS-related ARDS appear random in their distribution and are usually extensive. A restrictive type of functional impairment and decreased Dlco in ARDS survivors has been described by previous reports.36, 37 However, Neff and colleagues38 reported recently that residual combined restrictive and obstructive type of functional impairment remained common in survivors of severe ARDS treated in surgical intensive unit. In general, lung volume and spirometric measurements returned to normal in most of the patients over time,37 but Dlco remained low in long-term follow-up.36, 37, 38 These results suggest that persistent decrease in Dlco reflects a permanent parenchymal damage of the lung as fibrosis in ARDS patients. Similarly, our evaluation on SARS-related functional changes in early recovery phase showed a restrictive defect and significantly decreased Dlco. It would be interesting to compare structural and functional changes in survivors of SARS-related ARDS during late recovery with those of ARDS survivors not related to SARS by a similar follow-up protocol.
We combined correlation studies of CT with clinical and functional parameters for patients during recovery from SARS. In this study, we demonstrated that HRCT analysis correlated well with functional studies and clinical symptoms with the most significant correlation with Dlco. In addition, all patients in our study showed restrictive functional impairment. Our results suggest a potential role of HRCT and pulmonary function testing to track respiratory sequelae related with SARS. Longer-duration follow-up studies in a larger cohort of patients should be performed to investigate the long-term clinical outcome of patients recovering from SARS.
ACKNOWLEDGMENT
The authors thank Dr. Mark Ferguson for reviewing this article.
Footnotes
Drs. Hsu, Tzao, and Wu contributed equally to this work.
References
- 1.Lee N, Hui D, Wu A. A major outbreak of severe acute respiratory syndrome in Hong Kong. N Engl J Med. 2003;348:1986–1994. doi: 10.1056/NEJMoa030685. [DOI] [PubMed] [Google Scholar]
- 2.Peiris JSM, Chu CM, Cheng VC. Clinical progression and viral load in a community outbreak of coronavirus-associated SARS pneumonia: a prospective study. Lancet. 2003;361:1767–1772. doi: 10.1016/S0140-6736(03)13412-5. [DOI] [PMC free article] [PubMed] [Google Scholar]
- 3.Lew TW, Kwek TK, Tai D. Acute respiratory distress syndrome in critically ill patients with severe acute respiratory syndrome. JAMA. 2003;290:374–380. doi: 10.1001/jama.290.3.374. [DOI] [PubMed] [Google Scholar]
- 4.Booth CM, Matukas LM, Tomlinson GA. Clinical features and short-term outcomes of 144 patients with SARS in the greater Toronto area. JAMA. 2003;289:2801–2809. doi: 10.1001/jama.289.21.JOC30885. [DOI] [PubMed] [Google Scholar]
- 5.Peiris JSM, Lai ST, Poon LL. Coronavirus as a possible cause of severe acute respiratory syndrome. Lancet. 2003;361:1319–1325. doi: 10.1016/S0140-6736(03)13077-2. [DOI] [PMC free article] [PubMed] [Google Scholar]
- 6.Drosten C, Gunther S, Preiser W. Identification of a novel coronavirus in patients with severe acute respiratory syndrome. N Engl J Med. 2003;348:1967–1976. doi: 10.1056/NEJMoa030747. [DOI] [PubMed] [Google Scholar]
- 7.From the Centers for Disease Control and Prevention Updated interim surveillance case definition for severe acute respiratory syndrome (SARS)–United States, April 29, 2003. JAMA. 2003;289:2637–2639. doi: 10.1001/jama.289.20.2637-b. [DOI] [PubMed] [Google Scholar]
- 8.Use of quarantine to prevent transmission of severe acute respiratory syndrome–Taiwan, 2003. MMWR Morb Mortal Wkly Rep. 2003;52:680–683. [PubMed] [Google Scholar]
- 9.Wong KT, Antonio GE, Hui DS. Severe acute respiratory syndrome: radiographic appearances and pattern of progression in 138 patients. Radiology. 2003;228:401–406. doi: 10.1148/radiol.2282030593. [DOI] [PubMed] [Google Scholar]
- 10.Grinblat L, Shulman H, Glickman A. Severe acute respiratory syndrome: radiographic review of 40 probable cases in Toronto, Canada. Radiology. 2003;228:802–809. doi: 10.1148/radiol.2283030671. [DOI] [PubMed] [Google Scholar]
- 11.Wong KT, Antonio GE, Hui DS. Thin-section CT of severe acute respiratory syndrome: evaluation of 73 patients exposed to or with the disease. Radiology. 2003;228:395–400. doi: 10.1148/radiol.2283030541. [DOI] [PubMed] [Google Scholar]
- 12.Antonio GE, Wong KT, Hui DS. Thin-section CT in patients with severe acute respiratory syndrome following hospital discharge: preliminary experience. Radiology. 2003;228:810–815. doi: 10.1148/radiol.2283030726. [DOI] [PubMed] [Google Scholar]
- 13.Goh JS, Tsou IY, Kaw GJ. Severe acute respiratory syndrome (SARS): imaging findings during the acute and recovery phases of disease. J Thorac Imaging. 2003;18:195–199. doi: 10.1097/00005382-200307000-00010. [DOI] [PubMed] [Google Scholar]
- 14.Han Y, Geng H, Feng W. A follow-up study of 69 discharged SARS patients. J Tradit Chin Med. 2003;23:214–217. [PubMed] [Google Scholar]
- 15.Hsueh PR, Hsiao CH, Yeh SH. Microbiologic characteristics, serologic responses, and clinical manifestations in severe acute respiratory syndrome, Taiwan. Emerg Infect Dis. 2003;9:1163–1167. doi: 10.3201/eid0909.030367. [DOI] [PMC free article] [PubMed] [Google Scholar]
- 16.Zerhouni EA, Naidich DP, Stitik FP. Computed tomography of the pulmonary parenchyma: Part 2. Interstitial disease. J Thorac Imaging. 1985;1:54–64. doi: 10.1097/00005382-198512000-00008. [DOI] [PubMed] [Google Scholar]
- 17.Webb WR, Muller NL, Naidich DP. High-resolution computed tomography findings of lung diseaseHigh-resolution CT of the lung. 3rd ed. Lippincott-Raven; Philadelphia, PA: 2001. pp. 71–192. [Google Scholar]
- 18.Staples CA, Muller NL, Vedal S. Usual interstitial pneumonia: correlation of CT with clinical, functional, and radiologic findings. Radiology. 1987;162:377–381. doi: 10.1148/radiology.162.2.3797650. [DOI] [PubMed] [Google Scholar]
- 19.American Thoracic Society Standardization of spirometry, 1994 update. Am J Respir Crit Care Med. 1995;152:1107–1136. doi: 10.1164/ajrccm.152.3.7663792. [DOI] [PubMed] [Google Scholar]
- 20.So LK, Lau AC, Yam LY. Development of a standard treatment protocol for severe acute respiratory syndrome. Lancet. 2003;361:1615–1617. doi: 10.1016/S0140-6736(03)13265-5. [DOI] [PMC free article] [PubMed] [Google Scholar]
- 21.Normile D, Enserink M. SARS in China: tracking the roots of a killer. Science. 2003;301:297–299. doi: 10.1126/science.301.5631.297. [DOI] [PubMed] [Google Scholar]
- 22.Centers for Disease Control and Prevention Whatnews for SARS. Available at: www.cdc.gov/ncidod/sars/whatnews.htm Accessed August 2, 2003.
- 23.McFadden ER, Jr, Kiser R, DeGroot WJ. Acute bronchial asthma: relations between clinical and physiologic manifestations. N Engl J Med. 1973;288:211–225. doi: 10.1056/NEJM197302012880501. [DOI] [PubMed] [Google Scholar]
- 24.Levine G, Housley E, MacLeod P. Gas exchange abnormalities in mild bronchitis and asymptomatic asthma. N Engl J Med. 1970;282:1277–1282. doi: 10.1056/NEJM197006042822301. [DOI] [PubMed] [Google Scholar]
- 25.Vulterini S, Bianco MR, Pellicciotti L. Lung mechanics in subjects showing increased residual volume without bronchial obstruction. Thorax. 1980;35:461–466. doi: 10.1136/thx.35.6.461. [DOI] [PMC free article] [PubMed] [Google Scholar]
- 26.Franks TJ, Chong PY, Chui P. Lung pathology of severe acute respiratory syndrome (SARS): a study of 8 autopsy cases from Singapore. Hum Pathol. 2003;34:743–748. doi: 10.1016/S0046-8177(03)00367-8. [DOI] [PMC free article] [PubMed] [Google Scholar]
- 27.Miki Y, Hatabu H, Takahashi M. Computed tomography of bronchiolitis obliterans. J Comput Assist Tomogr. 1988;12:512–514. doi: 10.1097/00004728-198805010-00034. [DOI] [PubMed] [Google Scholar]
- 28.Muller NL, Staples CA, Miller RR. Bronchiolitis obliterans organizing pneumonia: CT features in 14 patients. AJR Am J Roentgenol. 1990;154:983–987. doi: 10.2214/ajr.154.5.2108572. [DOI] [PubMed] [Google Scholar]
- 29.Nishimura K, Itoh H. High-resolution computed tomographic features of bronchiolitis obliterans organizing pneumonia. Chest. 1992;102:26S–31S. doi: 10.1378/chest.102.1_supplement.26s. [DOI] [PubMed] [Google Scholar]
- 30.Ho JC, Ooi GC, Mok TY. High dose pulse versus non-pulse corticosteroid regimens in severe acute respiratory syndrome. Am J Respir Crit Care Med. 2003;168:1449–1456. doi: 10.1164/rccm.200306-766OC. [DOI] [PubMed] [Google Scholar]
- 31.Rubenfeld GD. Is SARS just ARDS? JAMA. 2003;290:397–399. doi: 10.1001/jama.290.3.397-a. [DOI] [PubMed] [Google Scholar]
- 32.Pearson H. Animal studies hint at staying power of SARS. Nature. 2003;423:370–371. doi: 10.1038/423370b. [DOI] [PMC free article] [PubMed] [Google Scholar]
- 33.Razer RS, Muller NL, Colman N. Viruses, mycoplasmas, chlamydiae, and rickettsiae.Fraser and Pare’s diagnosis of disease of the chest. 4th ed. Saunders; Philadelphia, PA: 1999. pp. 979–1032. [Google Scholar]
- 34.Desai SR, Wells AU, Rubens MB. Acute respiratory distress syndrome: CT abnormalities at long-term follow-up. Radiology. 1999;210:29–35. doi: 10.1148/radiology.210.1.r99ja2629. [DOI] [PubMed] [Google Scholar]
- 35.Nobauer-Huhmann IM, Eibenberger K, Schaefer-Prokop C. Changes in lung parenchyma after acute respiratory distress syndrome (ARDS): assessment with high-resolution computed tomography. Eur Radiol. 2001;11:2436–2443. doi: 10.1007/s003300101103. [DOI] [PubMed] [Google Scholar]
- 36.Mchugh LG, Milberg JA, Whitcomb ME. Recovery of function in survivors of the acute respiratory distress syndrome. Am J Respir Crit Care Med. 1994;150:90–94. doi: 10.1164/ajrccm.150.1.8025779. [DOI] [PubMed] [Google Scholar]
- 37.Herridge MS, Cheung AM, Tansey CM. One-year outcomes in survivors of the acute respiratory distress syndrome. N Engl J Med. 2003;348:683–693. doi: 10.1056/NEJMoa022450. [DOI] [PubMed] [Google Scholar]
- 38.Neff TA, Stocker R, Frey HR. Long-term assessment of lung function in survivors of severe ARDS. Chest. 2003;123:845–853. doi: 10.1378/chest.123.3.845. [DOI] [PubMed] [Google Scholar]